

Key Insights
The global electric bus market is poised for substantial expansion, with projections indicating a market size of $44.81 billion by 2025. This significant growth is driven by a compound annual growth rate (CAGR) of 15.3%. Key factors fueling this surge include heightened environmental awareness, stringent government regulations targeting tailpipe emissions, and a growing public preference for sustainable, quiet, and efficient public transportation. Municipalities are increasingly investing in electric bus fleets to address urban air pollution and meet climate objectives. Advancements in battery technology, enhancing range and charging speed, further accelerate the adoption of electric buses as a viable and cost-effective alternative to conventional diesel vehicles.
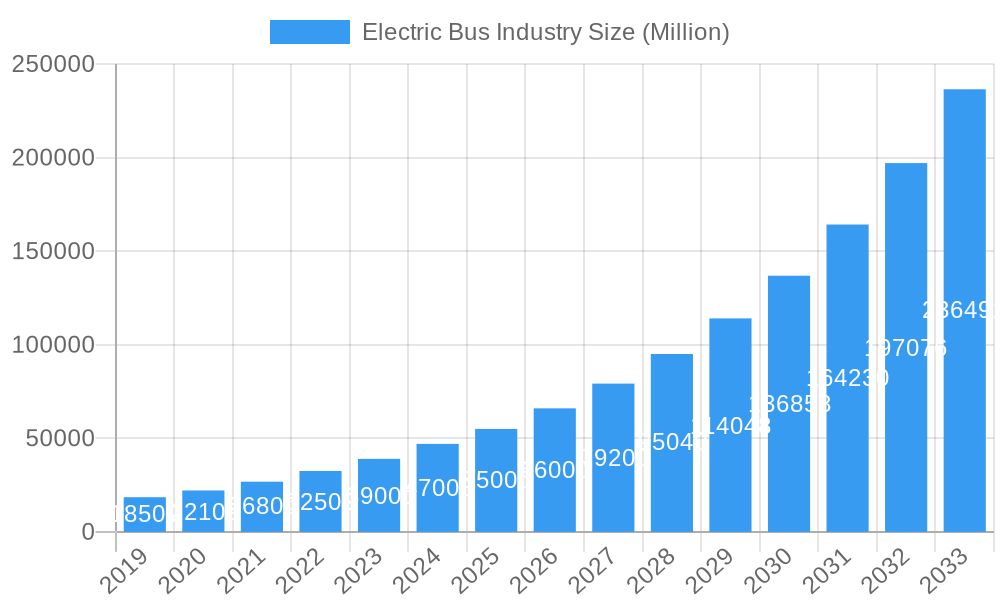
Electric Bus Industry Market Size (In Billion)
Market expansion is further supported by substantial investments and innovation from leading companies such as Ashok Leyland Limited, BYD Auto Industry Company Limited, and Volvo Group. These players are driving the development of advanced electric bus technologies, including Battery Electric Vehicles (BEVs), Fuel Cell Electric Vehicles (FCEVs), Hybrid Electric Vehicles (HEVs), and Plug-in Hybrid Electric Vehicles (PHEVs). The Asia Pacific region, led by China and India, is expected to command a significant market share due to favorable government policies, robust manufacturing capabilities, and large urban populations seeking improved public transit. North America and Europe are also experiencing considerable growth, spurred by ambitious emission reduction targets and a focus on sustainable urban mobility. While initial costs and charging infrastructure development remain challenges, continuous innovation and supportive policies are paving the way for an electric future in public transportation.
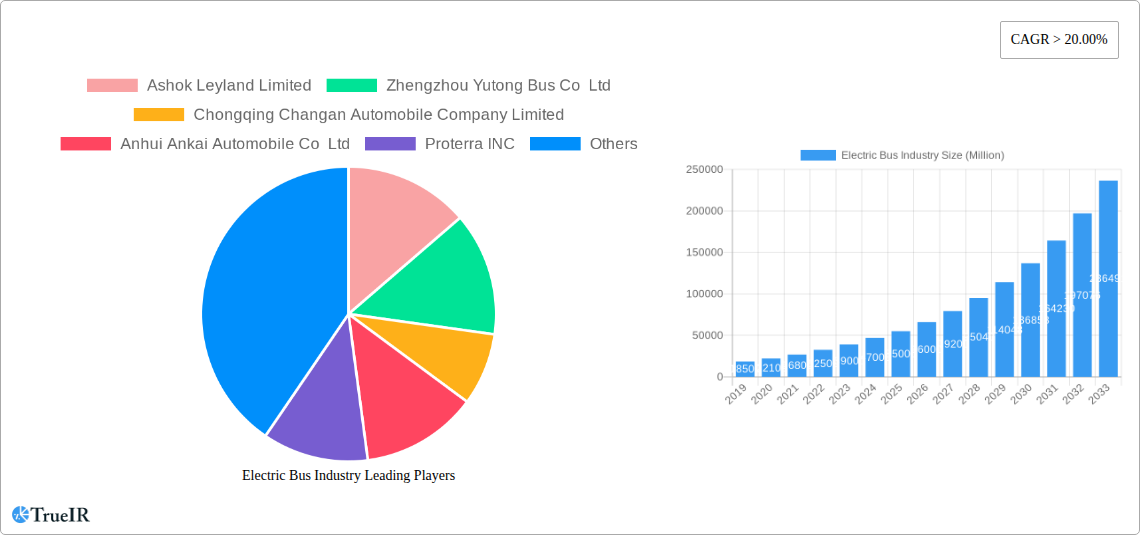
Electric Bus Industry Company Market Share
Electric Bus Industry Report: Unlocking a Sustainable Future of Urban Mobility
This comprehensive report dives deep into the dynamic Electric Bus Industry, analyzing market structure, trends, opportunities, and key players shaping the future of sustainable urban transportation. With a study period spanning 2019–2033, this in-depth analysis provides critical insights for stakeholders seeking to navigate this rapidly evolving sector. The Base Year for estimations is 2025, with a Forecast Period from 2025–2033, building upon a Historical Period of 2019–2024.
Electric Bus Industry Market Structure & Competitive Landscape
The electric bus industry is characterized by a moderately concentrated market structure, with a growing number of players vying for market share. Innovation drivers are primarily fueled by advancements in battery technology, charging infrastructure, and increasing government mandates for zero-emission public transportation. Regulatory impacts, such as emissions standards and subsidies for electric vehicle adoption, play a pivotal role in shaping market dynamics. Product substitutes, while limited for direct public transit, include alternative fuels and older diesel bus models, though the shift towards electrification is accelerating. End-user segmentation encompasses public transit agencies, private fleet operators, and corporate employee transportation. Mergers and acquisitions (M&A) trends are on the rise as established automotive giants and specialized EV manufacturers consolidate their positions and expand their product portfolios. For instance, recent M&A activities have seen companies like Ashok Leyland Limited and Tata Motors Limited strategically acquiring or partnering to enhance their electric bus capabilities. The industry's concentration ratio is evolving, with a few key players holding significant market positions but with new entrants and strategic alliances constantly reshaping the competitive landscape.
Electric Bus Industry Market Trends & Opportunities
The global electric bus market is experiencing robust growth, driven by an increasing imperative for sustainable urban mobility and stringent environmental regulations. Market size is projected to expand significantly, with a compound annual growth rate (CAGR) of approximately 20% projected over the forecast period. This expansion is fueled by a confluence of factors, including declining battery costs, government incentives for electric vehicle adoption, and growing public awareness of the environmental benefits of electric transportation. Technological shifts are predominantly centered around advancements in battery energy density, charging speeds, and thermal management systems, leading to longer ranges and reduced downtime for electric buses. Consumer preferences, particularly among urban commuters and transit authorities, are increasingly leaning towards quieter, cleaner, and more cost-effective transportation solutions, which electric buses readily provide.
Competitive dynamics are intensifying as both established automotive manufacturers and emerging electric vehicle specialists compete fiercely. Companies like BYD Auto Industry Company Limited and Zhengzhou Yutong Bus Co Ltd are leading the charge with extensive product portfolios and global reach. Proterra Inc. and NFI Group Inc. are also significant players, particularly in North America, focusing on innovative solutions and charging infrastructure. The market penetration rate of electric buses, while still nascent in many regions, is steadily increasing, with China leading the global adoption followed by Europe and North America.
Opportunities abound for companies that can offer integrated solutions, including vehicle manufacturing, charging infrastructure development, and fleet management services. The development of advanced battery chemistries, such as solid-state batteries, holds the potential to further revolutionize the industry by offering faster charging times and higher energy densities. Furthermore, the integration of smart technologies, including AI-powered route optimization and predictive maintenance, presents another avenue for growth and differentiation. The increasing demand for electric buses for school transportation and last-mile delivery services also opens up new market segments. The transition to electric buses is not merely a technological shift but a fundamental redefinition of public transportation, offering economic benefits through lower operating costs and significant environmental advantages.
Dominant Markets & Segments in Electric Bus Industry
The dominance in the electric bus industry is currently most pronounced in regions and segments that have actively fostered electric vehicle adoption through supportive policies and substantial investments. China stands out as the leading market, driven by strong government mandates, extensive manufacturing capabilities, and a vast domestic demand for public transportation solutions. The Battery Electric Vehicle (BEV) segment overwhelmingly dominates the fuel category, accounting for over 95% of the market share. This dominance is attributed to its proven technological maturity, established charging infrastructure, and lower upfront costs compared to other alternative fuel categories.
Key growth drivers in these dominant markets include:
- Supportive Government Policies: Mandates for fleet electrification, purchase subsidies, tax incentives, and investments in charging infrastructure are crucial. For example, China’s New Energy Vehicle (NEV) policy has been instrumental in driving BEV adoption.
- Urbanization and Environmental Concerns: Rapid urbanization in major economies necessitates cleaner public transport to combat air pollution and carbon emissions, making electric buses a preferred choice.
- Technological Advancements: Continuous improvements in battery technology, leading to increased range and reduced charging times, are making BEVs more practical and economically viable for transit operators.
- Total Cost of Ownership (TCO) Advantages: Despite higher initial purchase prices, the lower operational and maintenance costs of BEVs compared to diesel buses present a compelling economic argument for fleet operators.
While Fuel Cell Electric Vehicles (FCEV) and Hybrid Electric Vehicles (HEV), including Plug-in Hybrid Electric Vehicles (PHEV), are part of the broader electric bus landscape, their market penetration remains significantly lower. FCEVs are gaining traction in specific niche applications and geographical areas where hydrogen infrastructure is developing, but widespread adoption faces challenges related to hydrogen production costs and infrastructure build-out. HEVs and PHEVs serve as transitional technologies, offering some emissions benefits over conventional buses but are gradually being superseded by the all-electric BEV solutions as technology matures and costs decrease. The focus on zero-emission goals is pushing the industry towards BEVs as the primary electrification pathway.
Electric Bus Industry Product Analysis
Product innovations in the electric bus industry are primarily focused on enhancing battery performance, range, and charging capabilities. Companies are investing in lighter, more energy-dense battery packs, faster charging technologies, and efficient thermal management systems to optimize operational efficiency. Applications span a wide spectrum, from city transit buses and intercity coaches to school buses and specialized shuttle services. Competitive advantages are being carved out through a combination of factors including advanced powertrain technology, robust chassis design, superior passenger comfort features, and integrated fleet management software. Leading players like Volvo Group and Daimler Truck Holding AG are leveraging their extensive automotive expertise to develop reliable and high-performance electric bus models, while agile manufacturers such as BYD Auto Industry Company Limited are pushing boundaries with integrated battery and vehicle solutions.
Key Drivers, Barriers & Challenges in Electric Bus Industry
Key Drivers: The electric bus industry is propelled by a powerful combination of technological advancements, economic incentives, and stringent environmental policies. Governments worldwide are mandating the transition to zero-emission public transport to combat climate change and improve urban air quality. Technological innovations, particularly in battery technology, are making electric buses more efficient, affordable, and practical for large-scale deployment. Furthermore, the declining total cost of ownership, driven by lower fuel and maintenance expenses, presents a significant economic driver for fleet operators.
Barriers & Challenges: Despite the strong momentum, significant challenges impede widespread adoption. The high upfront cost of electric buses remains a barrier, although it is steadily decreasing. The availability and reliability of charging infrastructure, particularly in remote areas or for rapid charging needs, are critical concerns. Supply chain constraints for critical components like batteries and semiconductors can lead to production delays and cost increases. Regulatory complexities and varying standards across different regions can also create hurdles for manufacturers and operators. Competitive pressures are intense, demanding continuous innovation and cost optimization.
Growth Drivers in the Electric Bus Industry Market
The growth of the electric bus industry is primarily driven by a convergence of environmental regulations, technological advancements, and economic benefits. Governments globally are implementing ambitious climate targets, mandating the electrification of public transport fleets to reduce carbon footprints and improve air quality in urban centers. Technological progress, particularly in battery energy density, charging speed, and cost reduction, makes electric buses increasingly viable and attractive. Economically, the lower total cost of ownership, stemming from reduced fuel and maintenance expenses compared to diesel buses, provides a compelling incentive for transit authorities and fleet operators.
Challenges Impacting Electric Bus Industry Growth
Despite promising growth, the electric bus industry faces several critical challenges. The substantial upfront capital investment required for electric buses and charging infrastructure remains a significant barrier, particularly for smaller transit agencies. The limited availability and standardization of charging infrastructure in many regions can lead to operational constraints and range anxiety. Supply chain disruptions, including the availability of critical raw materials for batteries and semiconductors, pose a risk to production timelines and cost stability. Furthermore, evolving regulatory landscapes and the need for skilled technicians for maintenance and repair present ongoing hurdles for widespread adoption and operational efficiency.
Key Players Shaping the Electric Bus Industry Market
- Ashok Leyland Limited
- Zhengzhou Yutong Bus Co Ltd
- Chongqing Changan Automobile Company Limited
- Anhui Ankai Automobile Co Ltd
- Proterra INC
- Tata Motors Limited
- Daimler Truck Holding AG
- Volvo Group
- Zhejiang Geely Holding Group Co Ltd
- CRRC Electric Vehicle Co Ltd
- NFI Group Inc
- King Long United Automotive Industry Co Ltd
- BYD Auto Industry Company Limited
- Zhongtong Bus Holding Co Ltd
- Chery Automobile Co Ltd
Significant Electric Bus Industry Industry Milestones
- December 2023: Proterra announced its new EV battery factory in South Carolina as demand for commercial electric vehicles increased.
- November 2023: Switch Mobility partners with JSW for electric buses for employee transportation in India.
- September 2023: Daimler Buses launched the next generation Setra TopClass and ComfortClass touring coaches that meet the highest standards of safety, economy, and flexibility.
Future Outlook for Electric Bus Industry Market
The future outlook for the electric bus industry is exceptionally bright, characterized by continued strong growth and increasing innovation. Key catalysts include the ongoing global push for decarbonization, further advancements in battery technology leading to enhanced performance and reduced costs, and the expansion of charging infrastructure. Strategic opportunities lie in developing integrated mobility solutions that encompass vehicle manufacturing, charging infrastructure, and smart fleet management. The increasing adoption of electric buses by municipal transit agencies, coupled with growing interest from private fleet operators and corporate entities for sustainable transportation, signals substantial market potential for the coming decade.
Electric Bus Industry Segmentation
-
1. Fuel Category
- 1.1. BEV
- 1.2. FCEV
- 1.3. HEV
- 1.4. PHEV
Electric Bus Industry Segmentation By Geography
-
1. North America
- 1.1. United States
- 1.2. Canada
- 1.3. Mexico
-
2. South America
- 2.1. Brazil
- 2.2. Argentina
- 2.3. Rest of South America
-
3. Europe
- 3.1. United Kingdom
- 3.2. Germany
- 3.3. France
- 3.4. Italy
- 3.5. Spain
- 3.6. Russia
- 3.7. Benelux
- 3.8. Nordics
- 3.9. Rest of Europe
-
4. Middle East & Africa
- 4.1. Turkey
- 4.2. Israel
- 4.3. GCC
- 4.4. North Africa
- 4.5. South Africa
- 4.6. Rest of Middle East & Africa
-
5. Asia Pacific
- 5.1. China
- 5.2. India
- 5.3. Japan
- 5.4. South Korea
- 5.5. ASEAN
- 5.6. Oceania
- 5.7. Rest of Asia Pacific
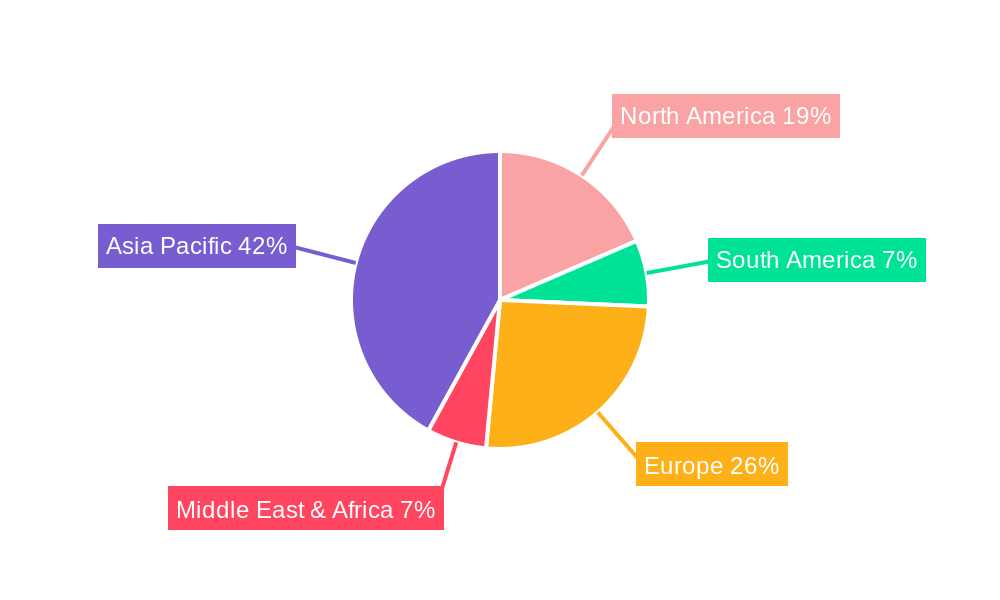
Electric Bus Industry Regional Market Share
Geographic Coverage of Electric Bus Industry
Electric Bus Industry REPORT HIGHLIGHTS
| Aspects | Details |
|---|---|
| Study Period | 2020-2034 |
| Base Year | 2025 |
| Estimated Year | 2026 |
| Forecast Period | 2026-2034 |
| Historical Period | 2020-2025 |
| Growth Rate | CAGR of 15.3% from 2020-2034 |
| Segmentation |
|
Table of Contents
- 1. Introduction
- 1.1. Research Scope
- 1.2. Market Segmentation
- 1.3. Research Objective
- 1.4. Definitions and Assumptions
- 2. Executive Summary
- 2.1. Market Snapshot
- 3. Market Dynamics
- 3.1. Market Drivers
- 3.2. Market Restrains
- 3.3. Market Trends
- 3.4. Market Opportunities
- 4. Market Factor Analysis
- 4.1. Porters Five Forces
- 4.1.1. Bargaining Power of Suppliers
- 4.1.2. Bargaining Power of Buyers
- 4.1.3. Threat of New Entrants
- 4.1.4. Threat of Substitutes
- 4.1.5. Competitive Rivalry
- 4.2. PESTEL analysis
- 4.3. BCG Analysis
- 4.3.1. Stars (High Growth, High Market Share)
- 4.3.2. Cash Cows (Low Growth, High Market Share)
- 4.3.3. Question Mark (High Growth, Low Market Share)
- 4.3.4. Dogs (Low Growth, Low Market Share)
- 4.4. Ansoff Matrix Analysis
- 4.5. Supply Chain Analysis
- 4.6. Regulatory Landscape
- 4.7. Current Market Potential and Opportunity Assessment (TAM–SAM–SOM Framework)
- 4.8. TIR Analyst Note
- 4.1. Porters Five Forces
- 5. Market Analysis, Insights and Forecast 2021-2033
- 5.1. Market Analysis, Insights and Forecast - by Fuel Category
- 5.1.1. BEV
- 5.1.2. FCEV
- 5.1.3. HEV
- 5.1.4. PHEV
- 5.2. Market Analysis, Insights and Forecast - by Region
- 5.2.1. North America
- 5.2.2. South America
- 5.2.3. Europe
- 5.2.4. Middle East & Africa
- 5.2.5. Asia Pacific
- 5.1. Market Analysis, Insights and Forecast - by Fuel Category
- 6. Global Electric Bus Industry Analysis, Insights and Forecast, 2021-2033
- 6.1. Market Analysis, Insights and Forecast - by Fuel Category
- 6.1.1. BEV
- 6.1.2. FCEV
- 6.1.3. HEV
- 6.1.4. PHEV
- 6.1. Market Analysis, Insights and Forecast - by Fuel Category
- 7. North America Electric Bus Industry Analysis, Insights and Forecast, 2020-2032
- 7.1. Market Analysis, Insights and Forecast - by Fuel Category
- 7.1.1. BEV
- 7.1.2. FCEV
- 7.1.3. HEV
- 7.1.4. PHEV
- 7.1. Market Analysis, Insights and Forecast - by Fuel Category
- 8. South America Electric Bus Industry Analysis, Insights and Forecast, 2020-2032
- 8.1. Market Analysis, Insights and Forecast - by Fuel Category
- 8.1.1. BEV
- 8.1.2. FCEV
- 8.1.3. HEV
- 8.1.4. PHEV
- 8.1. Market Analysis, Insights and Forecast - by Fuel Category
- 9. Europe Electric Bus Industry Analysis, Insights and Forecast, 2020-2032
- 9.1. Market Analysis, Insights and Forecast - by Fuel Category
- 9.1.1. BEV
- 9.1.2. FCEV
- 9.1.3. HEV
- 9.1.4. PHEV
- 9.1. Market Analysis, Insights and Forecast - by Fuel Category
- 10. Middle East & Africa Electric Bus Industry Analysis, Insights and Forecast, 2020-2032
- 10.1. Market Analysis, Insights and Forecast - by Fuel Category
- 10.1.1. BEV
- 10.1.2. FCEV
- 10.1.3. HEV
- 10.1.4. PHEV
- 10.1. Market Analysis, Insights and Forecast - by Fuel Category
- 11. Asia Pacific Electric Bus Industry Analysis, Insights and Forecast, 2020-2032
- 11.1. Market Analysis, Insights and Forecast - by Fuel Category
- 11.1.1. BEV
- 11.1.2. FCEV
- 11.1.3. HEV
- 11.1.4. PHEV
- 11.1. Market Analysis, Insights and Forecast - by Fuel Category
- 12. Competitive Analysis
- 12.1. Company Profiles
- 12.1.1 Ashok Leyland Limited
- 12.1.1.1. Company Overview
- 12.1.1.2. Products
- 12.1.1.3. Company Financials
- 12.1.1.4. SWOT Analysis
- 12.1.2 Zhengzhou Yutong Bus Co Ltd
- 12.1.2.1. Company Overview
- 12.1.2.2. Products
- 12.1.2.3. Company Financials
- 12.1.2.4. SWOT Analysis
- 12.1.3 Chongqing Changan Automobile Company Limited
- 12.1.3.1. Company Overview
- 12.1.3.2. Products
- 12.1.3.3. Company Financials
- 12.1.3.4. SWOT Analysis
- 12.1.4 Anhui Ankai Automobile Co Ltd
- 12.1.4.1. Company Overview
- 12.1.4.2. Products
- 12.1.4.3. Company Financials
- 12.1.4.4. SWOT Analysis
- 12.1.5 Proterra INC
- 12.1.5.1. Company Overview
- 12.1.5.2. Products
- 12.1.5.3. Company Financials
- 12.1.5.4. SWOT Analysis
- 12.1.6 Tata Motors Limited
- 12.1.6.1. Company Overview
- 12.1.6.2. Products
- 12.1.6.3. Company Financials
- 12.1.6.4. SWOT Analysis
- 12.1.7 Daimler Truck Holding AG
- 12.1.7.1. Company Overview
- 12.1.7.2. Products
- 12.1.7.3. Company Financials
- 12.1.7.4. SWOT Analysis
- 12.1.8 Volvo Group
- 12.1.8.1. Company Overview
- 12.1.8.2. Products
- 12.1.8.3. Company Financials
- 12.1.8.4. SWOT Analysis
- 12.1.9 Zhejiang Geely Holding Group Co Ltd
- 12.1.9.1. Company Overview
- 12.1.9.2. Products
- 12.1.9.3. Company Financials
- 12.1.9.4. SWOT Analysis
- 12.1.10 CRRC Electric Vehicle Co Ltd
- 12.1.10.1. Company Overview
- 12.1.10.2. Products
- 12.1.10.3. Company Financials
- 12.1.10.4. SWOT Analysis
- 12.1.11 NFI Group Inc
- 12.1.11.1. Company Overview
- 12.1.11.2. Products
- 12.1.11.3. Company Financials
- 12.1.11.4. SWOT Analysis
- 12.1.12 King Long United Automotive Industry Co Ltd
- 12.1.12.1. Company Overview
- 12.1.12.2. Products
- 12.1.12.3. Company Financials
- 12.1.12.4. SWOT Analysis
- 12.1.13 Byd Auto Industry Company Limited
- 12.1.13.1. Company Overview
- 12.1.13.2. Products
- 12.1.13.3. Company Financials
- 12.1.13.4. SWOT Analysis
- 12.1.14 Zhongtong Bus Holding Co Ltd
- 12.1.14.1. Company Overview
- 12.1.14.2. Products
- 12.1.14.3. Company Financials
- 12.1.14.4. SWOT Analysis
- 12.1.15 Chery Automobile Co Ltd
- 12.1.15.1. Company Overview
- 12.1.15.2. Products
- 12.1.15.3. Company Financials
- 12.1.15.4. SWOT Analysis
- 12.1.1 Ashok Leyland Limited
- 12.2. Market Entropy
- 12.2.1 Company's Key Areas Served
- 12.2.2 Recent Developments
- 12.3. Company Market Share Analysis 2025
- 12.3.1 Top 5 Companies Market Share Analysis
- 12.3.2 Top 3 Companies Market Share Analysis
- 12.4. List of Potential Customers
- 13. Research Methodology
List of Figures
- Figure 1: Global Electric Bus Industry Revenue Breakdown (billion, %) by Region 2025 & 2033
- Figure 2: North America Electric Bus Industry Revenue (billion), by Fuel Category 2025 & 2033
- Figure 3: North America Electric Bus Industry Revenue Share (%), by Fuel Category 2025 & 2033
- Figure 4: North America Electric Bus Industry Revenue (billion), by Country 2025 & 2033
- Figure 5: North America Electric Bus Industry Revenue Share (%), by Country 2025 & 2033
- Figure 6: South America Electric Bus Industry Revenue (billion), by Fuel Category 2025 & 2033
- Figure 7: South America Electric Bus Industry Revenue Share (%), by Fuel Category 2025 & 2033
- Figure 8: South America Electric Bus Industry Revenue (billion), by Country 2025 & 2033
- Figure 9: South America Electric Bus Industry Revenue Share (%), by Country 2025 & 2033
- Figure 10: Europe Electric Bus Industry Revenue (billion), by Fuel Category 2025 & 2033
- Figure 11: Europe Electric Bus Industry Revenue Share (%), by Fuel Category 2025 & 2033
- Figure 12: Europe Electric Bus Industry Revenue (billion), by Country 2025 & 2033
- Figure 13: Europe Electric Bus Industry Revenue Share (%), by Country 2025 & 2033
- Figure 14: Middle East & Africa Electric Bus Industry Revenue (billion), by Fuel Category 2025 & 2033
- Figure 15: Middle East & Africa Electric Bus Industry Revenue Share (%), by Fuel Category 2025 & 2033
- Figure 16: Middle East & Africa Electric Bus Industry Revenue (billion), by Country 2025 & 2033
- Figure 17: Middle East & Africa Electric Bus Industry Revenue Share (%), by Country 2025 & 2033
- Figure 18: Asia Pacific Electric Bus Industry Revenue (billion), by Fuel Category 2025 & 2033
- Figure 19: Asia Pacific Electric Bus Industry Revenue Share (%), by Fuel Category 2025 & 2033
- Figure 20: Asia Pacific Electric Bus Industry Revenue (billion), by Country 2025 & 2033
- Figure 21: Asia Pacific Electric Bus Industry Revenue Share (%), by Country 2025 & 2033
List of Tables
- Table 1: Global Electric Bus Industry Revenue billion Forecast, by Fuel Category 2020 & 2033
- Table 2: Global Electric Bus Industry Revenue billion Forecast, by Region 2020 & 2033
- Table 3: Global Electric Bus Industry Revenue billion Forecast, by Fuel Category 2020 & 2033
- Table 4: Global Electric Bus Industry Revenue billion Forecast, by Country 2020 & 2033
- Table 5: United States Electric Bus Industry Revenue (billion) Forecast, by Application 2020 & 2033
- Table 6: Canada Electric Bus Industry Revenue (billion) Forecast, by Application 2020 & 2033
- Table 7: Mexico Electric Bus Industry Revenue (billion) Forecast, by Application 2020 & 2033
- Table 8: Global Electric Bus Industry Revenue billion Forecast, by Fuel Category 2020 & 2033
- Table 9: Global Electric Bus Industry Revenue billion Forecast, by Country 2020 & 2033
- Table 10: Brazil Electric Bus Industry Revenue (billion) Forecast, by Application 2020 & 2033
- Table 11: Argentina Electric Bus Industry Revenue (billion) Forecast, by Application 2020 & 2033
- Table 12: Rest of South America Electric Bus Industry Revenue (billion) Forecast, by Application 2020 & 2033
- Table 13: Global Electric Bus Industry Revenue billion Forecast, by Fuel Category 2020 & 2033
- Table 14: Global Electric Bus Industry Revenue billion Forecast, by Country 2020 & 2033
- Table 15: United Kingdom Electric Bus Industry Revenue (billion) Forecast, by Application 2020 & 2033
- Table 16: Germany Electric Bus Industry Revenue (billion) Forecast, by Application 2020 & 2033
- Table 17: France Electric Bus Industry Revenue (billion) Forecast, by Application 2020 & 2033
- Table 18: Italy Electric Bus Industry Revenue (billion) Forecast, by Application 2020 & 2033
- Table 19: Spain Electric Bus Industry Revenue (billion) Forecast, by Application 2020 & 2033
- Table 20: Russia Electric Bus Industry Revenue (billion) Forecast, by Application 2020 & 2033
- Table 21: Benelux Electric Bus Industry Revenue (billion) Forecast, by Application 2020 & 2033
- Table 22: Nordics Electric Bus Industry Revenue (billion) Forecast, by Application 2020 & 2033
- Table 23: Rest of Europe Electric Bus Industry Revenue (billion) Forecast, by Application 2020 & 2033
- Table 24: Global Electric Bus Industry Revenue billion Forecast, by Fuel Category 2020 & 2033
- Table 25: Global Electric Bus Industry Revenue billion Forecast, by Country 2020 & 2033
- Table 26: Turkey Electric Bus Industry Revenue (billion) Forecast, by Application 2020 & 2033
- Table 27: Israel Electric Bus Industry Revenue (billion) Forecast, by Application 2020 & 2033
- Table 28: GCC Electric Bus Industry Revenue (billion) Forecast, by Application 2020 & 2033
- Table 29: North Africa Electric Bus Industry Revenue (billion) Forecast, by Application 2020 & 2033
- Table 30: South Africa Electric Bus Industry Revenue (billion) Forecast, by Application 2020 & 2033
- Table 31: Rest of Middle East & Africa Electric Bus Industry Revenue (billion) Forecast, by Application 2020 & 2033
- Table 32: Global Electric Bus Industry Revenue billion Forecast, by Fuel Category 2020 & 2033
- Table 33: Global Electric Bus Industry Revenue billion Forecast, by Country 2020 & 2033
- Table 34: China Electric Bus Industry Revenue (billion) Forecast, by Application 2020 & 2033
- Table 35: India Electric Bus Industry Revenue (billion) Forecast, by Application 2020 & 2033
- Table 36: Japan Electric Bus Industry Revenue (billion) Forecast, by Application 2020 & 2033
- Table 37: South Korea Electric Bus Industry Revenue (billion) Forecast, by Application 2020 & 2033
- Table 38: ASEAN Electric Bus Industry Revenue (billion) Forecast, by Application 2020 & 2033
- Table 39: Oceania Electric Bus Industry Revenue (billion) Forecast, by Application 2020 & 2033
- Table 40: Rest of Asia Pacific Electric Bus Industry Revenue (billion) Forecast, by Application 2020 & 2033
Frequently Asked Questions
1. What is the projected Compound Annual Growth Rate (CAGR) of the Electric Bus Industry?
The projected CAGR is approximately 15.3%.
2. Which companies are prominent players in the Electric Bus Industry?
Key companies in the market include Ashok Leyland Limited, Zhengzhou Yutong Bus Co Ltd, Chongqing Changan Automobile Company Limited, Anhui Ankai Automobile Co Ltd, Proterra INC, Tata Motors Limited, Daimler Truck Holding AG, Volvo Group, Zhejiang Geely Holding Group Co Ltd, CRRC Electric Vehicle Co Ltd, NFI Group Inc, King Long United Automotive Industry Co Ltd, Byd Auto Industry Company Limited, Zhongtong Bus Holding Co Ltd, Chery Automobile Co Ltd.
3. What are the main segments of the Electric Bus Industry?
The market segments include Fuel Category.
4. Can you provide details about the market size?
The market size is estimated to be USD 44.81 billion as of 2022.
5. What are some drivers contributing to market growth?
Growing Travel and Tourism Industry is Driving the Car Rental Market.
6. What are the notable trends driving market growth?
OTHER KEY INDUSTRY TRENDS COVERED IN THE REPORT.
7. Are there any restraints impacting market growth?
Increasing Popularity of Ride-Sharing Services Pose Challenges for the Conventional Car Rental Market.
8. Can you provide examples of recent developments in the market?
December 2023: Proterra announced its new EV battery factory in South Carolina as demand for commercial electric vehicles increased.November 2023: Switch Mobilty partners with JSW for electric buses for employee transportation in India.September 2023: Daimler Buses launched the next generation Setra TopClass and ComfortClass touring coaches that meet the highest standards of safety, economy, and flexibility.
9. What pricing options are available for accessing the report?
Pricing options include single-user, multi-user, and enterprise licenses priced at USD 3800, USD 4500, and USD 5800 respectively.
10. Is the market size provided in terms of value or volume?
The market size is provided in terms of value, measured in billion.
11. Are there any specific market keywords associated with the report?
Yes, the market keyword associated with the report is "Electric Bus Industry," which aids in identifying and referencing the specific market segment covered.
12. How do I determine which pricing option suits my needs best?
The pricing options vary based on user requirements and access needs. Individual users may opt for single-user licenses, while businesses requiring broader access may choose multi-user or enterprise licenses for cost-effective access to the report.
13. Are there any additional resources or data provided in the Electric Bus Industry report?
While the report offers comprehensive insights, it's advisable to review the specific contents or supplementary materials provided to ascertain if additional resources or data are available.
14. How can I stay updated on further developments or reports in the Electric Bus Industry?
To stay informed about further developments, trends, and reports in the Electric Bus Industry, consider subscribing to industry newsletters, following relevant companies and organizations, or regularly checking reputable industry news sources and publications.
Methodology
Step 1 - Identification of Relevant Samples Size from Population Database


Step 2 - Approaches for Defining Global Market Size (Value, Volume* & Price*)

Note*: In applicable scenarios
Step 3 - Data Sources
Primary Research
- Web Analytics
- Survey Reports
- Research Institute
- Latest Research Reports
- Opinion Leaders
Secondary Research
- Annual Reports
- White Paper
- Latest Press Release
- Industry Association
- Paid Database
- Investor Presentations

Step 4 - Data Triangulation
Involves using different sources of information in order to increase the validity of a study
These sources are likely to be stakeholders in a program - participants, other researchers, program staff, other community members, and so on.
Then we put all data in single framework & apply various statistical tools to find out the dynamic on the market.
During the analysis stage, feedback from the stakeholder groups would be compared to determine areas of agreement as well as areas of divergence