

Key Insights
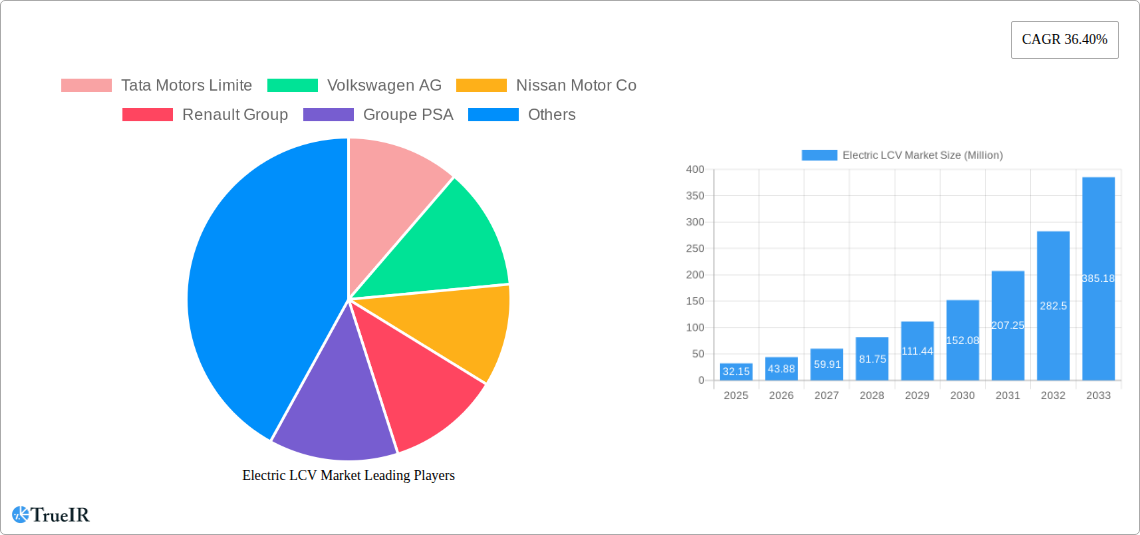
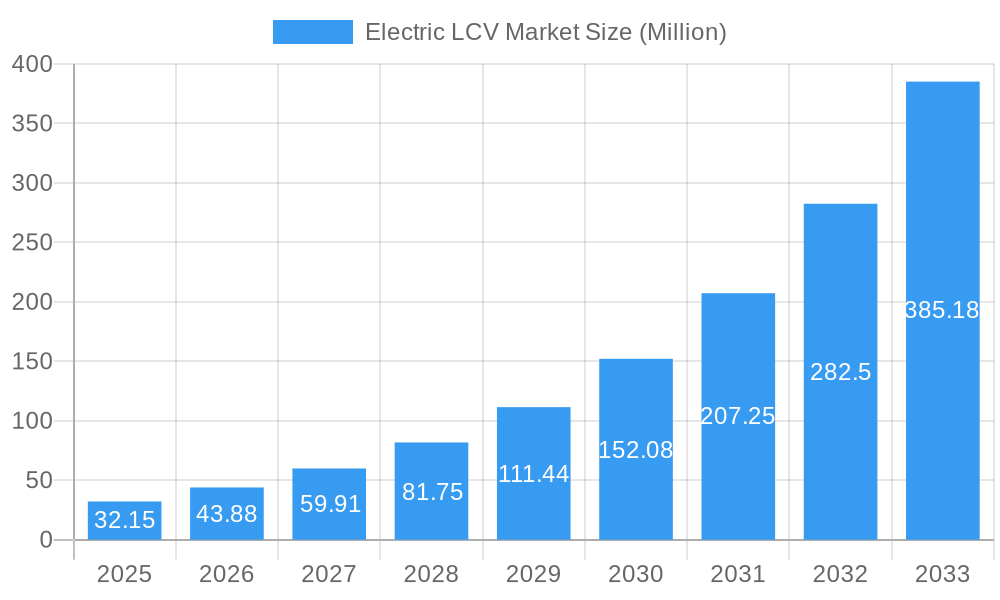
The global Electric Light Commercial Vehicle (LCV) market is poised for explosive growth, projected to reach a substantial USD 32.15 million by 2025 and expand at an impressive Compound Annual Growth Rate (CAGR) of 36.40% throughout the forecast period of 2025-2033. This robust expansion is primarily fueled by a confluence of factors including increasingly stringent government regulations on emissions and the growing adoption of sustainable logistics. Businesses are actively seeking to reduce their carbon footprint, making electric LCVs a compelling proposition for last-mile delivery, urban logistics, and a variety of commercial applications. Furthermore, advancements in battery technology, leading to enhanced range and reduced charging times, coupled with declining battery costs, are making electric LCVs more economically viable and practical for fleet operators. The growing awareness among consumers and businesses about the long-term operational cost savings, including lower fuel and maintenance expenses, is a significant driver for this market's rapid ascent.
Electric LCV Market Market Size (In Million)
The market landscape is characterized by a dynamic shift towards Battery Electric Vehicles (BEVs), which are expected to dominate the propulsion type segment due to their zero-emission capabilities and improving infrastructure. Hybrid Electric Vehicles (HEVs) will likely serve as a transitional technology, while Fuel Cell Electric Vehicles (FCEVs) may gain traction in specific niches requiring longer ranges and faster refueling. In terms of vehicle types, vans are anticipated to lead the charge, driven by the booming e-commerce sector and the need for efficient urban delivery solutions. Pick-up trucks are also set to witness significant adoption, particularly in regions with strong utility and work vehicle markets. Power output segmentation suggests a balanced demand across various power ranges, catering to diverse operational needs, from urban agility to heavy-duty hauling. Key players like Tata Motors, Volkswagen AG, Nissan Motor Co., BYD Group, and Tesla Inc. are heavily investing in research and development, expanding their product portfolios, and forming strategic partnerships to capture a larger share of this burgeoning market. The competitive landscape is intensifying with both established automotive giants and agile new entrants vying for dominance.
Electric LCV Market Company Market Share
Electric LCV Market: Comprehensive Industry Analysis and Forecast (2019-2033)
This in-depth report provides a dynamic and SEO-optimized analysis of the global Electric Light Commercial Vehicle (LCV) market. Spanning the historical period of 2019-2024 and projecting growth through 2033, this report leverages high-volume keywords to deliver unparalleled insights for industry stakeholders. With a base year of 2025 and an estimated year also set at 2025, we offer a comprehensive understanding of market dynamics, trends, opportunities, and the competitive landscape. This report is designed for immediate use without requiring further modification.
Electric LCV Market Market Structure & Competitive Landscape
The Electric LCV market exhibits a moderately consolidated structure, with a few key players holding significant market share. Innovation drivers are primarily centered around battery technology advancements, charging infrastructure expansion, and increasing demand for sustainable logistics solutions. Regulatory impacts are substantial, with government incentives, emission mandates, and evolving urban access restrictions actively shaping market penetration. Product substitutes, such as traditional Internal Combustion Engine (ICE) LCVs, remain a competitive force, though their dominance is steadily eroding. End-user segmentation highlights strong growth in e-commerce, last-mile delivery, and urban logistics sectors. Mergers & Acquisitions (M&A) trends are observed, with established automotive manufacturers acquiring or partnering with innovative EV startups to accelerate their electrification strategies. For instance, consolidation efforts aim to optimize supply chains and expand product portfolios. The global electric LCV market size is projected to witness significant expansion, driven by these structural elements.
- Market Concentration: Dominated by established automotive giants and emerging EV specialists.
- Innovation Drivers: Battery cost reduction, improved range, faster charging, autonomous driving features.
- Regulatory Impacts: Emission standards (e.g., Euro 7), ZEV mandates, government subsidies and tax credits.
- Product Substitutes: ICE LCVs, hybrid LCVs.
- End-User Segmentation: E-commerce & Logistics, Utilities, Construction, Public Services, Pharmaceuticals.
- M&A Trends: Strategic partnerships, acquisitions of battery technology companies, joint ventures for production.
Electric LCV Market Market Trends & Opportunities
The electric LCV market is on an upward trajectory, experiencing robust growth driven by a confluence of technological advancements, evolving consumer preferences, and supportive government policies. The global electric LCV market value is anticipated to surge in the coming years. Technological shifts are pivotal, with advancements in battery energy density leading to extended ranges and reduced charging times, addressing range anxiety which was a significant barrier. The development of more efficient electric powertrains and lighter vehicle architectures further enhances performance and cost-effectiveness. Consumer preferences are increasingly leaning towards sustainable and cost-efficient transportation solutions, with businesses recognizing the long-term operational savings offered by EVs, including lower fuel and maintenance costs. This shift is particularly evident in urban environments where zero-emission zones and congestion charges incentivize the adoption of electric vehicles.
Competitive dynamics are intensifying, as major automotive manufacturers are rapidly expanding their electric LCV portfolio. This includes a wide array of electric vans, electric pick-up trucks, and specialized LCVs catering to diverse commercial needs. Opportunities abound in the development of charging infrastructure, battery management systems, and innovative fleet management solutions tailored for electric vehicles. The growing demand for last-mile delivery services, fueled by the e-commerce boom, presents a significant growth avenue for electric LCVs. Furthermore, the increasing focus on Corporate Social Responsibility (CSR) and Environmental, Social, and Governance (ESG) criteria among businesses is propelling the adoption of electric fleets. The electric LCV market growth rate is expected to accelerate as these trends mature and favorable market conditions persist. The integration of smart technologies, such as telematics and predictive maintenance, will further enhance the appeal and efficiency of electric LCVs for commercial operations, creating new revenue streams and business models within the electric commercial vehicle market. The penetration of electric LCVs is projected to reach significant levels in key markets, indicating a fundamental shift in the commercial transportation landscape.
Dominant Markets & Segments in Electric LCV Market
The electric LCV market is witnessing dynamic shifts across various regions and segments, with specific areas demonstrating remarkable dominance. Europe has emerged as a leading region, driven by stringent emission regulations, substantial government incentives for EV adoption, and a well-developed charging infrastructure. Within Europe, countries like the United Kingdom, Germany, and France are at the forefront of electric LCV deployment. The dominance is further amplified by the strong presence of legacy automakers and the burgeoning number of new EV startups focused on commercial vehicles.
Examining Propulsion Type, the Battery Electric Vehicle (BEV) segment overwhelmingly leads the market. BEVs offer zero tailpipe emissions, lower running costs, and are increasingly supported by advancements in battery technology that address range and charging concerns. While Hybrid Electric Vehicles (HEVs) and Fuel Cell Electric Vehicles (FCEVs) hold niche positions, their market share in the LCV segment is considerably smaller. HEVs offer a transitional solution for some users, while FCEVs are still in the early stages of commercial viability for LCV applications due to infrastructure and cost challenges.
In terms of Vehicle Type, the Van segment is the most dominant. This is directly attributable to the exponential growth of e-commerce and the critical role of vans in last-mile delivery and urban logistics. The inherent practicality and versatility of vans make them ideal platforms for electrification, with a wide range of cargo capacities and configurations available. Pick-up Trucks are also gaining significant traction, particularly in North America, where they are essential for trades, construction, and recreational purposes. As battery technology improves and charging infrastructure expands, electric pick-up trucks are becoming increasingly viable alternatives to their ICE counterparts.
Analyzing Power Output, the 100-250 kW segment currently holds a significant market share. This power range offers a good balance between performance, range, and cost for most LCV applications. Vehicles in this category are well-suited for urban and suburban delivery routes, providing sufficient power for varied terrains and payloads. The Less Than 100 kW segment caters to lighter-duty applications and those prioritizing maximum range or lower initial cost. The More Than 250 kW segment is gradually expanding, driven by demand for higher-performance LCVs, heavy-duty variants, and specialized applications requiring robust power delivery.
Key growth drivers underpinning the dominance of these segments include:
- Infrastructure: Expansion of public and private charging networks, particularly in urban centers and logistics hubs.
- Policies: Government incentives, subsidies, tax credits, and stringent emission standards encouraging EV adoption.
- Total Cost of Ownership (TCO): Decreasing battery costs and lower operational expenses making EVs more economically attractive over their lifecycle.
- Technological Advancements: Improvements in battery density, charging speed, and powertrain efficiency.
- Urbanization & E-commerce: Growing demand for efficient and sustainable last-mile delivery solutions.
Electric LCV Market Product Analysis
The Electric LCV market is characterized by a rapid pace of product innovation, with manufacturers focusing on enhancing range, reducing charging times, and optimizing total cost of ownership. Key product innovations include the development of modular battery platforms, enabling flexible range options, and the integration of advanced battery management systems for improved lifespan and performance. Applications are diversifying beyond traditional delivery vans, with specialized electric LCVs emerging for industries such as waste management, passenger transport (e-taxis), and mobile workshops. Competitive advantages are being built on factors like vehicle efficiency, payload capacity, advanced driver-assistance systems (ADAS), and seamless integration with fleet management software. The focus remains on delivering practical, reliable, and economically viable electric solutions for businesses.
Key Drivers, Barriers & Challenges in Electric LCV Market
Key Drivers, Barriers & Challenges in Electric LCV Market
The electric LCV market is propelled by several key drivers. Technological advancements, particularly in battery technology, are leading to increased range and reduced charging times, directly addressing historical consumer concerns. Government initiatives, including purchase subsidies, tax incentives, and stringent emission regulations, are creating a favorable policy environment for EV adoption. The growing demand for sustainable logistics solutions from businesses aiming to reduce their carbon footprint and enhance their corporate social responsibility is a significant economic driver. Furthermore, the declining total cost of ownership (TCO) due to lower electricity costs compared to fossil fuels and reduced maintenance requirements is making electric LCVs increasingly attractive for fleet operators.
However, the market faces several significant barriers and challenges. The initial purchase price of electric LCVs remains higher than comparable ICE models, posing a financial hurdle for many businesses. The availability and accessibility of charging infrastructure, especially in rural areas and for businesses lacking dedicated charging facilities, continue to be a concern. Supply chain disruptions, particularly for critical battery components like lithium and cobalt, can impact production volumes and cost stability. Regulatory complexities, such as varying charging standards and grid capacity limitations, can also present challenges. Finally, competitive pressures from established ICE vehicle manufacturers and the rapid pace of technological change require continuous innovation and strategic investment.
Growth Drivers in the Electric LCV Market Market
Key growth drivers shaping the Electric LCV Market are multifaceted. Technologically, continuous improvements in battery chemistry and density are enabling longer ranges and faster charging, making electric LCVs more practical for commercial use. Economically, the decreasing total cost of ownership (TCO), driven by lower energy prices and reduced maintenance needs compared to internal combustion engine vehicles, is a powerful incentive for fleet operators. Regulatory tailwinds, including government mandates for zero-emission vehicle adoption, purchase incentives, and tax credits, are creating a conducive market environment. The surging growth of e-commerce and the consequent demand for efficient last-mile delivery solutions are also significantly contributing to the expansion of the electric LCV segment.
Challenges Impacting Electric LCV Market Growth
Challenges impacting Electric LCV Market growth include the higher upfront purchase cost compared to traditional LCVs, which can be a significant barrier for small and medium-sized businesses. The uneven distribution and availability of public charging infrastructure, particularly in rural or less developed regions, remains a constraint. Supply chain vulnerabilities, especially concerning the sourcing of critical battery materials and the semiconductor chip shortage, can lead to production delays and increased costs. Furthermore, evolving and sometimes complex regulatory frameworks across different regions can create compliance hurdles for manufacturers and fleet operators. Competitive pressures are also mounting as more players enter the market, necessitating continuous innovation and cost optimization.
Key Players Shaping the Electric LCV Market Market
- Tata Motors Limited
- Volkswagen AG
- Nissan Motor Co
- Renault Group
- Groupe PSA
- Mahindra and Mahindra Ltd
- BYD Group
- Tesla Inc
- Arrival Ltd
- Rivian Automotive
- BAIC Group
Significant Electric LCV Market Industry Milestones
- 2019: Launch of the Renault Kangoo Z.E. redesign, enhancing its appeal in the electric van segment.
- 2020: Volkswagen unveils its ID. Buzz Cargo concept, signaling its commitment to electric LCVs.
- 2021: Arrival Ltd commences pilot programs with major logistics companies for its electric van.
- 2021: Rivian Automotive begins production of its R1T electric pick-up truck, with commercial variants to follow.
- 2022: BYD Group expands its electric LCV offerings, particularly in the Asian market.
- 2022: Tesla Inc. continues development of its Cybertruck, with potential implications for the commercial sector.
- 2023: Mahindra and Mahindra Ltd. announces accelerated plans for electric LCV development and launch.
- 2023: BAIC Group strengthens its position in the Chinese electric LCV market with new model introductions.
- 2024: Increased government funding announced in multiple regions to bolster EV charging infrastructure and adoption incentives.
- 2024: Groupe PSA (now part of Stellantis) introduces new electric variants across its LCV portfolio.
Future Outlook for Electric LCV Market Market
The future outlook for the Electric LCV market is exceptionally positive, fueled by a robust pipeline of innovations and escalating demand for sustainable transportation. Continued advancements in battery technology will drive down costs and improve performance, making electric LCVs more accessible and practical for a wider range of businesses. The expansion of charging infrastructure, coupled with supportive government policies, will further accelerate adoption rates. Strategic opportunities lie in the development of specialized LCVs for emerging sectors like urban micro-mobility and modular, adaptable vehicle platforms. The market is poised for significant growth, with electric LCVs set to become the dominant force in commercial logistics and urban delivery fleets.
Electric LCV Market Segmentation
-
1. Propulsion Type
- 1.1. BEV
- 1.2. HEV
- 1.3. FCEV
-
2. Vehicle Type
- 2.1. Van
- 2.2. Pick-up Truck
-
3. Power Output
- 3.1. Less Than 100 kW
- 3.2. 100 -250 kW
- 3.3. More Than 250 kW
Electric LCV Market Segmentation By Geography
-
1. North America
- 1.1. United States
- 1.2. Canada
- 1.3. Rest of North America
-
2. Europe
- 2.1. Germany
- 2.2. United Kingdom
- 2.3. France
- 2.4. Rest of Europe
-
3. Asia Pacific
- 3.1. India
- 3.2. China
- 3.3. Japan
- 3.4. South Korea
- 3.5. Rest of Asia Pacific
-
4. Rest of the World
- 4.1. Brazil
- 4.2. Mexico
- 4.3. United Arab Emirates
- 4.4. Other Countries
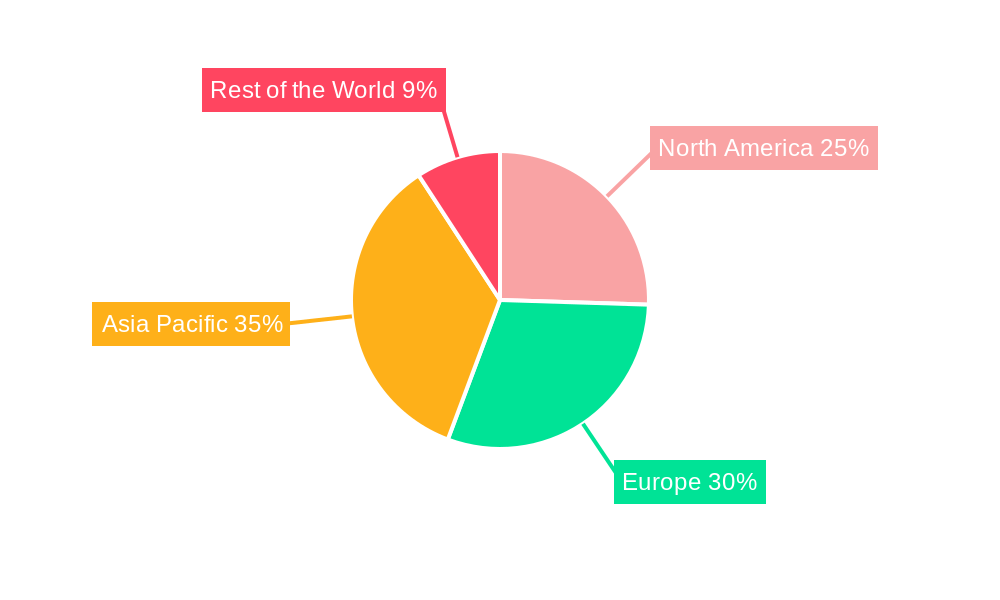
Electric LCV Market Regional Market Share
Geographic Coverage of Electric LCV Market
Electric LCV Market REPORT HIGHLIGHTS
| Aspects | Details |
|---|---|
| Study Period | 2020-2034 |
| Base Year | 2025 |
| Estimated Year | 2026 |
| Forecast Period | 2026-2034 |
| Historical Period | 2020-2025 |
| Growth Rate | CAGR of 36.40% from 2020-2034 |
| Segmentation |
|
Table of Contents
- 1. Introduction
- 1.1. Research Scope
- 1.2. Market Segmentation
- 1.3. Research Objective
- 1.4. Definitions and Assumptions
- 2. Executive Summary
- 2.1. Market Snapshot
- 3. Market Dynamics
- 3.1. Market Drivers
- 3.2. Market Restrains
- 3.3. Market Trends
- 3.4. Market Opportunities
- 4. Market Factor Analysis
- 4.1. Porters Five Forces
- 4.1.1. Bargaining Power of Suppliers
- 4.1.2. Bargaining Power of Buyers
- 4.1.3. Threat of New Entrants
- 4.1.4. Threat of Substitutes
- 4.1.5. Competitive Rivalry
- 4.2. PESTEL analysis
- 4.3. BCG Analysis
- 4.3.1. Stars (High Growth, High Market Share)
- 4.3.2. Cash Cows (Low Growth, High Market Share)
- 4.3.3. Question Mark (High Growth, Low Market Share)
- 4.3.4. Dogs (Low Growth, Low Market Share)
- 4.4. Ansoff Matrix Analysis
- 4.5. Supply Chain Analysis
- 4.6. Regulatory Landscape
- 4.7. Current Market Potential and Opportunity Assessment (TAM–SAM–SOM Framework)
- 4.8. TIR Analyst Note
- 4.1. Porters Five Forces
- 5. Market Analysis, Insights and Forecast 2021-2033
- 5.1. Market Analysis, Insights and Forecast - by Propulsion Type
- 5.1.1. BEV
- 5.1.2. HEV
- 5.1.3. FCEV
- 5.2. Market Analysis, Insights and Forecast - by Vehicle Type
- 5.2.1. Van
- 5.2.2. Pick-up Truck
- 5.3. Market Analysis, Insights and Forecast - by Power Output
- 5.3.1. Less Than 100 kW
- 5.3.2. 100 -250 kW
- 5.3.3. More Than 250 kW
- 5.4. Market Analysis, Insights and Forecast - by Region
- 5.4.1. North America
- 5.4.2. Europe
- 5.4.3. Asia Pacific
- 5.4.4. Rest of the World
- 5.1. Market Analysis, Insights and Forecast - by Propulsion Type
- 6. Global Electric LCV Market Analysis, Insights and Forecast, 2021-2033
- 6.1. Market Analysis, Insights and Forecast - by Propulsion Type
- 6.1.1. BEV
- 6.1.2. HEV
- 6.1.3. FCEV
- 6.2. Market Analysis, Insights and Forecast - by Vehicle Type
- 6.2.1. Van
- 6.2.2. Pick-up Truck
- 6.3. Market Analysis, Insights and Forecast - by Power Output
- 6.3.1. Less Than 100 kW
- 6.3.2. 100 -250 kW
- 6.3.3. More Than 250 kW
- 6.1. Market Analysis, Insights and Forecast - by Propulsion Type
- 7. North America Electric LCV Market Analysis, Insights and Forecast, 2020-2032
- 7.1. Market Analysis, Insights and Forecast - by Propulsion Type
- 7.1.1. BEV
- 7.1.2. HEV
- 7.1.3. FCEV
- 7.2. Market Analysis, Insights and Forecast - by Vehicle Type
- 7.2.1. Van
- 7.2.2. Pick-up Truck
- 7.3. Market Analysis, Insights and Forecast - by Power Output
- 7.3.1. Less Than 100 kW
- 7.3.2. 100 -250 kW
- 7.3.3. More Than 250 kW
- 7.1. Market Analysis, Insights and Forecast - by Propulsion Type
- 8. Europe Electric LCV Market Analysis, Insights and Forecast, 2020-2032
- 8.1. Market Analysis, Insights and Forecast - by Propulsion Type
- 8.1.1. BEV
- 8.1.2. HEV
- 8.1.3. FCEV
- 8.2. Market Analysis, Insights and Forecast - by Vehicle Type
- 8.2.1. Van
- 8.2.2. Pick-up Truck
- 8.3. Market Analysis, Insights and Forecast - by Power Output
- 8.3.1. Less Than 100 kW
- 8.3.2. 100 -250 kW
- 8.3.3. More Than 250 kW
- 8.1. Market Analysis, Insights and Forecast - by Propulsion Type
- 9. Asia Pacific Electric LCV Market Analysis, Insights and Forecast, 2020-2032
- 9.1. Market Analysis, Insights and Forecast - by Propulsion Type
- 9.1.1. BEV
- 9.1.2. HEV
- 9.1.3. FCEV
- 9.2. Market Analysis, Insights and Forecast - by Vehicle Type
- 9.2.1. Van
- 9.2.2. Pick-up Truck
- 9.3. Market Analysis, Insights and Forecast - by Power Output
- 9.3.1. Less Than 100 kW
- 9.3.2. 100 -250 kW
- 9.3.3. More Than 250 kW
- 9.1. Market Analysis, Insights and Forecast - by Propulsion Type
- 10. Rest of the World Electric LCV Market Analysis, Insights and Forecast, 2020-2032
- 10.1. Market Analysis, Insights and Forecast - by Propulsion Type
- 10.1.1. BEV
- 10.1.2. HEV
- 10.1.3. FCEV
- 10.2. Market Analysis, Insights and Forecast - by Vehicle Type
- 10.2.1. Van
- 10.2.2. Pick-up Truck
- 10.3. Market Analysis, Insights and Forecast - by Power Output
- 10.3.1. Less Than 100 kW
- 10.3.2. 100 -250 kW
- 10.3.3. More Than 250 kW
- 10.1. Market Analysis, Insights and Forecast - by Propulsion Type
- 11. Competitive Analysis
- 11.1. Company Profiles
- 11.1.1 Tata Motors Limite
- 11.1.1.1. Company Overview
- 11.1.1.2. Products
- 11.1.1.3. Company Financials
- 11.1.1.4. SWOT Analysis
- 11.1.2 Volkswagen AG
- 11.1.2.1. Company Overview
- 11.1.2.2. Products
- 11.1.2.3. Company Financials
- 11.1.2.4. SWOT Analysis
- 11.1.3 Nissan Motor Co
- 11.1.3.1. Company Overview
- 11.1.3.2. Products
- 11.1.3.3. Company Financials
- 11.1.3.4. SWOT Analysis
- 11.1.4 Renault Group
- 11.1.4.1. Company Overview
- 11.1.4.2. Products
- 11.1.4.3. Company Financials
- 11.1.4.4. SWOT Analysis
- 11.1.5 Groupe PSA
- 11.1.5.1. Company Overview
- 11.1.5.2. Products
- 11.1.5.3. Company Financials
- 11.1.5.4. SWOT Analysis
- 11.1.6 Mahindra and Mahindra Ltd
- 11.1.6.1. Company Overview
- 11.1.6.2. Products
- 11.1.6.3. Company Financials
- 11.1.6.4. SWOT Analysis
- 11.1.7 BYD Group
- 11.1.7.1. Company Overview
- 11.1.7.2. Products
- 11.1.7.3. Company Financials
- 11.1.7.4. SWOT Analysis
- 11.1.8 Tesla Inc
- 11.1.8.1. Company Overview
- 11.1.8.2. Products
- 11.1.8.3. Company Financials
- 11.1.8.4. SWOT Analysis
- 11.1.9 Arrival Ltd
- 11.1.9.1. Company Overview
- 11.1.9.2. Products
- 11.1.9.3. Company Financials
- 11.1.9.4. SWOT Analysis
- 11.1.10 Rivian Automotive
- 11.1.10.1. Company Overview
- 11.1.10.2. Products
- 11.1.10.3. Company Financials
- 11.1.10.4. SWOT Analysis
- 11.1.11 BAIC Group
- 11.1.11.1. Company Overview
- 11.1.11.2. Products
- 11.1.11.3. Company Financials
- 11.1.11.4. SWOT Analysis
- 11.1.1 Tata Motors Limite
- 11.2. Market Entropy
- 11.2.1 Company's Key Areas Served
- 11.2.2 Recent Developments
- 11.3. Company Market Share Analysis 2025
- 11.3.1 Top 5 Companies Market Share Analysis
- 11.3.2 Top 3 Companies Market Share Analysis
- 11.4. List of Potential Customers
- 12. Research Methodology
List of Figures
- Figure 1: Global Electric LCV Market Revenue Breakdown (Million, %) by Region 2025 & 2033
- Figure 2: North America Electric LCV Market Revenue (Million), by Propulsion Type 2025 & 2033
- Figure 3: North America Electric LCV Market Revenue Share (%), by Propulsion Type 2025 & 2033
- Figure 4: North America Electric LCV Market Revenue (Million), by Vehicle Type 2025 & 2033
- Figure 5: North America Electric LCV Market Revenue Share (%), by Vehicle Type 2025 & 2033
- Figure 6: North America Electric LCV Market Revenue (Million), by Power Output 2025 & 2033
- Figure 7: North America Electric LCV Market Revenue Share (%), by Power Output 2025 & 2033
- Figure 8: North America Electric LCV Market Revenue (Million), by Country 2025 & 2033
- Figure 9: North America Electric LCV Market Revenue Share (%), by Country 2025 & 2033
- Figure 10: Europe Electric LCV Market Revenue (Million), by Propulsion Type 2025 & 2033
- Figure 11: Europe Electric LCV Market Revenue Share (%), by Propulsion Type 2025 & 2033
- Figure 12: Europe Electric LCV Market Revenue (Million), by Vehicle Type 2025 & 2033
- Figure 13: Europe Electric LCV Market Revenue Share (%), by Vehicle Type 2025 & 2033
- Figure 14: Europe Electric LCV Market Revenue (Million), by Power Output 2025 & 2033
- Figure 15: Europe Electric LCV Market Revenue Share (%), by Power Output 2025 & 2033
- Figure 16: Europe Electric LCV Market Revenue (Million), by Country 2025 & 2033
- Figure 17: Europe Electric LCV Market Revenue Share (%), by Country 2025 & 2033
- Figure 18: Asia Pacific Electric LCV Market Revenue (Million), by Propulsion Type 2025 & 2033
- Figure 19: Asia Pacific Electric LCV Market Revenue Share (%), by Propulsion Type 2025 & 2033
- Figure 20: Asia Pacific Electric LCV Market Revenue (Million), by Vehicle Type 2025 & 2033
- Figure 21: Asia Pacific Electric LCV Market Revenue Share (%), by Vehicle Type 2025 & 2033
- Figure 22: Asia Pacific Electric LCV Market Revenue (Million), by Power Output 2025 & 2033
- Figure 23: Asia Pacific Electric LCV Market Revenue Share (%), by Power Output 2025 & 2033
- Figure 24: Asia Pacific Electric LCV Market Revenue (Million), by Country 2025 & 2033
- Figure 25: Asia Pacific Electric LCV Market Revenue Share (%), by Country 2025 & 2033
- Figure 26: Rest of the World Electric LCV Market Revenue (Million), by Propulsion Type 2025 & 2033
- Figure 27: Rest of the World Electric LCV Market Revenue Share (%), by Propulsion Type 2025 & 2033
- Figure 28: Rest of the World Electric LCV Market Revenue (Million), by Vehicle Type 2025 & 2033
- Figure 29: Rest of the World Electric LCV Market Revenue Share (%), by Vehicle Type 2025 & 2033
- Figure 30: Rest of the World Electric LCV Market Revenue (Million), by Power Output 2025 & 2033
- Figure 31: Rest of the World Electric LCV Market Revenue Share (%), by Power Output 2025 & 2033
- Figure 32: Rest of the World Electric LCV Market Revenue (Million), by Country 2025 & 2033
- Figure 33: Rest of the World Electric LCV Market Revenue Share (%), by Country 2025 & 2033
List of Tables
- Table 1: Global Electric LCV Market Revenue Million Forecast, by Propulsion Type 2020 & 2033
- Table 2: Global Electric LCV Market Revenue Million Forecast, by Vehicle Type 2020 & 2033
- Table 3: Global Electric LCV Market Revenue Million Forecast, by Power Output 2020 & 2033
- Table 4: Global Electric LCV Market Revenue Million Forecast, by Region 2020 & 2033
- Table 5: Global Electric LCV Market Revenue Million Forecast, by Propulsion Type 2020 & 2033
- Table 6: Global Electric LCV Market Revenue Million Forecast, by Vehicle Type 2020 & 2033
- Table 7: Global Electric LCV Market Revenue Million Forecast, by Power Output 2020 & 2033
- Table 8: Global Electric LCV Market Revenue Million Forecast, by Country 2020 & 2033
- Table 9: United States Electric LCV Market Revenue (Million) Forecast, by Application 2020 & 2033
- Table 10: Canada Electric LCV Market Revenue (Million) Forecast, by Application 2020 & 2033
- Table 11: Rest of North America Electric LCV Market Revenue (Million) Forecast, by Application 2020 & 2033
- Table 12: Global Electric LCV Market Revenue Million Forecast, by Propulsion Type 2020 & 2033
- Table 13: Global Electric LCV Market Revenue Million Forecast, by Vehicle Type 2020 & 2033
- Table 14: Global Electric LCV Market Revenue Million Forecast, by Power Output 2020 & 2033
- Table 15: Global Electric LCV Market Revenue Million Forecast, by Country 2020 & 2033
- Table 16: Germany Electric LCV Market Revenue (Million) Forecast, by Application 2020 & 2033
- Table 17: United Kingdom Electric LCV Market Revenue (Million) Forecast, by Application 2020 & 2033
- Table 18: France Electric LCV Market Revenue (Million) Forecast, by Application 2020 & 2033
- Table 19: Rest of Europe Electric LCV Market Revenue (Million) Forecast, by Application 2020 & 2033
- Table 20: Global Electric LCV Market Revenue Million Forecast, by Propulsion Type 2020 & 2033
- Table 21: Global Electric LCV Market Revenue Million Forecast, by Vehicle Type 2020 & 2033
- Table 22: Global Electric LCV Market Revenue Million Forecast, by Power Output 2020 & 2033
- Table 23: Global Electric LCV Market Revenue Million Forecast, by Country 2020 & 2033
- Table 24: India Electric LCV Market Revenue (Million) Forecast, by Application 2020 & 2033
- Table 25: China Electric LCV Market Revenue (Million) Forecast, by Application 2020 & 2033
- Table 26: Japan Electric LCV Market Revenue (Million) Forecast, by Application 2020 & 2033
- Table 27: South Korea Electric LCV Market Revenue (Million) Forecast, by Application 2020 & 2033
- Table 28: Rest of Asia Pacific Electric LCV Market Revenue (Million) Forecast, by Application 2020 & 2033
- Table 29: Global Electric LCV Market Revenue Million Forecast, by Propulsion Type 2020 & 2033
- Table 30: Global Electric LCV Market Revenue Million Forecast, by Vehicle Type 2020 & 2033
- Table 31: Global Electric LCV Market Revenue Million Forecast, by Power Output 2020 & 2033
- Table 32: Global Electric LCV Market Revenue Million Forecast, by Country 2020 & 2033
- Table 33: Brazil Electric LCV Market Revenue (Million) Forecast, by Application 2020 & 2033
- Table 34: Mexico Electric LCV Market Revenue (Million) Forecast, by Application 2020 & 2033
- Table 35: United Arab Emirates Electric LCV Market Revenue (Million) Forecast, by Application 2020 & 2033
- Table 36: Other Countries Electric LCV Market Revenue (Million) Forecast, by Application 2020 & 2033
Frequently Asked Questions
1. What is the projected Compound Annual Growth Rate (CAGR) of the Electric LCV Market?
The projected CAGR is approximately 36.40%.
2. Which companies are prominent players in the Electric LCV Market?
Key companies in the market include Tata Motors Limite, Volkswagen AG, Nissan Motor Co, Renault Group, Groupe PSA, Mahindra and Mahindra Ltd, BYD Group, Tesla Inc, Arrival Ltd, Rivian Automotive, BAIC Group.
3. What are the main segments of the Electric LCV Market?
The market segments include Propulsion Type, Vehicle Type, Power Output.
4. Can you provide details about the market size?
The market size is estimated to be USD 32.15 Million as of 2022.
5. What are some drivers contributing to market growth?
Growing Travel and Tourism Industry is Driving the Car Rental Market.
6. What are the notable trends driving market growth?
Electric Van is Leading the Electric LCV Market.
7. Are there any restraints impacting market growth?
Increasing Popularity of Ride-Sharing Services Pose Challenges for the Conventional Car Rental Market.
8. Can you provide examples of recent developments in the market?
N/A
9. What pricing options are available for accessing the report?
Pricing options include single-user, multi-user, and enterprise licenses priced at USD 4750, USD 5250, and USD 8750 respectively.
10. Is the market size provided in terms of value or volume?
The market size is provided in terms of value, measured in Million.
11. Are there any specific market keywords associated with the report?
Yes, the market keyword associated with the report is "Electric LCV Market," which aids in identifying and referencing the specific market segment covered.
12. How do I determine which pricing option suits my needs best?
The pricing options vary based on user requirements and access needs. Individual users may opt for single-user licenses, while businesses requiring broader access may choose multi-user or enterprise licenses for cost-effective access to the report.
13. Are there any additional resources or data provided in the Electric LCV Market report?
While the report offers comprehensive insights, it's advisable to review the specific contents or supplementary materials provided to ascertain if additional resources or data are available.
14. How can I stay updated on further developments or reports in the Electric LCV Market?
To stay informed about further developments, trends, and reports in the Electric LCV Market, consider subscribing to industry newsletters, following relevant companies and organizations, or regularly checking reputable industry news sources and publications.
Methodology
Step 1 - Identification of Relevant Samples Size from Population Database


Step 2 - Approaches for Defining Global Market Size (Value, Volume* & Price*)

Note*: In applicable scenarios
Step 3 - Data Sources
Primary Research
- Web Analytics
- Survey Reports
- Research Institute
- Latest Research Reports
- Opinion Leaders
Secondary Research
- Annual Reports
- White Paper
- Latest Press Release
- Industry Association
- Paid Database
- Investor Presentations

Step 4 - Data Triangulation
Involves using different sources of information in order to increase the validity of a study
These sources are likely to be stakeholders in a program - participants, other researchers, program staff, other community members, and so on.
Then we put all data in single framework & apply various statistical tools to find out the dynamic on the market.
During the analysis stage, feedback from the stakeholder groups would be compared to determine areas of agreement as well as areas of divergence