
Key Insights
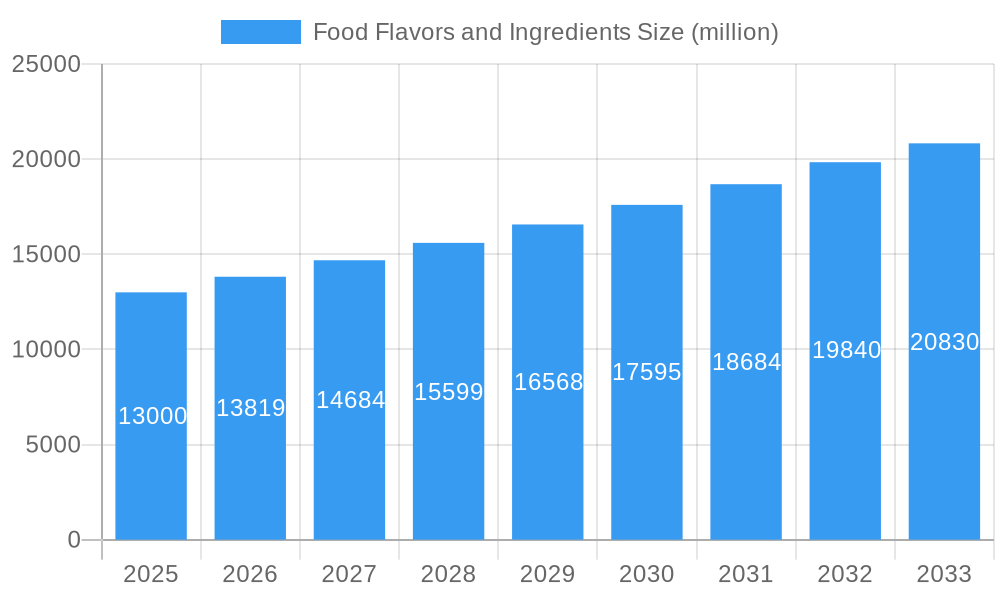
The global food flavors and ingredients market is poised for significant expansion, projected to reach an estimated $20,830 million by 2033. This robust growth is underpinned by a compelling Compound Annual Growth Rate (CAGR) of 6.3%, indicating sustained momentum throughout the forecast period of 2025-2033. Key drivers fueling this market surge include the increasing consumer demand for convenient and processed food options, a growing preference for natural and clean-label ingredients, and continuous innovation in flavor profiles and functional ingredients. The food processing industry, a major segment, is actively investing in advanced ingredients to enhance product appeal, shelf-life, and nutritional value. Furthermore, the burgeoning food service sector, encompassing restaurants and commercial kitchens, is also a significant contributor, seeking to differentiate their offerings with unique and high-quality flavor solutions. The expanding middle class in emerging economies is further amplifying demand, as disposable incomes rise and dietary habits evolve towards more sophisticated and varied food experiences.
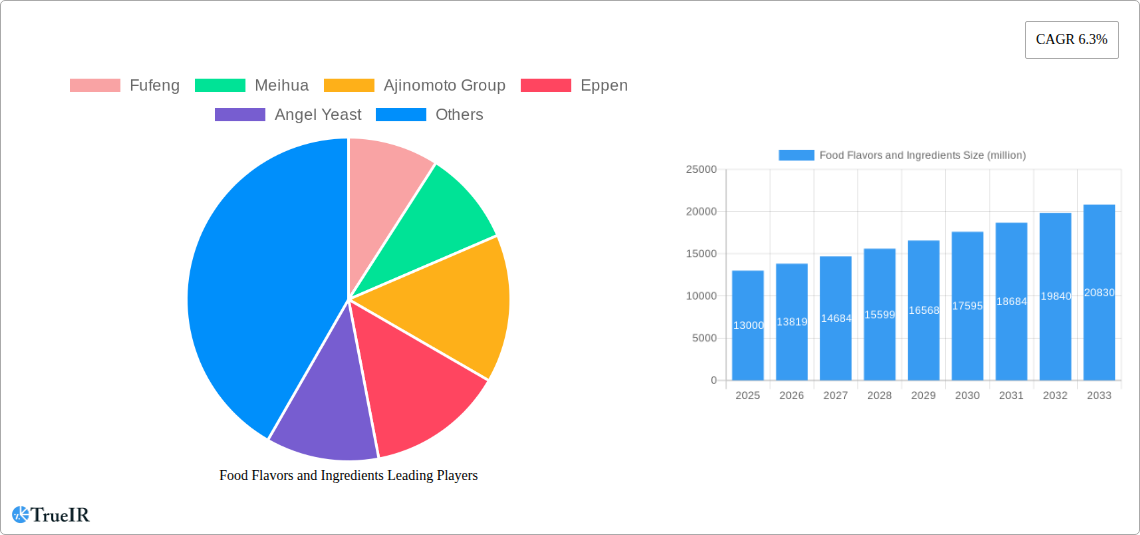
Food Flavors and Ingredients Market Size (In Billion)
The market is segmented across various applications, including the Food Processing Industry, Restaurants, and Home Cooking, reflecting a broad spectrum of consumer and industrial needs. By type, Monosodium Glutamate (MSG), Hydrolyzed Vegetable Protein (HVP), and Yeast Extract represent dominant categories, alongside a growing "Others" segment driven by specialized natural extracts and functional ingredients. Geographically, Asia Pacific is anticipated to lead market growth due to its large population, rapid urbanization, and increasing adoption of Westernized food trends. North America and Europe remain significant markets, driven by established demand for processed foods and a strong focus on clean-label and health-conscious ingredients. Companies such as Fufeng, Meihua, Ajinomoto Group, and Angel Yeast are at the forefront, continuously innovating to meet evolving consumer preferences and regulatory landscapes, while also navigating potential restraints such as fluctuating raw material prices and increasing scrutiny over certain additives.
Food Flavors and Ingredients Company Market Share
Food Flavors and Ingredients Market Research Report: Unlocking Growth and Innovation
This comprehensive Food Flavors and Ingredients Market report delivers an in-depth analysis of market dynamics, trends, and future projections, encompassing the period from 2019 to 2033, with a base and estimated year of 2025. Leveraging high-volume SEO keywords such as "food flavors," "food ingredients," "MSG," "yeast extract," "hydrolyzed vegetable protein," "food processing," and "food additives," this report is meticulously crafted to enhance search rankings and captivate industry professionals. We provide actionable insights into a market projected to exceed millions in value, exploring dominant segments, key players, and emerging opportunities.
Food Flavors and Ingredients Market Structure & Competitive Landscape
The global Food Flavors and Ingredients Market exhibits a moderate to high concentration, with leading companies like Fufeng, Meihua, Ajinomoto Group, Eppen, Angel Yeast, Biospringer, ABF Group, DSM, and AIPU Food Industry holding significant market share. Innovation remains a primary driver, fueled by consumer demand for healthier, more natural, and plant-based ingredients. Regulatory frameworks, particularly concerning food safety and labeling, play a crucial role in shaping market entry and product development. Product substitutes, such as natural flavorings and alternative protein sources, are increasingly impacting traditional ingredients like Monosodium Glutamate (MSG). End-user segmentation reveals a strong reliance on the Food Processing Industry, followed by Restaurants and Home Cooking. Mergers and Acquisitions (M&A) activity has been steady, with an estimated millions in deal volume over the historical period, indicating strategic consolidation and expansion efforts by key players.
Food Flavors and Ingredients Market Trends & Opportunities
The Food Flavors and Ingredients Market is poised for substantial growth, driven by evolving consumer preferences, technological advancements, and expanding applications. The market size is projected to reach millions by 2033, with a Compound Annual Growth Rate (CAGR) of approximately XX% from 2025 to 2033. A significant trend is the increasing demand for clean-label ingredients and natural flavorings, pushing manufacturers to develop innovative solutions that meet these criteria. The rise of plant-based diets has created a surge in demand for ingredients like Yeast Extract and Hydrolyzed Vegetable Protein (HVP) that offer umami taste profiles and functional benefits. Technological shifts in extraction and fermentation processes are enabling the creation of novel flavors and more sustainable ingredient production. Furthermore, the growing importance of functional ingredients, offering health benefits beyond taste, presents a lucrative opportunity. The competitive landscape is characterized by continuous product development, strategic partnerships, and a focus on expanding global reach, particularly in emerging economies. Market penetration rates for specialized ingredients are expected to rise as consumer awareness and acceptance grow. The influence of online retail and direct-to-consumer models is also shaping how food flavors and ingredients reach end-users, creating new distribution channels and marketing opportunities.
Dominant Markets & Segments in Food Flavors and Ingredients
The Food Flavors and Ingredients Market is dominated by the Food Processing Industry as the primary application segment. This sector's insatiable demand for consistent, cost-effective, and functional ingredients for a vast array of processed foods, beverages, and ready-to-eat meals underpins its leading position. Within this, the production of processed meats, baked goods, and snack foods are significant contributors.
Key Growth Drivers in the Dominant Application Segment:
- Scale of Operations: The large-scale production capabilities of food processing companies require bulk sourcing of ingredients, driving demand.
- Product Innovation: Continuous product development in the food processing sector necessitates a diverse range of flavors and functional ingredients.
- Cost-Effectiveness: Ingredients that offer superior taste enhancement and cost efficiency are highly sought after.
- Shelf-Life Extension: Ingredients that contribute to the preservation and stability of processed foods are critical.
The leading region for Food Flavors and Ingredients is Asia Pacific, driven by its massive population, rapidly growing economies, and burgeoning food processing sector, particularly in countries like China and India.
Within the Types of food flavors and ingredients, Monosodium Glutamate (MSG) remains a cornerstone, despite evolving consumer perceptions, due to its unparalleled umami taste enhancement and cost-effectiveness. However, Yeast Extract and Hydrolyzed Vegetable Protein (HVP) are experiencing accelerated growth.
Key Growth Drivers for Yeast Extract and HVP:
- Clean Label Trends: As consumers increasingly seek natural and recognizable ingredients, Yeast Extract and HVP, derived from natural sources, are gaining favor over synthetic alternatives.
- Plant-Based Movement: These ingredients are crucial for mimicking meaty and savory flavors in a wide range of plant-based food products, from meat alternatives to dairy-free options.
- Umami Enhancement: Their ability to deliver a rich, savory, and umami taste profile is essential for improving the palatability of various food items, including soups, sauces, snacks, and seasonings.
- Functional Properties: Beyond taste, Yeast Extract offers nutritional benefits and contributes to mouthfeel and flavor complexity, while HVP provides texturizing and emulsifying properties.
Restaurants and Home Cooking represent significant and growing secondary markets, with consumers increasingly seeking convenient and flavorful solutions for their culinary creations. The demand for pre-made sauces, spice blends, and flavor enhancers for home use is on the rise, fueled by busy lifestyles and a desire for restaurant-quality taste at home.
Food Flavors and Ingredients Product Analysis
Product innovation in the Food Flavors and Ingredients Market is heavily focused on developing natural, clean-label, and functional solutions. Companies are investing in advanced extraction techniques for botanical flavors, fermentation technologies for novel yeast extracts, and sustainable sourcing of protein hydrolysates. Competitive advantages are being built through proprietary flavor profiles, enhanced bioavailability of nutritional components, and cost-effective production methods. The market fit is increasingly defined by catering to the growing demand for plant-based, low-sodium, and allergen-free ingredients, ensuring product relevance in an evolving food landscape.
Key Drivers, Barriers & Challenges in Food Flavors and Ingredients
Key Drivers:
- Growing Demand for Processed and Convenience Foods: This fuels the need for consistent and cost-effective flavorings and functional ingredients.
- Rising Consumer Interest in Natural and Clean-Label Products: Driving innovation in yeast extracts, HVP, and natural flavorings.
- Expansion of the Plant-Based Food Market: Creating significant demand for umami-rich ingredients.
- Technological Advancements in Extraction and Fermentation: Enabling the development of novel and sustainable ingredients.
Barriers & Challenges:
- Regulatory Scrutiny and Changing Labeling Laws: Requiring continuous adaptation and investment in compliance.
- Supply Chain Volatility and Raw Material Price Fluctuations: Impacting production costs and ingredient availability, with estimated cost impacts reaching millions annually.
- Consumer Perception and Health Concerns: Particularly surrounding ingredients like MSG, necessitating clear communication and the development of alternatives.
- Intense Competition and Price Pressure: Driving the need for efficiency and product differentiation.
Growth Drivers in the Food Flavors and Ingredients Market
The Food Flavors and Ingredients Market is propelled by several key drivers. Technologically, advancements in fermentation processes and biotechnology are enabling the creation of more sustainable and nuanced flavors, such as specialized yeast extracts and novel protein hydrolysates. Economically, the growing global middle class and increasing disposable incomes in emerging markets translate to higher spending on processed foods and a greater demand for convenient and flavorful options. Policy-wise, supportive government initiatives for food safety standards and agricultural innovation can foster market growth. For instance, investments in R&D for natural flavor extraction are being indirectly supported by regulations promoting food quality.
Challenges Impacting Food Flavors and Ingredients Growth
Challenges impacting the growth of the Food Flavors and Ingredients Market are multifaceted. Regulatory complexities, including evolving food additive approvals and stringent labeling requirements across different regions, can create significant compliance burdens and delays. Supply chain issues, exacerbated by geopolitical events and climate change, lead to volatility in raw material availability and price fluctuations, with disruptions potentially impacting production capacity by millions of units. Competitive pressures from both established players and emerging startups, coupled with price sensitivity among large food manufacturers, can squeeze profit margins. Furthermore, negative consumer perceptions surrounding certain ingredients, such as MSG, necessitate extensive marketing and product reformulation efforts.
Key Players Shaping the Food Flavors and Ingredients Market
- Fufeng
- Meihua
- Ajinomoto Group
- Eppen
- Angel Yeast
- Biospringer
- ABF Group
- DSM
- AIPU Food Industry
- Innova
Significant Food Flavors and Ingredients Industry Milestones
- 2019 October: Launch of a new range of natural yeast extracts by Angel Yeast, catering to the clean-label trend.
- 2020 March: Ajinomoto Group announces strategic investment in plant-based protein technology, aiming to expand its ingredient portfolio.
- 2021 July: Fufeng Group reports significant capacity expansion for MSG production to meet growing global demand.
- 2022 November: Biospringer introduces innovative fermentation-derived flavor enhancers for savory applications.
- 2023 April: ABF Group acquires a specialty flavor company to strengthen its position in the premium ingredients segment.
- 2024 January: DSM launches a new portfolio of sustainable ingredients derived from upcycled food by-products.
Future Outlook for Food Flavors and Ingredients Market
The future outlook for the Food Flavors and Ingredients Market is exceptionally promising, driven by continued innovation and evolving consumer demand. Strategic opportunities lie in the expansion of plant-based and clean-label ingredients, where companies like Meihua and Eppen are well-positioned. The market potential for functional ingredients, offering health and wellness benefits, is set to soar, creating avenues for players like DSM and Biospringer. Furthermore, the increasing demand for natural and sustainable flavor solutions presents significant growth catalysts, with companies focusing on advanced biotechnology and green chemistry. The ongoing consolidation through M&A activities, evidenced by the historical deal volumes in the millions, will likely continue, shaping a dynamic and competitive landscape.
Food Flavors and Ingredients Segmentation
-
1. Application
- 1.1. Food Processing Industry
- 1.2. Restaurants
- 1.3. Home Cooking
-
2. Types
- 2.1. Monosodium Glutamate (MSG)
- 2.2. Hydrolyzed Vegetable Protein (HVP)
- 2.3. Yeast Extract
- 2.4. Others
Food Flavors and Ingredients Segmentation By Geography
-
1. North America
- 1.1. United States
- 1.2. Canada
- 1.3. Mexico
-
2. South America
- 2.1. Brazil
- 2.2. Argentina
- 2.3. Rest of South America
-
3. Europe
- 3.1. United Kingdom
- 3.2. Germany
- 3.3. France
- 3.4. Italy
- 3.5. Spain
- 3.6. Russia
- 3.7. Benelux
- 3.8. Nordics
- 3.9. Rest of Europe
-
4. Middle East & Africa
- 4.1. Turkey
- 4.2. Israel
- 4.3. GCC
- 4.4. North Africa
- 4.5. South Africa
- 4.6. Rest of Middle East & Africa
-
5. Asia Pacific
- 5.1. China
- 5.2. India
- 5.3. Japan
- 5.4. South Korea
- 5.5. ASEAN
- 5.6. Oceania
- 5.7. Rest of Asia Pacific
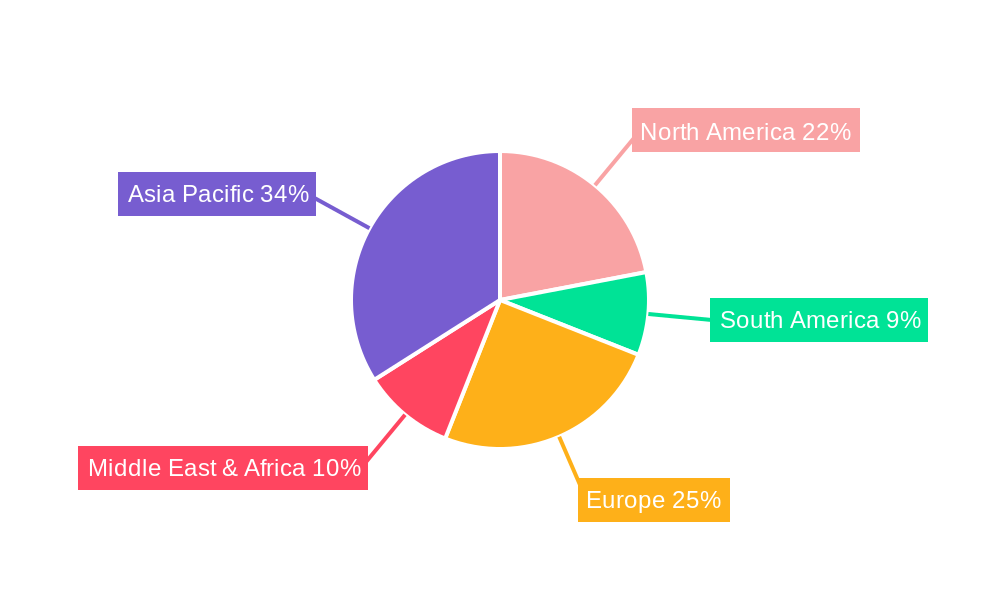
Food Flavors and Ingredients Regional Market Share
Geographic Coverage of Food Flavors and Ingredients
Food Flavors and Ingredients REPORT HIGHLIGHTS
| Aspects | Details |
|---|---|
| Study Period | 2020-2034 |
| Base Year | 2025 |
| Estimated Year | 2026 |
| Forecast Period | 2026-2034 |
| Historical Period | 2020-2025 |
| Growth Rate | CAGR of 6.3% from 2020-2034 |
| Segmentation |
|
Table of Contents
- 1. Introduction
- 1.1. Research Scope
- 1.2. Market Segmentation
- 1.3. Research Methodology
- 1.4. Definitions and Assumptions
- 2. Executive Summary
- 2.1. Introduction
- 3. Market Dynamics
- 3.1. Introduction
- 3.2. Market Drivers
- 3.3. Market Restrains
- 3.4. Market Trends
- 4. Market Factor Analysis
- 4.1. Porters Five Forces
- 4.2. Supply/Value Chain
- 4.3. PESTEL analysis
- 4.4. Market Entropy
- 4.5. Patent/Trademark Analysis
- 5. Global Food Flavors and Ingredients Analysis, Insights and Forecast, 2020-2032
- 5.1. Market Analysis, Insights and Forecast - by Application
- 5.1.1. Food Processing Industry
- 5.1.2. Restaurants
- 5.1.3. Home Cooking
- 5.2. Market Analysis, Insights and Forecast - by Types
- 5.2.1. Monosodium Glutamate (MSG)
- 5.2.2. Hydrolyzed Vegetable Protein (HVP)
- 5.2.3. Yeast Extract
- 5.2.4. Others
- 5.3. Market Analysis, Insights and Forecast - by Region
- 5.3.1. North America
- 5.3.2. South America
- 5.3.3. Europe
- 5.3.4. Middle East & Africa
- 5.3.5. Asia Pacific
- 5.1. Market Analysis, Insights and Forecast - by Application
- 6. North America Food Flavors and Ingredients Analysis, Insights and Forecast, 2020-2032
- 6.1. Market Analysis, Insights and Forecast - by Application
- 6.1.1. Food Processing Industry
- 6.1.2. Restaurants
- 6.1.3. Home Cooking
- 6.2. Market Analysis, Insights and Forecast - by Types
- 6.2.1. Monosodium Glutamate (MSG)
- 6.2.2. Hydrolyzed Vegetable Protein (HVP)
- 6.2.3. Yeast Extract
- 6.2.4. Others
- 6.1. Market Analysis, Insights and Forecast - by Application
- 7. South America Food Flavors and Ingredients Analysis, Insights and Forecast, 2020-2032
- 7.1. Market Analysis, Insights and Forecast - by Application
- 7.1.1. Food Processing Industry
- 7.1.2. Restaurants
- 7.1.3. Home Cooking
- 7.2. Market Analysis, Insights and Forecast - by Types
- 7.2.1. Monosodium Glutamate (MSG)
- 7.2.2. Hydrolyzed Vegetable Protein (HVP)
- 7.2.3. Yeast Extract
- 7.2.4. Others
- 7.1. Market Analysis, Insights and Forecast - by Application
- 8. Europe Food Flavors and Ingredients Analysis, Insights and Forecast, 2020-2032
- 8.1. Market Analysis, Insights and Forecast - by Application
- 8.1.1. Food Processing Industry
- 8.1.2. Restaurants
- 8.1.3. Home Cooking
- 8.2. Market Analysis, Insights and Forecast - by Types
- 8.2.1. Monosodium Glutamate (MSG)
- 8.2.2. Hydrolyzed Vegetable Protein (HVP)
- 8.2.3. Yeast Extract
- 8.2.4. Others
- 8.1. Market Analysis, Insights and Forecast - by Application
- 9. Middle East & Africa Food Flavors and Ingredients Analysis, Insights and Forecast, 2020-2032
- 9.1. Market Analysis, Insights and Forecast - by Application
- 9.1.1. Food Processing Industry
- 9.1.2. Restaurants
- 9.1.3. Home Cooking
- 9.2. Market Analysis, Insights and Forecast - by Types
- 9.2.1. Monosodium Glutamate (MSG)
- 9.2.2. Hydrolyzed Vegetable Protein (HVP)
- 9.2.3. Yeast Extract
- 9.2.4. Others
- 9.1. Market Analysis, Insights and Forecast - by Application
- 10. Asia Pacific Food Flavors and Ingredients Analysis, Insights and Forecast, 2020-2032
- 10.1. Market Analysis, Insights and Forecast - by Application
- 10.1.1. Food Processing Industry
- 10.1.2. Restaurants
- 10.1.3. Home Cooking
- 10.2. Market Analysis, Insights and Forecast - by Types
- 10.2.1. Monosodium Glutamate (MSG)
- 10.2.2. Hydrolyzed Vegetable Protein (HVP)
- 10.2.3. Yeast Extract
- 10.2.4. Others
- 10.1. Market Analysis, Insights and Forecast - by Application
- 11. Competitive Analysis
- 11.1. Global Market Share Analysis 2025
- 11.2. Company Profiles
- 11.2.1 Fufeng
- 11.2.1.1. Overview
- 11.2.1.2. Products
- 11.2.1.3. SWOT Analysis
- 11.2.1.4. Recent Developments
- 11.2.1.5. Financials (Based on Availability)
- 11.2.2 Meihua
- 11.2.2.1. Overview
- 11.2.2.2. Products
- 11.2.2.3. SWOT Analysis
- 11.2.2.4. Recent Developments
- 11.2.2.5. Financials (Based on Availability)
- 11.2.3 Ajinomoto Group
- 11.2.3.1. Overview
- 11.2.3.2. Products
- 11.2.3.3. SWOT Analysis
- 11.2.3.4. Recent Developments
- 11.2.3.5. Financials (Based on Availability)
- 11.2.4 Eppen
- 11.2.4.1. Overview
- 11.2.4.2. Products
- 11.2.4.3. SWOT Analysis
- 11.2.4.4. Recent Developments
- 11.2.4.5. Financials (Based on Availability)
- 11.2.5 Angel Yeast
- 11.2.5.1. Overview
- 11.2.5.2. Products
- 11.2.5.3. SWOT Analysis
- 11.2.5.4. Recent Developments
- 11.2.5.5. Financials (Based on Availability)
- 11.2.6 Biospringer
- 11.2.6.1. Overview
- 11.2.6.2. Products
- 11.2.6.3. SWOT Analysis
- 11.2.6.4. Recent Developments
- 11.2.6.5. Financials (Based on Availability)
- 11.2.7 ABF Group
- 11.2.7.1. Overview
- 11.2.7.2. Products
- 11.2.7.3. SWOT Analysis
- 11.2.7.4. Recent Developments
- 11.2.7.5. Financials (Based on Availability)
- 11.2.8 DSM
- 11.2.8.1. Overview
- 11.2.8.2. Products
- 11.2.8.3. SWOT Analysis
- 11.2.8.4. Recent Developments
- 11.2.8.5. Financials (Based on Availability)
- 11.2.9 AIPU Food Industry
- 11.2.9.1. Overview
- 11.2.9.2. Products
- 11.2.9.3. SWOT Analysis
- 11.2.9.4. Recent Developments
- 11.2.9.5. Financials (Based on Availability)
- 11.2.10 Innova
- 11.2.10.1. Overview
- 11.2.10.2. Products
- 11.2.10.3. SWOT Analysis
- 11.2.10.4. Recent Developments
- 11.2.10.5. Financials (Based on Availability)
- 11.2.1 Fufeng
List of Figures
- Figure 1: Global Food Flavors and Ingredients Revenue Breakdown (million, %) by Region 2025 & 2033
- Figure 2: North America Food Flavors and Ingredients Revenue (million), by Application 2025 & 2033
- Figure 3: North America Food Flavors and Ingredients Revenue Share (%), by Application 2025 & 2033
- Figure 4: North America Food Flavors and Ingredients Revenue (million), by Types 2025 & 2033
- Figure 5: North America Food Flavors and Ingredients Revenue Share (%), by Types 2025 & 2033
- Figure 6: North America Food Flavors and Ingredients Revenue (million), by Country 2025 & 2033
- Figure 7: North America Food Flavors and Ingredients Revenue Share (%), by Country 2025 & 2033
- Figure 8: South America Food Flavors and Ingredients Revenue (million), by Application 2025 & 2033
- Figure 9: South America Food Flavors and Ingredients Revenue Share (%), by Application 2025 & 2033
- Figure 10: South America Food Flavors and Ingredients Revenue (million), by Types 2025 & 2033
- Figure 11: South America Food Flavors and Ingredients Revenue Share (%), by Types 2025 & 2033
- Figure 12: South America Food Flavors and Ingredients Revenue (million), by Country 2025 & 2033
- Figure 13: South America Food Flavors and Ingredients Revenue Share (%), by Country 2025 & 2033
- Figure 14: Europe Food Flavors and Ingredients Revenue (million), by Application 2025 & 2033
- Figure 15: Europe Food Flavors and Ingredients Revenue Share (%), by Application 2025 & 2033
- Figure 16: Europe Food Flavors and Ingredients Revenue (million), by Types 2025 & 2033
- Figure 17: Europe Food Flavors and Ingredients Revenue Share (%), by Types 2025 & 2033
- Figure 18: Europe Food Flavors and Ingredients Revenue (million), by Country 2025 & 2033
- Figure 19: Europe Food Flavors and Ingredients Revenue Share (%), by Country 2025 & 2033
- Figure 20: Middle East & Africa Food Flavors and Ingredients Revenue (million), by Application 2025 & 2033
- Figure 21: Middle East & Africa Food Flavors and Ingredients Revenue Share (%), by Application 2025 & 2033
- Figure 22: Middle East & Africa Food Flavors and Ingredients Revenue (million), by Types 2025 & 2033
- Figure 23: Middle East & Africa Food Flavors and Ingredients Revenue Share (%), by Types 2025 & 2033
- Figure 24: Middle East & Africa Food Flavors and Ingredients Revenue (million), by Country 2025 & 2033
- Figure 25: Middle East & Africa Food Flavors and Ingredients Revenue Share (%), by Country 2025 & 2033
- Figure 26: Asia Pacific Food Flavors and Ingredients Revenue (million), by Application 2025 & 2033
- Figure 27: Asia Pacific Food Flavors and Ingredients Revenue Share (%), by Application 2025 & 2033
- Figure 28: Asia Pacific Food Flavors and Ingredients Revenue (million), by Types 2025 & 2033
- Figure 29: Asia Pacific Food Flavors and Ingredients Revenue Share (%), by Types 2025 & 2033
- Figure 30: Asia Pacific Food Flavors and Ingredients Revenue (million), by Country 2025 & 2033
- Figure 31: Asia Pacific Food Flavors and Ingredients Revenue Share (%), by Country 2025 & 2033
List of Tables
- Table 1: Global Food Flavors and Ingredients Revenue million Forecast, by Region 2020 & 2033
- Table 2: Global Food Flavors and Ingredients Revenue million Forecast, by Application 2020 & 2033
- Table 3: Global Food Flavors and Ingredients Revenue million Forecast, by Types 2020 & 2033
- Table 4: Global Food Flavors and Ingredients Revenue million Forecast, by Region 2020 & 2033
- Table 5: Global Food Flavors and Ingredients Revenue million Forecast, by Application 2020 & 2033
- Table 6: Global Food Flavors and Ingredients Revenue million Forecast, by Types 2020 & 2033
- Table 7: Global Food Flavors and Ingredients Revenue million Forecast, by Country 2020 & 2033
- Table 8: United States Food Flavors and Ingredients Revenue (million) Forecast, by Application 2020 & 2033
- Table 9: Canada Food Flavors and Ingredients Revenue (million) Forecast, by Application 2020 & 2033
- Table 10: Mexico Food Flavors and Ingredients Revenue (million) Forecast, by Application 2020 & 2033
- Table 11: Global Food Flavors and Ingredients Revenue million Forecast, by Application 2020 & 2033
- Table 12: Global Food Flavors and Ingredients Revenue million Forecast, by Types 2020 & 2033
- Table 13: Global Food Flavors and Ingredients Revenue million Forecast, by Country 2020 & 2033
- Table 14: Brazil Food Flavors and Ingredients Revenue (million) Forecast, by Application 2020 & 2033
- Table 15: Argentina Food Flavors and Ingredients Revenue (million) Forecast, by Application 2020 & 2033
- Table 16: Rest of South America Food Flavors and Ingredients Revenue (million) Forecast, by Application 2020 & 2033
- Table 17: Global Food Flavors and Ingredients Revenue million Forecast, by Application 2020 & 2033
- Table 18: Global Food Flavors and Ingredients Revenue million Forecast, by Types 2020 & 2033
- Table 19: Global Food Flavors and Ingredients Revenue million Forecast, by Country 2020 & 2033
- Table 20: United Kingdom Food Flavors and Ingredients Revenue (million) Forecast, by Application 2020 & 2033
- Table 21: Germany Food Flavors and Ingredients Revenue (million) Forecast, by Application 2020 & 2033
- Table 22: France Food Flavors and Ingredients Revenue (million) Forecast, by Application 2020 & 2033
- Table 23: Italy Food Flavors and Ingredients Revenue (million) Forecast, by Application 2020 & 2033
- Table 24: Spain Food Flavors and Ingredients Revenue (million) Forecast, by Application 2020 & 2033
- Table 25: Russia Food Flavors and Ingredients Revenue (million) Forecast, by Application 2020 & 2033
- Table 26: Benelux Food Flavors and Ingredients Revenue (million) Forecast, by Application 2020 & 2033
- Table 27: Nordics Food Flavors and Ingredients Revenue (million) Forecast, by Application 2020 & 2033
- Table 28: Rest of Europe Food Flavors and Ingredients Revenue (million) Forecast, by Application 2020 & 2033
- Table 29: Global Food Flavors and Ingredients Revenue million Forecast, by Application 2020 & 2033
- Table 30: Global Food Flavors and Ingredients Revenue million Forecast, by Types 2020 & 2033
- Table 31: Global Food Flavors and Ingredients Revenue million Forecast, by Country 2020 & 2033
- Table 32: Turkey Food Flavors and Ingredients Revenue (million) Forecast, by Application 2020 & 2033
- Table 33: Israel Food Flavors and Ingredients Revenue (million) Forecast, by Application 2020 & 2033
- Table 34: GCC Food Flavors and Ingredients Revenue (million) Forecast, by Application 2020 & 2033
- Table 35: North Africa Food Flavors and Ingredients Revenue (million) Forecast, by Application 2020 & 2033
- Table 36: South Africa Food Flavors and Ingredients Revenue (million) Forecast, by Application 2020 & 2033
- Table 37: Rest of Middle East & Africa Food Flavors and Ingredients Revenue (million) Forecast, by Application 2020 & 2033
- Table 38: Global Food Flavors and Ingredients Revenue million Forecast, by Application 2020 & 2033
- Table 39: Global Food Flavors and Ingredients Revenue million Forecast, by Types 2020 & 2033
- Table 40: Global Food Flavors and Ingredients Revenue million Forecast, by Country 2020 & 2033
- Table 41: China Food Flavors and Ingredients Revenue (million) Forecast, by Application 2020 & 2033
- Table 42: India Food Flavors and Ingredients Revenue (million) Forecast, by Application 2020 & 2033
- Table 43: Japan Food Flavors and Ingredients Revenue (million) Forecast, by Application 2020 & 2033
- Table 44: South Korea Food Flavors and Ingredients Revenue (million) Forecast, by Application 2020 & 2033
- Table 45: ASEAN Food Flavors and Ingredients Revenue (million) Forecast, by Application 2020 & 2033
- Table 46: Oceania Food Flavors and Ingredients Revenue (million) Forecast, by Application 2020 & 2033
- Table 47: Rest of Asia Pacific Food Flavors and Ingredients Revenue (million) Forecast, by Application 2020 & 2033
Frequently Asked Questions
1. What is the projected Compound Annual Growth Rate (CAGR) of the Food Flavors and Ingredients?
The projected CAGR is approximately 6.3%.
2. Which companies are prominent players in the Food Flavors and Ingredients?
Key companies in the market include Fufeng, Meihua, Ajinomoto Group, Eppen, Angel Yeast, Biospringer, ABF Group, DSM, AIPU Food Industry, Innova.
3. What are the main segments of the Food Flavors and Ingredients?
The market segments include Application, Types.
4. Can you provide details about the market size?
The market size is estimated to be USD 20830 million as of 2022.
5. What are some drivers contributing to market growth?
N/A
6. What are the notable trends driving market growth?
N/A
7. Are there any restraints impacting market growth?
N/A
8. Can you provide examples of recent developments in the market?
N/A
9. What pricing options are available for accessing the report?
Pricing options include single-user, multi-user, and enterprise licenses priced at USD 2900.00, USD 4350.00, and USD 5800.00 respectively.
10. Is the market size provided in terms of value or volume?
The market size is provided in terms of value, measured in million.
11. Are there any specific market keywords associated with the report?
Yes, the market keyword associated with the report is "Food Flavors and Ingredients," which aids in identifying and referencing the specific market segment covered.
12. How do I determine which pricing option suits my needs best?
The pricing options vary based on user requirements and access needs. Individual users may opt for single-user licenses, while businesses requiring broader access may choose multi-user or enterprise licenses for cost-effective access to the report.
13. Are there any additional resources or data provided in the Food Flavors and Ingredients report?
While the report offers comprehensive insights, it's advisable to review the specific contents or supplementary materials provided to ascertain if additional resources or data are available.
14. How can I stay updated on further developments or reports in the Food Flavors and Ingredients?
To stay informed about further developments, trends, and reports in the Food Flavors and Ingredients, consider subscribing to industry newsletters, following relevant companies and organizations, or regularly checking reputable industry news sources and publications.
Methodology
Step 1 - Identification of Relevant Samples Size from Population Database


Step 2 - Approaches for Defining Global Market Size (Value, Volume* & Price*)

Note*: In applicable scenarios
Step 3 - Data Sources
Primary Research
- Web Analytics
- Survey Reports
- Research Institute
- Latest Research Reports
- Opinion Leaders
Secondary Research
- Annual Reports
- White Paper
- Latest Press Release
- Industry Association
- Paid Database
- Investor Presentations

Step 4 - Data Triangulation
Involves using different sources of information in order to increase the validity of a study
These sources are likely to be stakeholders in a program - participants, other researchers, program staff, other community members, and so on.
Then we put all data in single framework & apply various statistical tools to find out the dynamic on the market.
During the analysis stage, feedback from the stakeholder groups would be compared to determine areas of agreement as well as areas of divergence
