

Key Insights
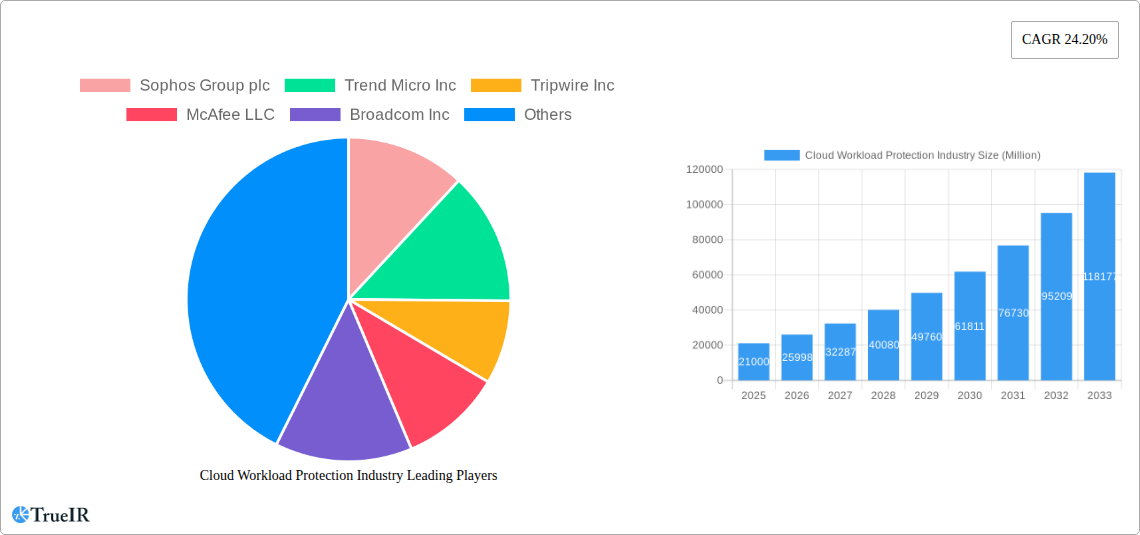
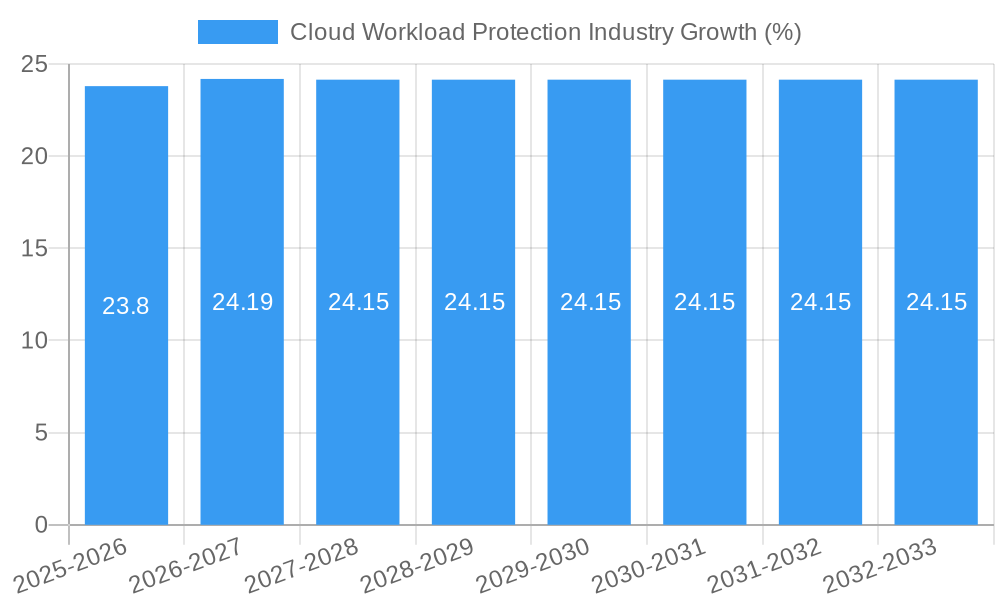
The global Cloud Workload Protection (CWP) market is experiencing explosive growth, projected to reach a substantial market size of approximately \$21,000 million by 2025, with an impressive Compound Annual Growth Rate (CAGR) of 24.20% through 2033. This robust expansion is primarily fueled by the escalating adoption of cloud computing across industries, driven by the need for enhanced scalability, flexibility, and cost-efficiency. As businesses increasingly migrate their critical workloads to public, private, and hybrid cloud environments, the imperative for sophisticated security solutions to protect these dynamic and distributed assets becomes paramount. Key market drivers include the burgeoning threat landscape, characterized by increasingly complex cyberattacks and the rise of ransomware, alongside stringent regulatory compliance mandates that necessitate robust data protection and privacy measures. The continuous evolution of cloud architectures and the proliferation of containerized applications and serverless computing further underscore the demand for specialized CWP solutions.
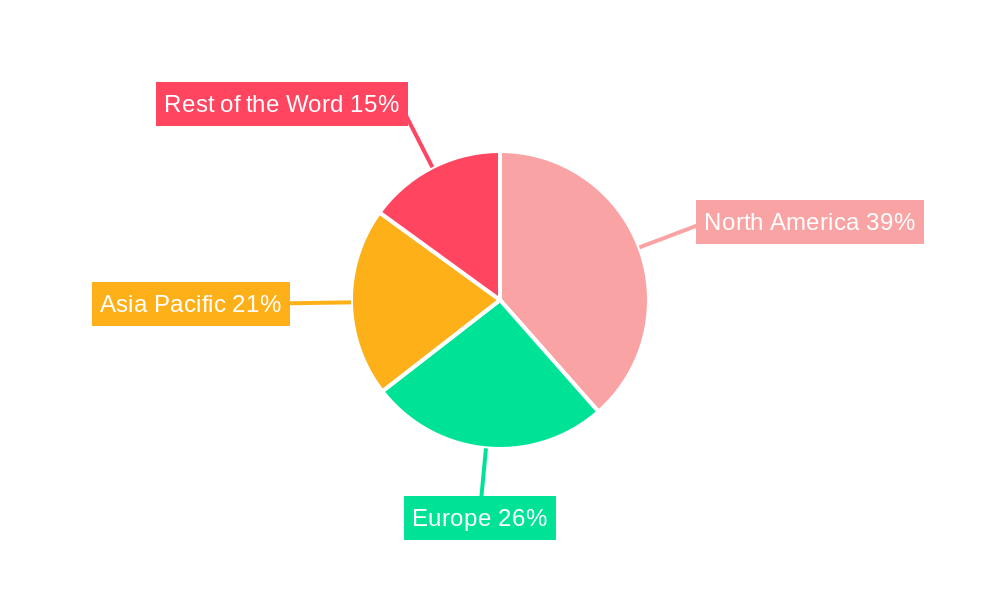
The CWP market is segmented across a comprehensive range of solutions and services designed to address diverse security needs. Within solutions, Monitoring and Logging, Policy and Compliance Management, Vulnerability Assessment, and Threat Detection and Incident Response are pivotal components, each contributing to a layered security posture. Managed Services and Professional Services are gaining traction as organizations seek expert assistance in implementing and managing their cloud security frameworks. The widespread adoption of cloud-based solutions is evident across key end-user industries, including BFSI, Healthcare and Life Sciences, IT and Telecommunications, and Retail, all grappling with the unique security challenges of cloud environments. North America currently leads the market, driven by early cloud adoption and a mature cybersecurity ecosystem, with Asia Pacific poised for significant growth due to rapid digital transformation initiatives. Major players such as Sophos Group plc, Trend Micro Inc., and McAfee LLC are actively innovating and expanding their offerings to capture market share in this rapidly evolving landscape.
Cloud Workload Protection Industry Market Structure & Competitive Landscape
The cloud workload protection market is characterized by a highly fragmented yet consolidating structure, driven by rapid innovation and increasing regulatory scrutiny. Leading players like Broadcom Inc., Trend Micro Inc., and McAfee LLC compete with specialized firms such as Sophos Group plc, Tripwire Inc., HyTrust, Guardicore, Dome9 Security Inc., LogRhythm Inc., and CloudPassage, alongside emerging innovators. This dynamic landscape fosters intense competition, pushing companies to continuously enhance their offerings in cloud security posture management (CSPM), cloud workload protection platforms (CWPP), and cloud security solutions. The concentration ratio, while difficult to pinpoint precisely due to the dynamic nature, is estimated to be in the xx range, indicating significant influence from the top few players but ample room for niche specialists. Innovation drivers are primarily the escalating sophistication of cyber threats targeting cloud environments and the growing adoption of multi-cloud and hybrid cloud strategies, demanding comprehensive and integrated security solutions. Regulatory impacts, particularly concerning data privacy and compliance (e.g., GDPR, CCPA), are significant, forcing organizations to invest heavily in cloud compliance management and cloud security governance. Product substitutes exist in the form of traditional on-premises security solutions, but their efficacy in dynamic cloud environments is often limited. End-user segmentation reveals BFSI and IT and Telecommunications as key adopters, demanding robust cloud threat detection and incident response. Mergers and acquisitions (M&A) are a prevalent trend, with approximately xx M&A deals recorded in the historical period (2019-2024), aimed at expanding market share, acquiring new technologies, and consolidating offerings.
Cloud Workload Protection Industry Market Trends & Opportunities
The global cloud workload protection market is experiencing a meteoric rise, projected to reach a valuation of over US$XX Million by 2033, exhibiting a robust Compound Annual Growth Rate (CAGR) of approximately xx% from the base year of 2025. This substantial growth is fueled by the accelerating migration of businesses to cloud infrastructure, encompassing public, private, and hybrid deployments, to leverage scalability, cost-efficiency, and agility. The increasing complexity of cloud environments, coupled with the proliferation of sophisticated cyber threats, necessitates advanced security solutions for effective cloud workload protection. Key technological shifts include the rise of DevSecOps, where security is integrated into the entire software development lifecycle, and the adoption of AI and machine learning for cloud threat intelligence and automated incident response. Consumer preferences are increasingly leaning towards integrated security platforms that offer comprehensive visibility and control across diverse cloud services, moving beyond single-point solutions. Competitive dynamics are characterized by intense innovation, with companies focusing on enhanced capabilities in cloud vulnerability assessment, cloud compliance monitoring, and zero-trust security models within cloud architectures. The market penetration rate for advanced cloud workload protection solutions is expected to surge from xx% in 2025 to over xx% by 2033, reflecting the growing awareness and critical need for robust cloud security. The expansion of cloud services by major providers like AWS, Azure, and Google Cloud further amplifies the addressable market for specialized cloud workload protection solutions. The demand for real-time cloud security analytics and cloud security automation is also a significant trend. Furthermore, the growing adoption of containerization and microservices architectures creates new attack vectors, driving demand for specialized container security and microservices security solutions within the broader cloud workload protection umbrella. The increasing sophistication of ransomware and supply chain attacks targeting cloud infrastructure also necessitates proactive and reactive security measures, further bolstering market growth.
Dominant Markets & Segments in Cloud Workload Protection Industry
The IT and Telecommunications sector stands out as a dominant end-user segment in the cloud workload protection industry, accounting for a significant portion of the market share. This dominance is driven by the sector's inherent reliance on highly scalable and interconnected cloud infrastructure, making it a prime target for cyberattacks. Within this segment, the adoption of public cloud deployments is exceptionally high, contributing to the increased demand for advanced cloud workload protection solutions like cloud security posture management (CSPM) and threat detection and incident response (TDIR).
- Key Growth Drivers in IT and Telecommunications:
- Massive Data Generation and Processing: The continuous influx of data necessitates robust security to prevent breaches and ensure data integrity.
- Complex Network Architectures: The intricate nature of telecommunications networks, often spanning multiple cloud environments, requires comprehensive visibility and unified security management.
- Stringent Regulatory Compliance: The industry is subject to stringent regulations concerning data privacy and network security, driving investment in compliance-oriented cloud security solutions.
- Rapid Technological Adoption: The sector is at the forefront of adopting new cloud technologies, creating new security challenges and opportunities.
In terms of Component: Solution, Monitoring and Logging and Threat Detection and Incident Response are the most crucial segments, with an estimated market share of xx% and xx% respectively in 2025. These capabilities are fundamental for maintaining operational visibility and responding swiftly to emerging threats. The Policy and Compliance Management segment is also experiencing robust growth, driven by the increasing need to adhere to global data protection regulations.
- Analysis of Market Dominance: The IT and Telecommunications sector's large cloud footprint, coupled with the high stakes of data breaches and service disruptions, makes it a critical market for cloud workload protection vendors. The continuous evolution of cyber threats targeting this sector necessitates ongoing investment in advanced security technologies.
When examining Services, Managed Services are increasingly preferred by organizations seeking specialized expertise and 24/7 monitoring without the overhead of in-house teams. This segment is expected to capture a xx% market share in 2025.
- Key Growth Drivers in Services:
- Shortage of Cybersecurity Talent: The global shortage of skilled cybersecurity professionals drives demand for managed security services.
- Complexity of Cloud Environments: Managing security across multi-cloud and hybrid environments requires specialized expertise that managed service providers offer.
- Cost-Effectiveness: Outsourcing security operations can be more cost-effective for many organizations compared to building and maintaining an in-house security team.
Geographically, North America is a leading market for cloud workload protection, driven by its advanced technological infrastructure, high cloud adoption rates, and proactive regulatory environment. Countries like the United States and Canada are at the forefront of implementing sophisticated cloud security measures.
Cloud Workload Protection Industry Product Analysis
Product innovation in the cloud workload protection industry is heavily focused on delivering comprehensive, multi-layered security for dynamic cloud environments. Leading solutions offer advanced capabilities such as automated threat detection using AI and machine learning, real-time vulnerability assessment, and robust policy and compliance management tools. Competitive advantages are derived from seamless integration with major cloud providers (AWS, Azure, GCP), support for diverse workloads (VMs, containers, serverless), and the ability to provide unified visibility across public, private, and hybrid clouds. Key product advancements include enhanced runtime protection, serverless security, and advanced cloud security posture management (CSPM) features that proactively identify and remediate misconfigurations.
Key Drivers, Barriers & Challenges in Cloud Workload Protection Industry
Key Drivers: The cloud workload protection industry is propelled by the relentless surge in cloud adoption, the escalating sophistication of cyber threats, and stringent regulatory mandates for data security and privacy. Technological advancements, such as AI/ML for threat detection and automation, are critical growth catalysts. Economic factors like the drive for cost-efficiency and scalability further encourage cloud migration, necessitating robust protection.
Key Barriers & Challenges: Despite strong growth, the industry faces challenges such as the increasing complexity of multi-cloud and hybrid environments, a persistent shortage of skilled cybersecurity professionals, and the ever-evolving threat landscape. Regulatory compliance across diverse jurisdictions presents a significant hurdle. Supply chain vulnerabilities within cloud ecosystems and the high cost of implementing comprehensive security solutions can also act as restraints. Competitive pressures among numerous vendors can lead to market saturation and pricing challenges.
Growth Drivers in the Cloud Workload Protection Industry Market
The cloud workload protection market's expansion is fundamentally driven by the accelerated global adoption of cloud computing across all enterprise sizes and sectors. This pervasive shift necessitates robust security to safeguard the increasing volume of sensitive data and critical applications hosted in cloud environments. Furthermore, the escalating frequency and sophistication of cyberattacks, including ransomware, data breaches, and insider threats, are compelling organizations to invest in advanced protection mechanisms. Government regulations and compliance frameworks, such as GDPR, CCPA, and HIPAA, mandate strong data security measures, directly fueling demand for comprehensive cloud workload protection solutions. Technological advancements, particularly in artificial intelligence (AI) and machine learning (ML) for anomaly detection, threat intelligence, and automated incident response, are also pivotal growth catalysts, enabling more proactive and efficient security operations. The growing trend towards hybrid and multi-cloud strategies further accentuates the need for unified and adaptable security solutions.
Challenges Impacting Cloud Workload Protection Industry Growth
Several significant challenges are impacting the growth trajectory of the cloud workload protection industry. The inherent complexity of managing security across diverse and often fragmented multi-cloud and hybrid environments poses a substantial technical and operational hurdle for organizations. A persistent global shortage of skilled cybersecurity professionals exacerbates this challenge, making it difficult for businesses to effectively deploy and manage advanced security solutions. The rapidly evolving nature of cyber threats means that security solutions must constantly adapt, creating a continuous need for updates and innovation, which can be costly and time-consuming. Regulatory compliance across various industries and geographical regions presents a complex web of requirements that security solutions must navigate, adding to the burden of implementation and maintenance. Moreover, the competitive landscape, while driving innovation, can also lead to market saturation and pricing pressures, impacting profitability for some vendors. Supply chain risks within the broader technology ecosystem can also introduce vulnerabilities that are difficult to control.
Key Players Shaping the Cloud Workload Protection Industry Market
- Sophos Group plc
- Trend Micro Inc
- Tripwire Inc
- McAfee LLC
- Broadcom Inc
- HyTrust
- Guardicore
- Dome9 Security Inc
- LogRhythm Inc
- CloudPassage
Significant Cloud Workload Protection Industry Industry Milestones
- 2019: Increasing adoption of containerization technologies (Docker, Kubernetes) spurs demand for specialized container security solutions.
- 2020: Escalating ransomware attacks on cloud infrastructure highlight the critical need for advanced threat detection and incident response.
- 2021: Major cloud providers enhance their native security offerings, pushing third-party vendors to differentiate with specialized, integrated solutions.
- 2022: Growing awareness and implementation of Zero Trust security models across cloud environments.
- 2023: Increased focus on cloud security posture management (CSPM) to address misconfigurations and compliance gaps.
- 2024: Expansion of AI and machine learning capabilities in cloud workload protection for proactive threat intelligence and automated response.
Future Outlook for Cloud Workload Protection Industry Market
The future outlook for the cloud workload protection industry is exceptionally bright, driven by the continued digital transformation and the ever-present threat landscape. Key growth catalysts include the increasing adoption of serverless computing and edge computing, which will demand specialized security solutions. The integration of security into the entire DevOps lifecycle (DevSecOps) will become a standard practice, fostering demand for automated security workflows. AI and machine learning will play an even more critical role in predictive threat analytics and autonomous incident response, moving beyond traditional signature-based detection. Strategic opportunities lie in the development of unified security platforms that offer seamless protection across multi-cloud, hybrid cloud, and containerized environments, providing end-to-end visibility and control. The growing emphasis on data sovereignty and compliance will also drive demand for granular policy enforcement and auditing capabilities within cloud workload protection solutions.
Cloud Workload Protection Industry Segmentation
-
1. Component
-
1.1. Solution
- 1.1.1. Monitoring and Logging
- 1.1.2. Policy and Compliance Management
- 1.1.3. Vulnerability Assessment
- 1.1.4. Threat Detection and Incident Response
- 1.1.5. Others
-
1.2. Services
- 1.2.1. Managed Services
- 1.2.2. Professional Services
-
1.1. Solution
-
2. Deployment
- 2.1. Public
- 2.2. Private
- 2.3. Hybrid
-
3. End-User
- 3.1. BFSI
- 3.2. Healthcare and Life Sciences
- 3.3. IT and Telecommunications
- 3.4. Retail and Consumer Goods
- 3.5. Media and Entertainment
- 3.6. Energy and Utilities
- 3.7. Other End Users
Cloud Workload Protection Industry Segmentation By Geography
- 1. North America
- 2. Europe
- 3. Asia Pacific
- 4. Rest of the Word
Cloud Workload Protection Industry REPORT HIGHLIGHTS
| Aspects | Details |
|---|---|
| Study Period | 2019-2033 |
| Base Year | 2024 |
| Estimated Year | 2025 |
| Forecast Period | 2025-2033 |
| Historical Period | 2019-2024 |
| Growth Rate | CAGR of 24.20% from 2019-2033 |
| Segmentation |
|
Table of Contents
- 1. Introduction
- 1.1. Research Scope
- 1.2. Market Segmentation
- 1.3. Research Methodology
- 1.4. Definitions and Assumptions
- 2. Executive Summary
- 2.1. Introduction
- 3. Market Dynamics
- 3.1. Introduction
- 3.2. Market Drivers
- 3.2.1. ; Increasing Adoption of the Multi-Cloud Strategy Among Enterprises; Seamless Scalability and Reduced Operational Costs
- 3.3. Market Restrains
- 3.3.1. ; Adherence to Multiple Regulatory Compliances
- 3.4. Market Trends
- 3.4.1. Hybrid Cloud Deployment to Drive the Market Growth
- 4. Market Factor Analysis
- 4.1. Porters Five Forces
- 4.2. Supply/Value Chain
- 4.3. PESTEL analysis
- 4.4. Market Entropy
- 4.5. Patent/Trademark Analysis
- 5. Global Cloud Workload Protection Industry Analysis, Insights and Forecast, 2019-2031
- 5.1. Market Analysis, Insights and Forecast - by Component
- 5.1.1. Solution
- 5.1.1.1. Monitoring and Logging
- 5.1.1.2. Policy and Compliance Management
- 5.1.1.3. Vulnerability Assessment
- 5.1.1.4. Threat Detection and Incident Response
- 5.1.1.5. Others
- 5.1.2. Services
- 5.1.2.1. Managed Services
- 5.1.2.2. Professional Services
- 5.1.1. Solution
- 5.2. Market Analysis, Insights and Forecast - by Deployment
- 5.2.1. Public
- 5.2.2. Private
- 5.2.3. Hybrid
- 5.3. Market Analysis, Insights and Forecast - by End-User
- 5.3.1. BFSI
- 5.3.2. Healthcare and Life Sciences
- 5.3.3. IT and Telecommunications
- 5.3.4. Retail and Consumer Goods
- 5.3.5. Media and Entertainment
- 5.3.6. Energy and Utilities
- 5.3.7. Other End Users
- 5.4. Market Analysis, Insights and Forecast - by Region
- 5.4.1. North America
- 5.4.2. Europe
- 5.4.3. Asia Pacific
- 5.4.4. Rest of the Word
- 5.1. Market Analysis, Insights and Forecast - by Component
- 6. North America Cloud Workload Protection Industry Analysis, Insights and Forecast, 2019-2031
- 6.1. Market Analysis, Insights and Forecast - by Component
- 6.1.1. Solution
- 6.1.1.1. Monitoring and Logging
- 6.1.1.2. Policy and Compliance Management
- 6.1.1.3. Vulnerability Assessment
- 6.1.1.4. Threat Detection and Incident Response
- 6.1.1.5. Others
- 6.1.2. Services
- 6.1.2.1. Managed Services
- 6.1.2.2. Professional Services
- 6.1.1. Solution
- 6.2. Market Analysis, Insights and Forecast - by Deployment
- 6.2.1. Public
- 6.2.2. Private
- 6.2.3. Hybrid
- 6.3. Market Analysis, Insights and Forecast - by End-User
- 6.3.1. BFSI
- 6.3.2. Healthcare and Life Sciences
- 6.3.3. IT and Telecommunications
- 6.3.4. Retail and Consumer Goods
- 6.3.5. Media and Entertainment
- 6.3.6. Energy and Utilities
- 6.3.7. Other End Users
- 6.1. Market Analysis, Insights and Forecast - by Component
- 7. Europe Cloud Workload Protection Industry Analysis, Insights and Forecast, 2019-2031
- 7.1. Market Analysis, Insights and Forecast - by Component
- 7.1.1. Solution
- 7.1.1.1. Monitoring and Logging
- 7.1.1.2. Policy and Compliance Management
- 7.1.1.3. Vulnerability Assessment
- 7.1.1.4. Threat Detection and Incident Response
- 7.1.1.5. Others
- 7.1.2. Services
- 7.1.2.1. Managed Services
- 7.1.2.2. Professional Services
- 7.1.1. Solution
- 7.2. Market Analysis, Insights and Forecast - by Deployment
- 7.2.1. Public
- 7.2.2. Private
- 7.2.3. Hybrid
- 7.3. Market Analysis, Insights and Forecast - by End-User
- 7.3.1. BFSI
- 7.3.2. Healthcare and Life Sciences
- 7.3.3. IT and Telecommunications
- 7.3.4. Retail and Consumer Goods
- 7.3.5. Media and Entertainment
- 7.3.6. Energy and Utilities
- 7.3.7. Other End Users
- 7.1. Market Analysis, Insights and Forecast - by Component
- 8. Asia Pacific Cloud Workload Protection Industry Analysis, Insights and Forecast, 2019-2031
- 8.1. Market Analysis, Insights and Forecast - by Component
- 8.1.1. Solution
- 8.1.1.1. Monitoring and Logging
- 8.1.1.2. Policy and Compliance Management
- 8.1.1.3. Vulnerability Assessment
- 8.1.1.4. Threat Detection and Incident Response
- 8.1.1.5. Others
- 8.1.2. Services
- 8.1.2.1. Managed Services
- 8.1.2.2. Professional Services
- 8.1.1. Solution
- 8.2. Market Analysis, Insights and Forecast - by Deployment
- 8.2.1. Public
- 8.2.2. Private
- 8.2.3. Hybrid
- 8.3. Market Analysis, Insights and Forecast - by End-User
- 8.3.1. BFSI
- 8.3.2. Healthcare and Life Sciences
- 8.3.3. IT and Telecommunications
- 8.3.4. Retail and Consumer Goods
- 8.3.5. Media and Entertainment
- 8.3.6. Energy and Utilities
- 8.3.7. Other End Users
- 8.1. Market Analysis, Insights and Forecast - by Component
- 9. Rest of the Word Cloud Workload Protection Industry Analysis, Insights and Forecast, 2019-2031
- 9.1. Market Analysis, Insights and Forecast - by Component
- 9.1.1. Solution
- 9.1.1.1. Monitoring and Logging
- 9.1.1.2. Policy and Compliance Management
- 9.1.1.3. Vulnerability Assessment
- 9.1.1.4. Threat Detection and Incident Response
- 9.1.1.5. Others
- 9.1.2. Services
- 9.1.2.1. Managed Services
- 9.1.2.2. Professional Services
- 9.1.1. Solution
- 9.2. Market Analysis, Insights and Forecast - by Deployment
- 9.2.1. Public
- 9.2.2. Private
- 9.2.3. Hybrid
- 9.3. Market Analysis, Insights and Forecast - by End-User
- 9.3.1. BFSI
- 9.3.2. Healthcare and Life Sciences
- 9.3.3. IT and Telecommunications
- 9.3.4. Retail and Consumer Goods
- 9.3.5. Media and Entertainment
- 9.3.6. Energy and Utilities
- 9.3.7. Other End Users
- 9.1. Market Analysis, Insights and Forecast - by Component
- 10. North America Cloud Workload Protection Industry Analysis, Insights and Forecast, 2019-2031
- 10.1. Market Analysis, Insights and Forecast - By Country/Sub-region
- 10.1.1 United States
- 10.1.2 Canada
- 10.1.3 Mexico
- 11. Europe Cloud Workload Protection Industry Analysis, Insights and Forecast, 2019-2031
- 11.1. Market Analysis, Insights and Forecast - By Country/Sub-region
- 11.1.1 Germany
- 11.1.2 United Kingdom
- 11.1.3 France
- 11.1.4 Spain
- 11.1.5 Italy
- 11.1.6 Spain
- 11.1.7 Belgium
- 11.1.8 Netherland
- 11.1.9 Nordics
- 11.1.10 Rest of Europe
- 12. Asia Pacific Cloud Workload Protection Industry Analysis, Insights and Forecast, 2019-2031
- 12.1. Market Analysis, Insights and Forecast - By Country/Sub-region
- 12.1.1 China
- 12.1.2 Japan
- 12.1.3 India
- 12.1.4 South Korea
- 12.1.5 Southeast Asia
- 12.1.6 Australia
- 12.1.7 Indonesia
- 12.1.8 Phillipes
- 12.1.9 Singapore
- 12.1.10 Thailandc
- 12.1.11 Rest of Asia Pacific
- 13. South America Cloud Workload Protection Industry Analysis, Insights and Forecast, 2019-2031
- 13.1. Market Analysis, Insights and Forecast - By Country/Sub-region
- 13.1.1 Brazil
- 13.1.2 Argentina
- 13.1.3 Peru
- 13.1.4 Chile
- 13.1.5 Colombia
- 13.1.6 Ecuador
- 13.1.7 Venezuela
- 13.1.8 Rest of South America
- 14. North America Cloud Workload Protection Industry Analysis, Insights and Forecast, 2019-2031
- 14.1. Market Analysis, Insights and Forecast - By Country/Sub-region
- 14.1.1 United States
- 14.1.2 Canada
- 14.1.3 Mexico
- 15. MEA Cloud Workload Protection Industry Analysis, Insights and Forecast, 2019-2031
- 15.1. Market Analysis, Insights and Forecast - By Country/Sub-region
- 15.1.1 United Arab Emirates
- 15.1.2 Saudi Arabia
- 15.1.3 South Africa
- 15.1.4 Rest of Middle East and Africa
- 16. Competitive Analysis
- 16.1. Global Market Share Analysis 2024
- 16.2. Company Profiles
- 16.2.1 Sophos Group plc
- 16.2.1.1. Overview
- 16.2.1.2. Products
- 16.2.1.3. SWOT Analysis
- 16.2.1.4. Recent Developments
- 16.2.1.5. Financials (Based on Availability)
- 16.2.2 Trend Micro Inc
- 16.2.2.1. Overview
- 16.2.2.2. Products
- 16.2.2.3. SWOT Analysis
- 16.2.2.4. Recent Developments
- 16.2.2.5. Financials (Based on Availability)
- 16.2.3 Tripwire Inc
- 16.2.3.1. Overview
- 16.2.3.2. Products
- 16.2.3.3. SWOT Analysis
- 16.2.3.4. Recent Developments
- 16.2.3.5. Financials (Based on Availability)
- 16.2.4 McAfee LLC
- 16.2.4.1. Overview
- 16.2.4.2. Products
- 16.2.4.3. SWOT Analysis
- 16.2.4.4. Recent Developments
- 16.2.4.5. Financials (Based on Availability)
- 16.2.5 Broadcom Inc
- 16.2.5.1. Overview
- 16.2.5.2. Products
- 16.2.5.3. SWOT Analysis
- 16.2.5.4. Recent Developments
- 16.2.5.5. Financials (Based on Availability)
- 16.2.6 HyTrust
- 16.2.6.1. Overview
- 16.2.6.2. Products
- 16.2.6.3. SWOT Analysis
- 16.2.6.4. Recent Developments
- 16.2.6.5. Financials (Based on Availability)
- 16.2.7 Guardicore
- 16.2.7.1. Overview
- 16.2.7.2. Products
- 16.2.7.3. SWOT Analysis
- 16.2.7.4. Recent Developments
- 16.2.7.5. Financials (Based on Availability)
- 16.2.8 Dome9 Security Inc
- 16.2.8.1. Overview
- 16.2.8.2. Products
- 16.2.8.3. SWOT Analysis
- 16.2.8.4. Recent Developments
- 16.2.8.5. Financials (Based on Availability)
- 16.2.9 LogRhythm Inc
- 16.2.9.1. Overview
- 16.2.9.2. Products
- 16.2.9.3. SWOT Analysis
- 16.2.9.4. Recent Developments
- 16.2.9.5. Financials (Based on Availability)
- 16.2.10 CloudPassage
- 16.2.10.1. Overview
- 16.2.10.2. Products
- 16.2.10.3. SWOT Analysis
- 16.2.10.4. Recent Developments
- 16.2.10.5. Financials (Based on Availability)
- 16.2.1 Sophos Group plc
List of Figures
- Figure 1: Global Cloud Workload Protection Industry Revenue Breakdown (Million, %) by Region 2024 & 2032
- Figure 2: North America Cloud Workload Protection Industry Revenue (Million), by Country 2024 & 2032
- Figure 3: North America Cloud Workload Protection Industry Revenue Share (%), by Country 2024 & 2032
- Figure 4: Europe Cloud Workload Protection Industry Revenue (Million), by Country 2024 & 2032
- Figure 5: Europe Cloud Workload Protection Industry Revenue Share (%), by Country 2024 & 2032
- Figure 6: Asia Pacific Cloud Workload Protection Industry Revenue (Million), by Country 2024 & 2032
- Figure 7: Asia Pacific Cloud Workload Protection Industry Revenue Share (%), by Country 2024 & 2032
- Figure 8: South America Cloud Workload Protection Industry Revenue (Million), by Country 2024 & 2032
- Figure 9: South America Cloud Workload Protection Industry Revenue Share (%), by Country 2024 & 2032
- Figure 10: North America Cloud Workload Protection Industry Revenue (Million), by Country 2024 & 2032
- Figure 11: North America Cloud Workload Protection Industry Revenue Share (%), by Country 2024 & 2032
- Figure 12: MEA Cloud Workload Protection Industry Revenue (Million), by Country 2024 & 2032
- Figure 13: MEA Cloud Workload Protection Industry Revenue Share (%), by Country 2024 & 2032
- Figure 14: North America Cloud Workload Protection Industry Revenue (Million), by Component 2024 & 2032
- Figure 15: North America Cloud Workload Protection Industry Revenue Share (%), by Component 2024 & 2032
- Figure 16: North America Cloud Workload Protection Industry Revenue (Million), by Deployment 2024 & 2032
- Figure 17: North America Cloud Workload Protection Industry Revenue Share (%), by Deployment 2024 & 2032
- Figure 18: North America Cloud Workload Protection Industry Revenue (Million), by End-User 2024 & 2032
- Figure 19: North America Cloud Workload Protection Industry Revenue Share (%), by End-User 2024 & 2032
- Figure 20: North America Cloud Workload Protection Industry Revenue (Million), by Country 2024 & 2032
- Figure 21: North America Cloud Workload Protection Industry Revenue Share (%), by Country 2024 & 2032
- Figure 22: Europe Cloud Workload Protection Industry Revenue (Million), by Component 2024 & 2032
- Figure 23: Europe Cloud Workload Protection Industry Revenue Share (%), by Component 2024 & 2032
- Figure 24: Europe Cloud Workload Protection Industry Revenue (Million), by Deployment 2024 & 2032
- Figure 25: Europe Cloud Workload Protection Industry Revenue Share (%), by Deployment 2024 & 2032
- Figure 26: Europe Cloud Workload Protection Industry Revenue (Million), by End-User 2024 & 2032
- Figure 27: Europe Cloud Workload Protection Industry Revenue Share (%), by End-User 2024 & 2032
- Figure 28: Europe Cloud Workload Protection Industry Revenue (Million), by Country 2024 & 2032
- Figure 29: Europe Cloud Workload Protection Industry Revenue Share (%), by Country 2024 & 2032
- Figure 30: Asia Pacific Cloud Workload Protection Industry Revenue (Million), by Component 2024 & 2032
- Figure 31: Asia Pacific Cloud Workload Protection Industry Revenue Share (%), by Component 2024 & 2032
- Figure 32: Asia Pacific Cloud Workload Protection Industry Revenue (Million), by Deployment 2024 & 2032
- Figure 33: Asia Pacific Cloud Workload Protection Industry Revenue Share (%), by Deployment 2024 & 2032
- Figure 34: Asia Pacific Cloud Workload Protection Industry Revenue (Million), by End-User 2024 & 2032
- Figure 35: Asia Pacific Cloud Workload Protection Industry Revenue Share (%), by End-User 2024 & 2032
- Figure 36: Asia Pacific Cloud Workload Protection Industry Revenue (Million), by Country 2024 & 2032
- Figure 37: Asia Pacific Cloud Workload Protection Industry Revenue Share (%), by Country 2024 & 2032
- Figure 38: Rest of the Word Cloud Workload Protection Industry Revenue (Million), by Component 2024 & 2032
- Figure 39: Rest of the Word Cloud Workload Protection Industry Revenue Share (%), by Component 2024 & 2032
- Figure 40: Rest of the Word Cloud Workload Protection Industry Revenue (Million), by Deployment 2024 & 2032
- Figure 41: Rest of the Word Cloud Workload Protection Industry Revenue Share (%), by Deployment 2024 & 2032
- Figure 42: Rest of the Word Cloud Workload Protection Industry Revenue (Million), by End-User 2024 & 2032
- Figure 43: Rest of the Word Cloud Workload Protection Industry Revenue Share (%), by End-User 2024 & 2032
- Figure 44: Rest of the Word Cloud Workload Protection Industry Revenue (Million), by Country 2024 & 2032
- Figure 45: Rest of the Word Cloud Workload Protection Industry Revenue Share (%), by Country 2024 & 2032
List of Tables
- Table 1: Global Cloud Workload Protection Industry Revenue Million Forecast, by Region 2019 & 2032
- Table 2: Global Cloud Workload Protection Industry Revenue Million Forecast, by Component 2019 & 2032
- Table 3: Global Cloud Workload Protection Industry Revenue Million Forecast, by Deployment 2019 & 2032
- Table 4: Global Cloud Workload Protection Industry Revenue Million Forecast, by End-User 2019 & 2032
- Table 5: Global Cloud Workload Protection Industry Revenue Million Forecast, by Region 2019 & 2032
- Table 6: Global Cloud Workload Protection Industry Revenue Million Forecast, by Country 2019 & 2032
- Table 7: United States Cloud Workload Protection Industry Revenue (Million) Forecast, by Application 2019 & 2032
- Table 8: Canada Cloud Workload Protection Industry Revenue (Million) Forecast, by Application 2019 & 2032
- Table 9: Mexico Cloud Workload Protection Industry Revenue (Million) Forecast, by Application 2019 & 2032
- Table 10: Global Cloud Workload Protection Industry Revenue Million Forecast, by Country 2019 & 2032
- Table 11: Germany Cloud Workload Protection Industry Revenue (Million) Forecast, by Application 2019 & 2032
- Table 12: United Kingdom Cloud Workload Protection Industry Revenue (Million) Forecast, by Application 2019 & 2032
- Table 13: France Cloud Workload Protection Industry Revenue (Million) Forecast, by Application 2019 & 2032
- Table 14: Spain Cloud Workload Protection Industry Revenue (Million) Forecast, by Application 2019 & 2032
- Table 15: Italy Cloud Workload Protection Industry Revenue (Million) Forecast, by Application 2019 & 2032
- Table 16: Spain Cloud Workload Protection Industry Revenue (Million) Forecast, by Application 2019 & 2032
- Table 17: Belgium Cloud Workload Protection Industry Revenue (Million) Forecast, by Application 2019 & 2032
- Table 18: Netherland Cloud Workload Protection Industry Revenue (Million) Forecast, by Application 2019 & 2032
- Table 19: Nordics Cloud Workload Protection Industry Revenue (Million) Forecast, by Application 2019 & 2032
- Table 20: Rest of Europe Cloud Workload Protection Industry Revenue (Million) Forecast, by Application 2019 & 2032
- Table 21: Global Cloud Workload Protection Industry Revenue Million Forecast, by Country 2019 & 2032
- Table 22: China Cloud Workload Protection Industry Revenue (Million) Forecast, by Application 2019 & 2032
- Table 23: Japan Cloud Workload Protection Industry Revenue (Million) Forecast, by Application 2019 & 2032
- Table 24: India Cloud Workload Protection Industry Revenue (Million) Forecast, by Application 2019 & 2032
- Table 25: South Korea Cloud Workload Protection Industry Revenue (Million) Forecast, by Application 2019 & 2032
- Table 26: Southeast Asia Cloud Workload Protection Industry Revenue (Million) Forecast, by Application 2019 & 2032
- Table 27: Australia Cloud Workload Protection Industry Revenue (Million) Forecast, by Application 2019 & 2032
- Table 28: Indonesia Cloud Workload Protection Industry Revenue (Million) Forecast, by Application 2019 & 2032
- Table 29: Phillipes Cloud Workload Protection Industry Revenue (Million) Forecast, by Application 2019 & 2032
- Table 30: Singapore Cloud Workload Protection Industry Revenue (Million) Forecast, by Application 2019 & 2032
- Table 31: Thailandc Cloud Workload Protection Industry Revenue (Million) Forecast, by Application 2019 & 2032
- Table 32: Rest of Asia Pacific Cloud Workload Protection Industry Revenue (Million) Forecast, by Application 2019 & 2032
- Table 33: Global Cloud Workload Protection Industry Revenue Million Forecast, by Country 2019 & 2032
- Table 34: Brazil Cloud Workload Protection Industry Revenue (Million) Forecast, by Application 2019 & 2032
- Table 35: Argentina Cloud Workload Protection Industry Revenue (Million) Forecast, by Application 2019 & 2032
- Table 36: Peru Cloud Workload Protection Industry Revenue (Million) Forecast, by Application 2019 & 2032
- Table 37: Chile Cloud Workload Protection Industry Revenue (Million) Forecast, by Application 2019 & 2032
- Table 38: Colombia Cloud Workload Protection Industry Revenue (Million) Forecast, by Application 2019 & 2032
- Table 39: Ecuador Cloud Workload Protection Industry Revenue (Million) Forecast, by Application 2019 & 2032
- Table 40: Venezuela Cloud Workload Protection Industry Revenue (Million) Forecast, by Application 2019 & 2032
- Table 41: Rest of South America Cloud Workload Protection Industry Revenue (Million) Forecast, by Application 2019 & 2032
- Table 42: Global Cloud Workload Protection Industry Revenue Million Forecast, by Country 2019 & 2032
- Table 43: United States Cloud Workload Protection Industry Revenue (Million) Forecast, by Application 2019 & 2032
- Table 44: Canada Cloud Workload Protection Industry Revenue (Million) Forecast, by Application 2019 & 2032
- Table 45: Mexico Cloud Workload Protection Industry Revenue (Million) Forecast, by Application 2019 & 2032
- Table 46: Global Cloud Workload Protection Industry Revenue Million Forecast, by Country 2019 & 2032
- Table 47: United Arab Emirates Cloud Workload Protection Industry Revenue (Million) Forecast, by Application 2019 & 2032
- Table 48: Saudi Arabia Cloud Workload Protection Industry Revenue (Million) Forecast, by Application 2019 & 2032
- Table 49: South Africa Cloud Workload Protection Industry Revenue (Million) Forecast, by Application 2019 & 2032
- Table 50: Rest of Middle East and Africa Cloud Workload Protection Industry Revenue (Million) Forecast, by Application 2019 & 2032
- Table 51: Global Cloud Workload Protection Industry Revenue Million Forecast, by Component 2019 & 2032
- Table 52: Global Cloud Workload Protection Industry Revenue Million Forecast, by Deployment 2019 & 2032
- Table 53: Global Cloud Workload Protection Industry Revenue Million Forecast, by End-User 2019 & 2032
- Table 54: Global Cloud Workload Protection Industry Revenue Million Forecast, by Country 2019 & 2032
- Table 55: Global Cloud Workload Protection Industry Revenue Million Forecast, by Component 2019 & 2032
- Table 56: Global Cloud Workload Protection Industry Revenue Million Forecast, by Deployment 2019 & 2032
- Table 57: Global Cloud Workload Protection Industry Revenue Million Forecast, by End-User 2019 & 2032
- Table 58: Global Cloud Workload Protection Industry Revenue Million Forecast, by Country 2019 & 2032
- Table 59: Global Cloud Workload Protection Industry Revenue Million Forecast, by Component 2019 & 2032
- Table 60: Global Cloud Workload Protection Industry Revenue Million Forecast, by Deployment 2019 & 2032
- Table 61: Global Cloud Workload Protection Industry Revenue Million Forecast, by End-User 2019 & 2032
- Table 62: Global Cloud Workload Protection Industry Revenue Million Forecast, by Country 2019 & 2032
- Table 63: Global Cloud Workload Protection Industry Revenue Million Forecast, by Component 2019 & 2032
- Table 64: Global Cloud Workload Protection Industry Revenue Million Forecast, by Deployment 2019 & 2032
- Table 65: Global Cloud Workload Protection Industry Revenue Million Forecast, by End-User 2019 & 2032
- Table 66: Global Cloud Workload Protection Industry Revenue Million Forecast, by Country 2019 & 2032
Frequently Asked Questions
1. What is the projected Compound Annual Growth Rate (CAGR) of the Cloud Workload Protection Industry?
The projected CAGR is approximately 24.20%.
2. Which companies are prominent players in the Cloud Workload Protection Industry?
Key companies in the market include Sophos Group plc, Trend Micro Inc, Tripwire Inc , McAfee LLC, Broadcom Inc, HyTrust, Guardicore, Dome9 Security Inc, LogRhythm Inc, CloudPassage.
3. What are the main segments of the Cloud Workload Protection Industry?
The market segments include Component, Deployment, End-User.
4. Can you provide details about the market size?
The market size is estimated to be USD XX Million as of 2022.
5. What are some drivers contributing to market growth?
; Increasing Adoption of the Multi-Cloud Strategy Among Enterprises; Seamless Scalability and Reduced Operational Costs.
6. What are the notable trends driving market growth?
Hybrid Cloud Deployment to Drive the Market Growth.
7. Are there any restraints impacting market growth?
; Adherence to Multiple Regulatory Compliances.
8. Can you provide examples of recent developments in the market?
N/A
9. What pricing options are available for accessing the report?
Pricing options include single-user, multi-user, and enterprise licenses priced at USD 4750, USD 5250, and USD 8750 respectively.
10. Is the market size provided in terms of value or volume?
The market size is provided in terms of value, measured in Million.
11. Are there any specific market keywords associated with the report?
Yes, the market keyword associated with the report is "Cloud Workload Protection Industry," which aids in identifying and referencing the specific market segment covered.
12. How do I determine which pricing option suits my needs best?
The pricing options vary based on user requirements and access needs. Individual users may opt for single-user licenses, while businesses requiring broader access may choose multi-user or enterprise licenses for cost-effective access to the report.
13. Are there any additional resources or data provided in the Cloud Workload Protection Industry report?
While the report offers comprehensive insights, it's advisable to review the specific contents or supplementary materials provided to ascertain if additional resources or data are available.
14. How can I stay updated on further developments or reports in the Cloud Workload Protection Industry?
To stay informed about further developments, trends, and reports in the Cloud Workload Protection Industry, consider subscribing to industry newsletters, following relevant companies and organizations, or regularly checking reputable industry news sources and publications.
Methodology
Step 1 - Identification of Relevant Samples Size from Population Database


Step 2 - Approaches for Defining Global Market Size (Value, Volume* & Price*)

Note*: In applicable scenarios
Step 3 - Data Sources
Primary Research
- Web Analytics
- Survey Reports
- Research Institute
- Latest Research Reports
- Opinion Leaders
Secondary Research
- Annual Reports
- White Paper
- Latest Press Release
- Industry Association
- Paid Database
- Investor Presentations

Step 4 - Data Triangulation
Involves using different sources of information in order to increase the validity of a study
These sources are likely to be stakeholders in a program - participants, other researchers, program staff, other community members, and so on.
Then we put all data in single framework & apply various statistical tools to find out the dynamic on the market.
During the analysis stage, feedback from the stakeholder groups would be compared to determine areas of agreement as well as areas of divergence
