

Key Insights
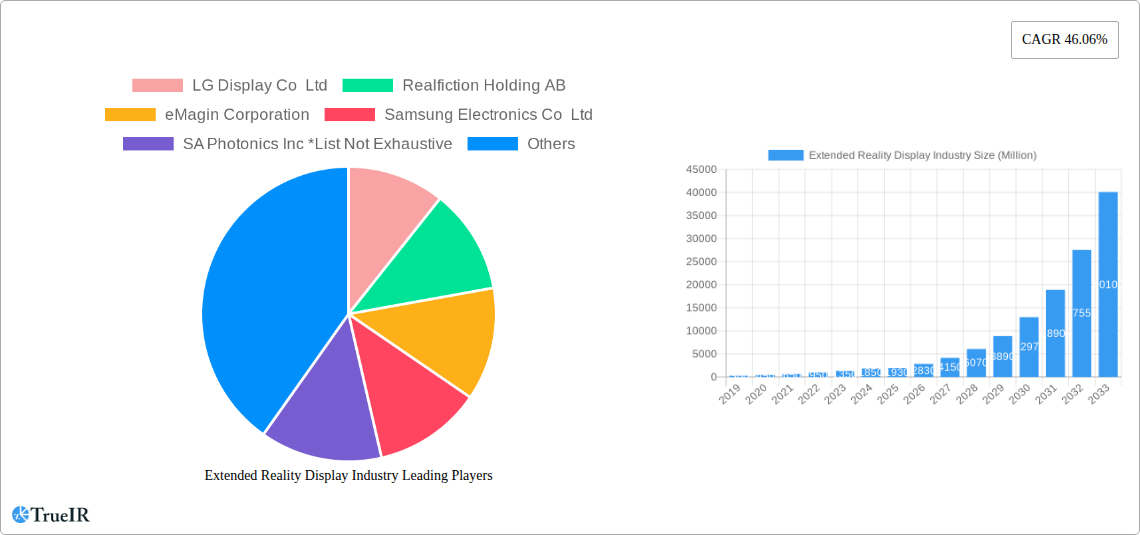
The Extended Reality (XR) Display Industry is experiencing an unprecedented surge, projected to reach a market size of USD 1.93 billion, fueled by an exceptional Compound Annual Growth Rate (CAGR) of 46.06%. This remarkable expansion, expected to continue robustly through 2033, is primarily driven by the escalating demand for immersive experiences across diverse sectors. The gaming and entertainment industry stands as a pivotal catalyst, with consumers increasingly seeking realistic and engaging virtual and augmented realities. Beyond entertainment, significant adoption is observed in healthcare for surgical training and patient visualization, in education for interactive learning environments, and in the military and defense sectors for sophisticated simulation and training. Furthermore, the automotive industry is leveraging XR displays for advanced driver-assistance systems and in-car entertainment, while the retail sector is exploring AR for enhanced customer experiences and product visualization. These dynamic applications are collectively propelling the XR display market forward, necessitating advancements in display technologies to meet the growing needs for higher resolution, wider fields of view, and reduced latency.
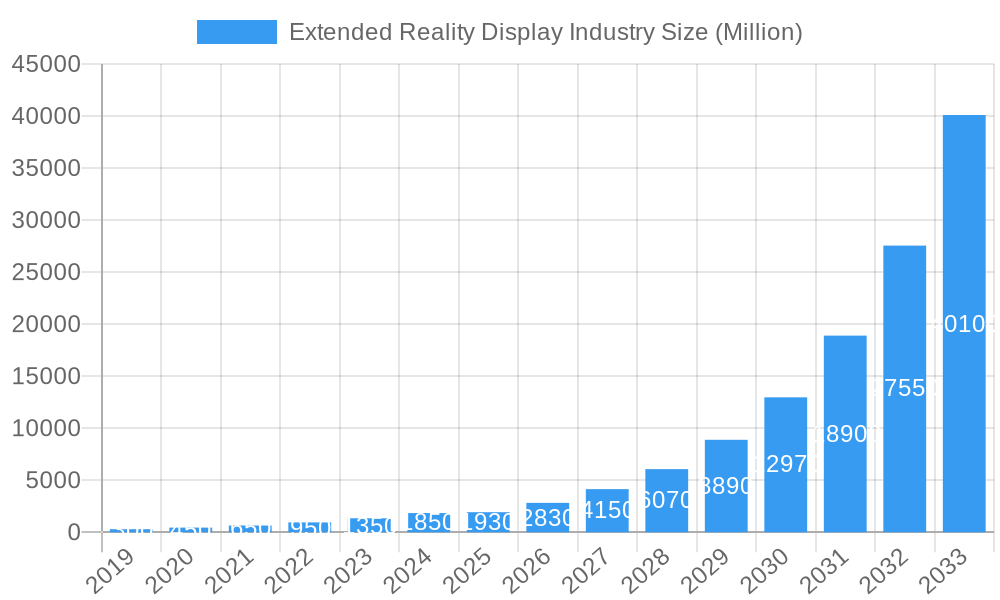
Extended Reality Display Industry Market Size (In Million)
The technological landscape of XR displays is characterized by a keen competition between Liquid Crystal Displays (LCD) and Organic Light-Emitting Diode (OLED) technologies, each offering distinct advantages. OLEDs are gaining prominence due to their superior contrast ratios, faster response times, and self-emissive pixels, which are crucial for delivering the vibrant and fluid visuals essential for convincing XR experiences. However, LCDs continue to hold a significant market share due to their cost-effectiveness and established manufacturing processes. Emerging display types are also poised to disrupt the market, promising even more advanced capabilities. Key industry players, including LG Display, Samsung Electronics, Sony Corporation, and Kopin Corporation, are heavily investing in research and development to innovate and capture market share. While growth is global, Asia Pacific is expected to lead, driven by strong manufacturing capabilities and a burgeoning tech-savvy population, followed closely by North America and Europe, as investments in XR infrastructure and content creation intensify. Challenges such as high production costs for advanced displays and the need for standardized content creation frameworks are being addressed through continuous innovation and strategic partnerships.
Extended Reality Display Industry Company Market Share
This comprehensive report delves into the burgeoning Extended Reality (XR) Display Industry, providing an in-depth analysis of market dynamics, technological advancements, and future growth trajectories. Covering the historical period of 2019-2024 and extending to a forecast period of 2025-2033, with a base and estimated year of 2025, this report is an essential resource for stakeholders seeking to understand the intricate landscape of XR displays. We explore the significant role of advanced display technologies like OLED and MicroOLED, alongside traditional LCDs, in powering immersive experiences across diverse end-user industries, including gaming, healthcare, education, military, automotive, and retail.
Extended Reality Display Industry Market Structure & Competitive Landscape
The Extended Reality (XR) display market is characterized by a dynamic and evolving competitive landscape, marked by intense innovation and strategic collaborations. Market concentration is moderate, with a few key players holding significant market share while a robust ecosystem of emerging companies contributes to rapid technological advancement. Innovation drivers are primarily focused on enhancing visual fidelity, reducing form factors, and improving power efficiency, crucial for widespread XR adoption. Regulatory impacts, while nascent, are expected to grow as XR devices become more integrated into daily life, particularly concerning data privacy and content moderation. Product substitutes, such as high-resolution traditional displays for certain applications, pose a challenge, but the unique immersive capabilities of XR displays offer a distinct advantage. End-user segmentation is a critical aspect, with gaming and entertainment currently dominating, but with substantial growth anticipated in healthcare, education, and military sectors. Merger and acquisition (M&A) trends are expected to accelerate as larger technology firms seek to acquire specialized XR display expertise and intellectual property, potentially increasing market concentration in the long term. Quantitative insights reveal an increasing investment in R&D, with an estimated USD 500 million in M&A activity projected for the forecast period.
Extended Reality Display Industry Market Trends & Opportunities
The Extended Reality (XR) Display Industry is poised for exponential growth, driven by a confluence of technological advancements, shifting consumer preferences, and increasing adoption across various sectors. The market size is projected to expand from approximately USD 20 Billion in the base year of 2025 to over USD 150 Billion by 2033, exhibiting a compound annual growth rate (CAGR) of over 20%. Technological shifts are at the forefront of this expansion, with a pronounced move towards higher resolution, wider fields of view, and improved refresh rates to deliver truly immersive and comfortable XR experiences. The increasing demand for MicroOLED and advanced OLED technologies, offering superior contrast ratios, faster response times, and greater energy efficiency compared to traditional Liquid Crystal Displays (LCDs), is a significant trend. Consumer preferences are evolving rapidly, with a growing appetite for realistic and interactive entertainment, particularly in gaming and virtual social platforms. Furthermore, the utility of XR is being recognized beyond entertainment, with significant opportunities arising in the healthcare sector for surgical training and patient education, in education for engaging learning experiences, and in the military for advanced simulation and training. Competitive dynamics are intensifying, with established display manufacturers investing heavily in XR-specific display solutions, alongside innovative startups pushing the boundaries of display technology. The market penetration of XR devices, while currently modest, is expected to surge as display costs decrease and performance capabilities increase, making XR displays a critical component in the future of computing and human-computer interaction. The ongoing development of foldable and flexible display technologies also presents a unique opportunity to create more versatile and ergonomic XR form factors.
Dominant Markets & Segments in Extended Reality Display Industry
The Extended Reality (XR) Display Industry exhibits distinct regional dominance and segment leadership, shaping the trajectory of market growth. Geographically, North America currently leads in market penetration and demand for XR displays, fueled by a strong gaming and entertainment industry and significant investment in defense and enterprise applications. However, Asia-Pacific is emerging as a rapidly growing market, driven by substantial manufacturing capabilities, increasing consumer disposable income, and a burgeoning tech-savvy population, with an estimated market share of over 35% by 2033.
Display Type Dominance:
- Organic Light-Emitting Diode (OLED): OLED technology is increasingly dominating the high-end XR display market due to its superior contrast ratios, true blacks, and faster response times, essential for delivering photorealistic visuals. The demand for microOLED panels, as exemplified by Samsung Display's development for leading tech giants, is a key growth driver.
- Liquid Crystal Displays (LCD): While facing competition from OLED, advanced LCD technologies, particularly AMLCDs, continue to hold a significant share, especially in cost-sensitive applications and where extreme brightness is paramount, such as military aviation displays like Kopin's Brillian.
- Other Display Types: Emerging technologies, including MicroLED, are showing immense potential for future XR applications due to their inherent advantages in brightness, efficiency, and lifespan, though their current market penetration remains niche.
End-User Industry Dominance:
- Gaming and Entertainment: This segment remains the primary consumer of XR displays, accounting for approximately 40% of the market. The demand for more immersive and realistic gaming experiences continues to drive innovation and adoption.
- Military and Defense: This sector represents a high-value segment, with significant demand for ruggedized and high-performance XR displays for training simulations, tactical displays, and heads-up displays (HUDs).
- Healthcare: Growing adoption of XR for surgical training, remote patient monitoring, and therapeutic applications is creating substantial growth opportunities, with a projected market share increase of over 15% in the forecast period.
- Automotive and Manufacturing: XR displays are finding applications in advanced driver-assistance systems (ADAS), in-car entertainment, and industrial training and maintenance.
Extended Reality Display Industry Product Analysis
The Extended Reality (XR) display industry is characterized by rapid product innovation focused on enhancing the immersive experience. Key advancements include the development of ultra-high resolution displays with pixel densities exceeding 3,000 PPI, crucial for eliminating the screen-door effect and delivering lifelike visuals. Innovations in optical technologies, such as advanced waveguide displays and pancake lenses, are enabling thinner and lighter XR headsets. The pursuit of wider fields of view (FOV) and higher refresh rates (e.g., 120Hz and above) are critical for reducing motion sickness and improving user comfort. Furthermore, the integration of dynamic dimming and HDR capabilities is enhancing color accuracy and contrast, pushing the boundaries of visual fidelity in XR applications.
Key Drivers, Barriers & Challenges in Extended Reality Display Industry
The Extended Reality (XR) Display Industry is propelled by powerful drivers, including the insatiable demand for more immersive entertainment and the growing adoption of XR in professional training and simulation. Technological advancements in display resolutions, refresh rates, and form factors are continuously improving user experience. Economic factors, such as decreasing component costs and increasing consumer disposable income, are making XR more accessible. Policy-driven initiatives, particularly in defense and education sectors, are also contributing to market expansion.
Conversely, significant barriers and challenges impede widespread adoption. High manufacturing costs for advanced XR displays remain a constraint, impacting the affordability of end-user devices. Supply chain complexities and the reliance on specialized components can lead to production bottlenecks. Regulatory hurdles, especially concerning data privacy and the ethical implications of immersive technologies, require careful navigation. Furthermore, intense competitive pressures and the rapid pace of technological obsolescence necessitate continuous innovation and investment.
Growth Drivers in the Extended Reality Display Industry Market
The Extended Reality (XR) Display Industry's growth is primarily fueled by escalating consumer demand for hyper-realistic gaming and entertainment experiences, which necessitates advanced visual fidelity. Technologically, breakthroughs in microdisplay technologies, such as MicroOLED and microLED, are enabling smaller, lighter, and more power-efficient XR devices with higher resolutions and wider fields of view. Economic factors, including the increasing affordability of advanced display components and the proliferation of XR-compatible content, are driving market adoption. Policy support, particularly in sectors like defense and education, for immersive training and simulation solutions further accelerates growth.
Challenges Impacting Extended Reality Display Industry Growth
Despite its promising outlook, the Extended Reality (XR) Display Industry faces considerable challenges. The high cost of manufacturing advanced XR displays, especially those incorporating cutting-edge OLED and microdisplay technologies, remains a significant barrier to mass market adoption, with production costs estimated to be 20-30% higher than comparable traditional displays. Supply chain vulnerabilities, particularly concerning the availability of specialized optical components and advanced semiconductor substrates, can lead to production delays and increased costs. Regulatory complexities surrounding data privacy, user safety, and content standards in virtual environments are yet to be fully addressed, creating uncertainty for developers and manufacturers. Competitive pressures from established display giants and agile startups alike necessitate continuous, high-stakes R&D investment, risking faster obsolescence of current product generations.
Key Players Shaping the Extended Reality Display Industry Market
- LG Display Co Ltd
- Realfiction Holding AB
- eMagin Corporation
- Samsung Electronics Co Ltd
- SA Photonics Inc
- Japan Display Inc
- Seiko Epson Corporation
- Plessey Company plc
- Lumus Ltd
- Kopin Corporation
- BOE Technology Group Co Ltd
- Sony Corporation
Significant Extended Reality Display Industry Industry Milestones
- July 2022: Kopin received production orders totaling approximately USD 3.8 million for its new ultra-bright, full-color Brillian Active Matrix Liquid Crystal Display (AMLCD) used by helicopter pilots to display real-time flight and target information. The current orders have scheduled deliveries through the fourth quarter of 2023.
- July 2022: Samsung Display will be developing a MicroOLED panel for its customers, including Samsung Electronics, Apple, and Meta.
- June 2022: JDI developed its revolutionary transparent Raelclear display technology and planned to mass manufacture a new 20.8-inch Rælclear display with 2X brightness in the fall of 2023. This new 20.8-inch display was designed and developed to meet consumer needs for more and richer information on a single display. JDI used its proprietary backplane technology to 2X the refresh rate, decrease flicker, and boost image clarity, along with the large 20.8-inch screen.
Future Outlook for Extended Reality Display Industry Market
The future outlook for the Extended Reality (XR) Display Industry is exceptionally robust, with significant growth catalysts poised to shape its trajectory. Strategic opportunities lie in the continued miniaturization and performance enhancement of microdisplays, leading to more comfortable and accessible XR devices. The increasing integration of AI and advanced sensor technologies within XR displays will unlock novel applications in fields like personalized healthcare and collaborative work environments. Market potential is immense as XR transitions from a niche technology to a mainstream computing platform, potentially capturing over 25% of the overall display market by 2033. Continued investment in R&D, coupled with strategic partnerships, will be pivotal in overcoming current technological and economic hurdles.
Extended Reality Display Industry Segmentation
-
1. Display Type
- 1.1. Liquid Crystal Displays (LCD)
- 1.2. Organic Light-Emitting Diode (OLED)
- 1.3. Other Display Type
-
2. End-User Industry
- 2.1. Gaming and Entertainment
- 2.2. Healthcare
- 2.3. Education
- 2.4. Military and Defense
- 2.5. Automotive and Manufacturing
- 2.6. Retail
- 2.7. Other Applications
Extended Reality Display Industry Segmentation By Geography
- 1. North America
- 2. Europe
- 3. Asia Pacific
- 4. Rest of the World
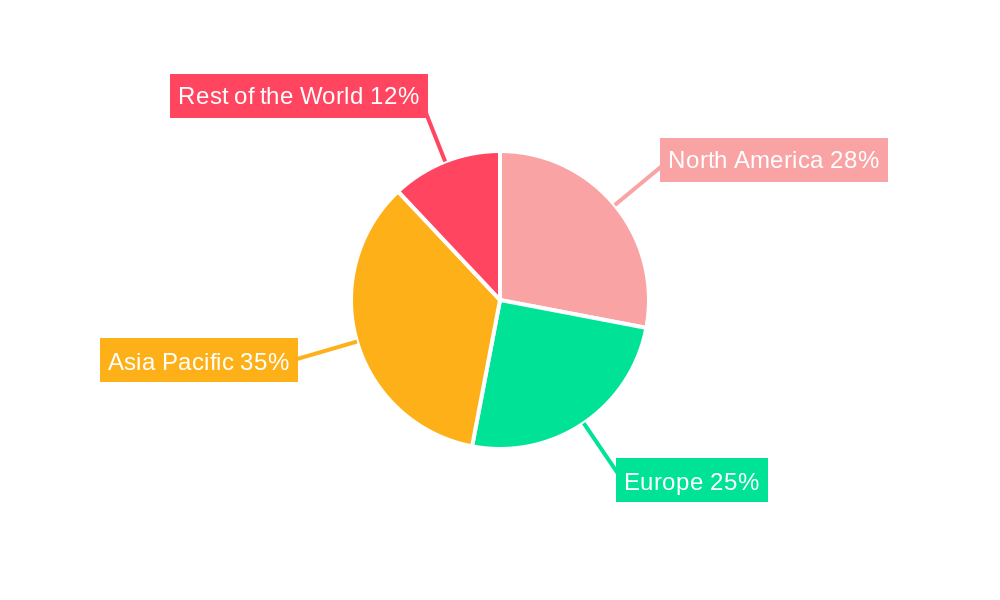
Extended Reality Display Industry Regional Market Share
Geographic Coverage of Extended Reality Display Industry
Extended Reality Display Industry REPORT HIGHLIGHTS
| Aspects | Details |
|---|---|
| Study Period | 2020-2034 |
| Base Year | 2025 |
| Estimated Year | 2026 |
| Forecast Period | 2026-2034 |
| Historical Period | 2020-2025 |
| Growth Rate | CAGR of 46.06% from 2020-2034 |
| Segmentation |
|
Table of Contents
- 1. Introduction
- 1.1. Research Scope
- 1.2. Market Segmentation
- 1.3. Research Objective
- 1.4. Definitions and Assumptions
- 2. Executive Summary
- 2.1. Market Snapshot
- 3. Market Dynamics
- 3.1. Market Drivers
- 3.2. Market Restrains
- 3.3. Market Trends
- 3.4. Market Opportunities
- 4. Market Factor Analysis
- 4.1. Porters Five Forces
- 4.1.1. Bargaining Power of Suppliers
- 4.1.2. Bargaining Power of Buyers
- 4.1.3. Threat of New Entrants
- 4.1.4. Threat of Substitutes
- 4.1.5. Competitive Rivalry
- 4.2. PESTEL analysis
- 4.3. BCG Analysis
- 4.3.1. Stars (High Growth, High Market Share)
- 4.3.2. Cash Cows (Low Growth, High Market Share)
- 4.3.3. Question Mark (High Growth, Low Market Share)
- 4.3.4. Dogs (Low Growth, Low Market Share)
- 4.4. Ansoff Matrix Analysis
- 4.5. Supply Chain Analysis
- 4.6. Regulatory Landscape
- 4.7. Current Market Potential and Opportunity Assessment (TAM–SAM–SOM Framework)
- 4.8. TIR Analyst Note
- 4.1. Porters Five Forces
- 5. Market Analysis, Insights and Forecast 2021-2033
- 5.1. Market Analysis, Insights and Forecast - by Display Type
- 5.1.1. Liquid Crystal Displays (LCD)
- 5.1.2. Organic Light-Emitting Diode (OLED)
- 5.1.3. Other Display Type
- 5.2. Market Analysis, Insights and Forecast - by End-User Industry
- 5.2.1. Gaming and Entertainment
- 5.2.2. Healthcare
- 5.2.3. Education
- 5.2.4. Military and Defense
- 5.2.5. Automotive and Manufacturing
- 5.2.6. Retail
- 5.2.7. Other Applications
- 5.3. Market Analysis, Insights and Forecast - by Region
- 5.3.1. North America
- 5.3.2. Europe
- 5.3.3. Asia Pacific
- 5.3.4. Rest of the World
- 5.1. Market Analysis, Insights and Forecast - by Display Type
- 6. Global Extended Reality Display Industry Analysis, Insights and Forecast, 2021-2033
- 6.1. Market Analysis, Insights and Forecast - by Display Type
- 6.1.1. Liquid Crystal Displays (LCD)
- 6.1.2. Organic Light-Emitting Diode (OLED)
- 6.1.3. Other Display Type
- 6.2. Market Analysis, Insights and Forecast - by End-User Industry
- 6.2.1. Gaming and Entertainment
- 6.2.2. Healthcare
- 6.2.3. Education
- 6.2.4. Military and Defense
- 6.2.5. Automotive and Manufacturing
- 6.2.6. Retail
- 6.2.7. Other Applications
- 6.1. Market Analysis, Insights and Forecast - by Display Type
- 7. North America Extended Reality Display Industry Analysis, Insights and Forecast, 2020-2032
- 7.1. Market Analysis, Insights and Forecast - by Display Type
- 7.1.1. Liquid Crystal Displays (LCD)
- 7.1.2. Organic Light-Emitting Diode (OLED)
- 7.1.3. Other Display Type
- 7.2. Market Analysis, Insights and Forecast - by End-User Industry
- 7.2.1. Gaming and Entertainment
- 7.2.2. Healthcare
- 7.2.3. Education
- 7.2.4. Military and Defense
- 7.2.5. Automotive and Manufacturing
- 7.2.6. Retail
- 7.2.7. Other Applications
- 7.1. Market Analysis, Insights and Forecast - by Display Type
- 8. Europe Extended Reality Display Industry Analysis, Insights and Forecast, 2020-2032
- 8.1. Market Analysis, Insights and Forecast - by Display Type
- 8.1.1. Liquid Crystal Displays (LCD)
- 8.1.2. Organic Light-Emitting Diode (OLED)
- 8.1.3. Other Display Type
- 8.2. Market Analysis, Insights and Forecast - by End-User Industry
- 8.2.1. Gaming and Entertainment
- 8.2.2. Healthcare
- 8.2.3. Education
- 8.2.4. Military and Defense
- 8.2.5. Automotive and Manufacturing
- 8.2.6. Retail
- 8.2.7. Other Applications
- 8.1. Market Analysis, Insights and Forecast - by Display Type
- 9. Asia Pacific Extended Reality Display Industry Analysis, Insights and Forecast, 2020-2032
- 9.1. Market Analysis, Insights and Forecast - by Display Type
- 9.1.1. Liquid Crystal Displays (LCD)
- 9.1.2. Organic Light-Emitting Diode (OLED)
- 9.1.3. Other Display Type
- 9.2. Market Analysis, Insights and Forecast - by End-User Industry
- 9.2.1. Gaming and Entertainment
- 9.2.2. Healthcare
- 9.2.3. Education
- 9.2.4. Military and Defense
- 9.2.5. Automotive and Manufacturing
- 9.2.6. Retail
- 9.2.7. Other Applications
- 9.1. Market Analysis, Insights and Forecast - by Display Type
- 10. Rest of the World Extended Reality Display Industry Analysis, Insights and Forecast, 2020-2032
- 10.1. Market Analysis, Insights and Forecast - by Display Type
- 10.1.1. Liquid Crystal Displays (LCD)
- 10.1.2. Organic Light-Emitting Diode (OLED)
- 10.1.3. Other Display Type
- 10.2. Market Analysis, Insights and Forecast - by End-User Industry
- 10.2.1. Gaming and Entertainment
- 10.2.2. Healthcare
- 10.2.3. Education
- 10.2.4. Military and Defense
- 10.2.5. Automotive and Manufacturing
- 10.2.6. Retail
- 10.2.7. Other Applications
- 10.1. Market Analysis, Insights and Forecast - by Display Type
- 11. Competitive Analysis
- 11.1. Company Profiles
- 11.1.1 LG Display Co Ltd
- 11.1.1.1. Company Overview
- 11.1.1.2. Products
- 11.1.1.3. Company Financials
- 11.1.1.4. SWOT Analysis
- 11.1.2 Realfiction Holding AB
- 11.1.2.1. Company Overview
- 11.1.2.2. Products
- 11.1.2.3. Company Financials
- 11.1.2.4. SWOT Analysis
- 11.1.3 eMagin Corporation
- 11.1.3.1. Company Overview
- 11.1.3.2. Products
- 11.1.3.3. Company Financials
- 11.1.3.4. SWOT Analysis
- 11.1.4 Samsung Electronics Co Ltd
- 11.1.4.1. Company Overview
- 11.1.4.2. Products
- 11.1.4.3. Company Financials
- 11.1.4.4. SWOT Analysis
- 11.1.5 SA Photonics Inc *List Not Exhaustive
- 11.1.5.1. Company Overview
- 11.1.5.2. Products
- 11.1.5.3. Company Financials
- 11.1.5.4. SWOT Analysis
- 11.1.6 Japan Display Inc
- 11.1.6.1. Company Overview
- 11.1.6.2. Products
- 11.1.6.3. Company Financials
- 11.1.6.4. SWOT Analysis
- 11.1.7 Seiko Epson Corporation
- 11.1.7.1. Company Overview
- 11.1.7.2. Products
- 11.1.7.3. Company Financials
- 11.1.7.4. SWOT Analysis
- 11.1.8 Plessey Company plc
- 11.1.8.1. Company Overview
- 11.1.8.2. Products
- 11.1.8.3. Company Financials
- 11.1.8.4. SWOT Analysis
- 11.1.9 Lumus Ltd
- 11.1.9.1. Company Overview
- 11.1.9.2. Products
- 11.1.9.3. Company Financials
- 11.1.9.4. SWOT Analysis
- 11.1.10 Kopin Corporation
- 11.1.10.1. Company Overview
- 11.1.10.2. Products
- 11.1.10.3. Company Financials
- 11.1.10.4. SWOT Analysis
- 11.1.11 BOE Technology Group Co Ltd
- 11.1.11.1. Company Overview
- 11.1.11.2. Products
- 11.1.11.3. Company Financials
- 11.1.11.4. SWOT Analysis
- 11.1.12 Sony Corporation
- 11.1.12.1. Company Overview
- 11.1.12.2. Products
- 11.1.12.3. Company Financials
- 11.1.12.4. SWOT Analysis
- 11.1.1 LG Display Co Ltd
- 11.2. Market Entropy
- 11.2.1 Company's Key Areas Served
- 11.2.2 Recent Developments
- 11.3. Company Market Share Analysis 2025
- 11.3.1 Top 5 Companies Market Share Analysis
- 11.3.2 Top 3 Companies Market Share Analysis
- 11.4. List of Potential Customers
- 12. Research Methodology
List of Figures
- Figure 1: Global Extended Reality Display Industry Revenue Breakdown (Million, %) by Region 2025 & 2033
- Figure 2: North America Extended Reality Display Industry Revenue (Million), by Display Type 2025 & 2033
- Figure 3: North America Extended Reality Display Industry Revenue Share (%), by Display Type 2025 & 2033
- Figure 4: North America Extended Reality Display Industry Revenue (Million), by End-User Industry 2025 & 2033
- Figure 5: North America Extended Reality Display Industry Revenue Share (%), by End-User Industry 2025 & 2033
- Figure 6: North America Extended Reality Display Industry Revenue (Million), by Country 2025 & 2033
- Figure 7: North America Extended Reality Display Industry Revenue Share (%), by Country 2025 & 2033
- Figure 8: Europe Extended Reality Display Industry Revenue (Million), by Display Type 2025 & 2033
- Figure 9: Europe Extended Reality Display Industry Revenue Share (%), by Display Type 2025 & 2033
- Figure 10: Europe Extended Reality Display Industry Revenue (Million), by End-User Industry 2025 & 2033
- Figure 11: Europe Extended Reality Display Industry Revenue Share (%), by End-User Industry 2025 & 2033
- Figure 12: Europe Extended Reality Display Industry Revenue (Million), by Country 2025 & 2033
- Figure 13: Europe Extended Reality Display Industry Revenue Share (%), by Country 2025 & 2033
- Figure 14: Asia Pacific Extended Reality Display Industry Revenue (Million), by Display Type 2025 & 2033
- Figure 15: Asia Pacific Extended Reality Display Industry Revenue Share (%), by Display Type 2025 & 2033
- Figure 16: Asia Pacific Extended Reality Display Industry Revenue (Million), by End-User Industry 2025 & 2033
- Figure 17: Asia Pacific Extended Reality Display Industry Revenue Share (%), by End-User Industry 2025 & 2033
- Figure 18: Asia Pacific Extended Reality Display Industry Revenue (Million), by Country 2025 & 2033
- Figure 19: Asia Pacific Extended Reality Display Industry Revenue Share (%), by Country 2025 & 2033
- Figure 20: Rest of the World Extended Reality Display Industry Revenue (Million), by Display Type 2025 & 2033
- Figure 21: Rest of the World Extended Reality Display Industry Revenue Share (%), by Display Type 2025 & 2033
- Figure 22: Rest of the World Extended Reality Display Industry Revenue (Million), by End-User Industry 2025 & 2033
- Figure 23: Rest of the World Extended Reality Display Industry Revenue Share (%), by End-User Industry 2025 & 2033
- Figure 24: Rest of the World Extended Reality Display Industry Revenue (Million), by Country 2025 & 2033
- Figure 25: Rest of the World Extended Reality Display Industry Revenue Share (%), by Country 2025 & 2033
List of Tables
- Table 1: Global Extended Reality Display Industry Revenue Million Forecast, by Display Type 2020 & 2033
- Table 2: Global Extended Reality Display Industry Revenue Million Forecast, by End-User Industry 2020 & 2033
- Table 3: Global Extended Reality Display Industry Revenue Million Forecast, by Region 2020 & 2033
- Table 4: Global Extended Reality Display Industry Revenue Million Forecast, by Display Type 2020 & 2033
- Table 5: Global Extended Reality Display Industry Revenue Million Forecast, by End-User Industry 2020 & 2033
- Table 6: Global Extended Reality Display Industry Revenue Million Forecast, by Country 2020 & 2033
- Table 7: Global Extended Reality Display Industry Revenue Million Forecast, by Display Type 2020 & 2033
- Table 8: Global Extended Reality Display Industry Revenue Million Forecast, by End-User Industry 2020 & 2033
- Table 9: Global Extended Reality Display Industry Revenue Million Forecast, by Country 2020 & 2033
- Table 10: Global Extended Reality Display Industry Revenue Million Forecast, by Display Type 2020 & 2033
- Table 11: Global Extended Reality Display Industry Revenue Million Forecast, by End-User Industry 2020 & 2033
- Table 12: Global Extended Reality Display Industry Revenue Million Forecast, by Country 2020 & 2033
- Table 13: Global Extended Reality Display Industry Revenue Million Forecast, by Display Type 2020 & 2033
- Table 14: Global Extended Reality Display Industry Revenue Million Forecast, by End-User Industry 2020 & 2033
- Table 15: Global Extended Reality Display Industry Revenue Million Forecast, by Country 2020 & 2033
Frequently Asked Questions
1. What is the projected Compound Annual Growth Rate (CAGR) of the Extended Reality Display Industry?
The projected CAGR is approximately 46.06%.
2. Which companies are prominent players in the Extended Reality Display Industry?
Key companies in the market include LG Display Co Ltd, Realfiction Holding AB, eMagin Corporation, Samsung Electronics Co Ltd, SA Photonics Inc *List Not Exhaustive, Japan Display Inc, Seiko Epson Corporation, Plessey Company plc, Lumus Ltd, Kopin Corporation, BOE Technology Group Co Ltd, Sony Corporation.
3. What are the main segments of the Extended Reality Display Industry?
The market segments include Display Type, End-User Industry.
4. Can you provide details about the market size?
The market size is estimated to be USD 1.93 Million as of 2022.
5. What are some drivers contributing to market growth?
Rising Adoption of AR and VR Applications Across Multiple End-user Industries; Significant Technological Advancement Across Micros Displays Such as MicroLEDs.
6. What are the notable trends driving market growth?
Rising Adoption of AR and VR Applications Across Multiple End-User Industries.
7. Are there any restraints impacting market growth?
Complex Manufacturing Process Involved for the Production of Displays; Limited Content Available for the Extended Reality Wearables.
8. Can you provide examples of recent developments in the market?
July 2022 - Kopin received production orders totaling approximately USD 3.8 million for its new ultra-bright, full-color Brillian Active Matrix Liquid Crystal Display (AMLCD) used by helicopter pilots to display real-time flight and target information. The current orders have scheduled deliveries through the fourth quarter of 2023.
9. What pricing options are available for accessing the report?
Pricing options include single-user, multi-user, and enterprise licenses priced at USD 4750, USD 5250, and USD 8750 respectively.
10. Is the market size provided in terms of value or volume?
The market size is provided in terms of value, measured in Million.
11. Are there any specific market keywords associated with the report?
Yes, the market keyword associated with the report is "Extended Reality Display Industry," which aids in identifying and referencing the specific market segment covered.
12. How do I determine which pricing option suits my needs best?
The pricing options vary based on user requirements and access needs. Individual users may opt for single-user licenses, while businesses requiring broader access may choose multi-user or enterprise licenses for cost-effective access to the report.
13. Are there any additional resources or data provided in the Extended Reality Display Industry report?
While the report offers comprehensive insights, it's advisable to review the specific contents or supplementary materials provided to ascertain if additional resources or data are available.
14. How can I stay updated on further developments or reports in the Extended Reality Display Industry?
To stay informed about further developments, trends, and reports in the Extended Reality Display Industry, consider subscribing to industry newsletters, following relevant companies and organizations, or regularly checking reputable industry news sources and publications.
Methodology
Step 1 - Identification of Relevant Samples Size from Population Database


Step 2 - Approaches for Defining Global Market Size (Value, Volume* & Price*)

Note*: In applicable scenarios
Step 3 - Data Sources
Primary Research
- Web Analytics
- Survey Reports
- Research Institute
- Latest Research Reports
- Opinion Leaders
Secondary Research
- Annual Reports
- White Paper
- Latest Press Release
- Industry Association
- Paid Database
- Investor Presentations

Step 4 - Data Triangulation
Involves using different sources of information in order to increase the validity of a study
These sources are likely to be stakeholders in a program - participants, other researchers, program staff, other community members, and so on.
Then we put all data in single framework & apply various statistical tools to find out the dynamic on the market.
During the analysis stage, feedback from the stakeholder groups would be compared to determine areas of agreement as well as areas of divergence