
Key Insights
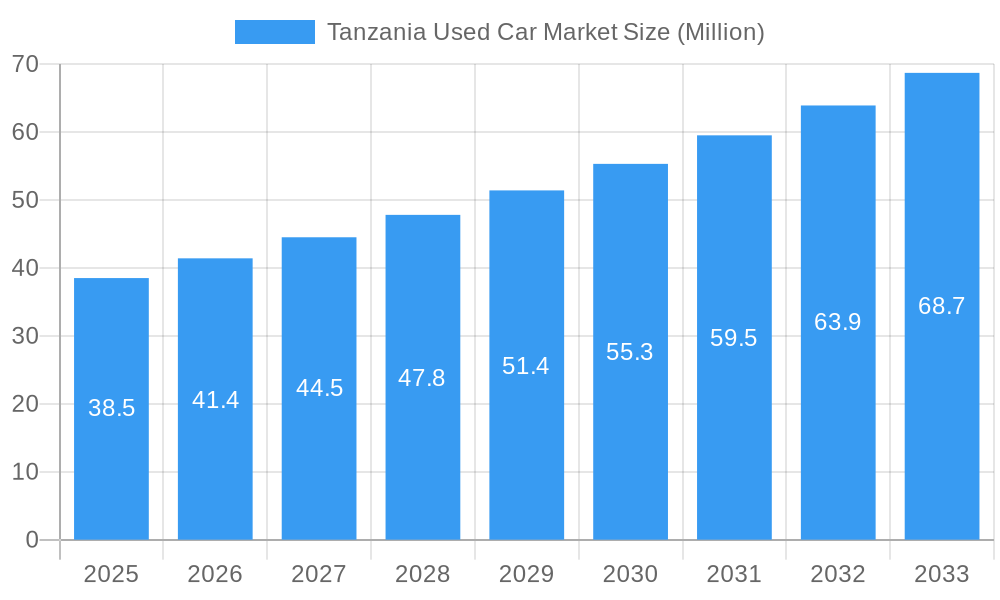
The Tanzania used car market, valued at $38.5 million in 2025, is projected to experience robust growth, exhibiting a Compound Annual Growth Rate (CAGR) of 7.65% from 2025 to 2033. This expansion is fueled by several key factors. Increasing urbanization and a burgeoning middle class are driving demand for personal transportation, with used cars offering a more affordable entry point compared to new vehicles. The rise of online marketplaces, such as those operated by Be Forward, Jiji, and UsedCars.co.tz, is further boosting market accessibility and transparency. While the dominance of informal sales channels (unorganized vendors) presents a challenge, the gradual formalization of the market through initiatives promoting vehicle inspection and certification is expected to contribute to growth. Furthermore, the diverse vehicle types available—ranging from hatchbacks and sedans to SUVs and MPVs—cater to a wide spectrum of consumer needs and budgets. The preference for fuel-efficient petrol and diesel vehicles remains strong, although the nascent electric vehicle segment holds potential for future expansion, contingent on improved infrastructure and government support. Competition among established players like Be Forward and emerging online platforms is intensifying, leading to innovative sales strategies and improved customer service.

Tanzania Used Car Market Market Size (In Million)
The market segmentation reveals a significant concentration in the used petrol and diesel vehicle segments, reflecting the current state of the Tanzanian automotive landscape. The growth trajectory suggests a continued preference for these fuel types in the foreseeable future, although the gradual introduction of electric and alternative fuel vehicles could alter this balance over the longer term. Geographical variations in demand may also exist, influenced by factors such as population density, income levels, and infrastructure development across different regions within Tanzania. Addressing challenges like the lack of standardized vehicle quality checks and ensuring consumer protection will be crucial for sustained and responsible market growth. The ongoing evolution of regulations and policies related to used vehicle imports and sales will significantly impact the market's development in the coming years. Opportunities exist for players who can successfully navigate these challenges and tap into the growing demand for affordable and reliable transportation in Tanzania.
Tanzania Used Car Market Company Market Share
Tanzania Used Car Market: A Comprehensive Report (2019-2033)
This dynamic report provides a deep dive into the thriving Tanzania used car market, offering invaluable insights for industry stakeholders, investors, and researchers. With a focus on market size, segmentation, competitive landscape, and future trends, this report covers the period from 2019 to 2033, using 2025 as the base year. We analyze key players like Be Forward, Enhance Auto, and SBT Japan, among others, to present a holistic view of this rapidly evolving market. Leveraging high-impact keywords like "Tanzania used car market," "used car imports Tanzania," and "Tanzania automotive market," this report ensures maximum visibility and relevance for industry professionals.
Tanzania Used Car Market Market Structure & Competitive Landscape
The Tanzania used car market exhibits a moderately fragmented structure, with a mix of organized and unorganized players. While larger companies like Be Forward and SBT Japan dominate the online B2C segment, a substantial portion of the market consists of smaller, independent dealers operating offline. The market's competitive intensity is driven by factors such as pricing strategies, vehicle quality, and customer service. Regulatory changes concerning vehicle imports and environmental standards have a significant influence on market dynamics. Product substitutes, primarily newer used vehicles from different regions, constantly pressure pricing.
- Market Concentration: The Herfindahl-Hirschman Index (HHI) for the organized segment is estimated at xx, indicating a moderately concentrated market.
- Innovation Drivers: Online platforms and improved logistics are key innovation drivers, enhancing transparency and accessibility.
- Regulatory Impacts: Import duties and environmental regulations significantly impact pricing and vehicle availability.
- Product Substitutes: The availability of newer models from other markets creates competitive pressure.
- End-User Segmentation: The market caters to a wide range of consumers, from individual buyers to businesses using vehicles for commercial purposes.
- M&A Trends: The M&A activity in the Tanzania used car market is relatively low (estimated xx deals in the last 5 years), largely driven by consolidation among online platforms.
Tanzania Used Car Market Market Trends & Opportunities
The Tanzania used car market is witnessing robust growth, driven by rising disposable incomes, increasing urbanization, and a preference for personal vehicles. The market size is projected to reach xx Million USD in 2025, with a compound annual growth rate (CAGR) of xx% during the forecast period (2025-2033). Technological advancements, such as online marketplaces and mobile payment options, are significantly impacting market penetration. Consumer preferences are shifting towards fuel-efficient vehicles and those with advanced safety features. The competitive landscape is characterized by both online and offline players, each vying for market share through various strategies. The increasing popularity of SUVs/MPVs presents a significant opportunity for market expansion. The government's initiatives to improve infrastructure further supports market growth. The shift toward electric vehicles remains nascent but presents a significant long-term opportunity.
Dominant Markets & Segments in Tanzania Used Car Market
The Dar es Salaam region dominates the Tanzania used car market due to its concentration of population and economic activity.
- By Vehicle Type: SUVs/MPVs constitute the largest segment, followed by sedans and hatchbacks.
- By Vendor Type: The organized sector is rapidly expanding, driven by online platforms offering greater transparency and reach. However, the unorganized sector remains significant.
- By Fuel Type: Petrol remains the dominant fuel type, although diesel vehicles are gaining traction. Electric vehicles have minimal market share.
- By Sales Channel: Online sales are growing rapidly, but offline sales remain substantial, especially in the unorganized sector.
Key Growth Drivers:
- Improving Infrastructure: Road network improvements and enhanced logistics facilitate easier vehicle transport and access.
- Government Policies: Favorable import regulations and financing schemes stimulate market growth.
- Rising Disposable Incomes: Increased purchasing power among the populace drives demand.
Tanzania Used Car Market Product Analysis
Technological advancements in vehicle diagnostics and online marketplaces are transforming the customer experience. Consumers now have greater access to information, allowing for better informed purchasing decisions. The increasing focus on fuel efficiency and safety features is shaping product preferences. The competitive advantage lies in providing a transparent and reliable platform, coupled with efficient after-sales service.
Key Drivers, Barriers & Challenges in Tanzania Used Car Market
Key Drivers: Rising disposable incomes, urbanization, and improved infrastructure are propelling market growth. Government initiatives to support the automotive sector further enhance market expansion.
Challenges & Restraints: High import duties and logistical challenges create barriers to entry for importers. The lack of comprehensive vehicle inspection and maintenance facilities contributes to concerns about vehicle quality. Competition from the unorganized sector also impacts the market. An estimated xx% increase in import costs due to logistical bottlenecks in 2022 hampered growth.
Growth Drivers in the Tanzania Used Car Market Market
Increased vehicle affordability due to competitive pricing and financing options are key drivers. Growing urbanization and improved road infrastructure are also key factors boosting demand for personal vehicles.
Challenges Impacting Tanzania Used Car Market Growth
High import taxes, the informal sector's significant role, and a lack of standardized vehicle quality assessments impede market development. Logistical challenges and limited access to financing pose significant barriers.
Key Players Shaping the Tanzania Used Car Market Market
- Be Forward
- Enhance Auto
- Jan Japan
- Bizupon
- SBT Japan
- Jiji
- CarTanzania
- SBI Motor Japan
- Car Junction Tanzania
- UsedCars co tz
- Garipesa
- Autorod
Significant Tanzania Used Car Market Industry Milestones
- November 2022: A 316% increase in used vehicle imports from Zimbabwe via Dar es Salaam port compared to 2016, reaching an estimated 15,000 vehicles annually.
- June 2021: SBT Japan announced its expansion into the C2C segment, complementing its existing B2C and B2B operations.
Future Outlook for Tanzania Used Car Market Market
The Tanzania used car market is poised for continued growth, driven by increasing affordability, infrastructure development, and evolving consumer preferences. The expansion of online marketplaces and the potential for electric vehicle adoption offer significant opportunities. However, addressing the challenges of regulatory complexities and supply chain issues will be crucial for sustainable market expansion.
Tanzania Used Car Market Segmentation
-
1. Vehicle Type
- 1.1. Hatchbacks
- 1.2. Sedans
- 1.3. Sports U
-
2. Vendor Type
- 2.1. Organized
- 2.2. Unorganized
-
3. Fuel Type
- 3.1. Petrol
- 3.2. Diesel
- 3.3. Electric
- 3.4. Other Fuel Types (LPG, CNG, etc.)
-
4. Sales Channel
- 4.1. Online
- 4.2. Offline
Tanzania Used Car Market Segmentation By Geography
- 1. Tanzania

Tanzania Used Car Market Regional Market Share
Geographic Coverage of Tanzania Used Car Market
Tanzania Used Car Market REPORT HIGHLIGHTS
| Aspects | Details |
|---|---|
| Study Period | 2020-2034 |
| Base Year | 2025 |
| Estimated Year | 2026 |
| Forecast Period | 2026-2034 |
| Historical Period | 2020-2025 |
| Growth Rate | CAGR of 7.65% from 2020-2034 |
| Segmentation |
|
Table of Contents
- 1. Introduction
- 1.1. Research Scope
- 1.2. Market Segmentation
- 1.3. Research Methodology
- 1.4. Definitions and Assumptions
- 2. Executive Summary
- 2.1. Introduction
- 3. Market Dynamics
- 3.1. Introduction
- 3.2. Market Drivers
- 3.2.1. Rising Adoption of Digital Technologies
- 3.3. Market Restrains
- 3.3.1. Increasing Fuel Prices to Hinder the Demand for Used Cars
- 3.4. Market Trends
- 3.4.1. Rising Adoption of Digital Technologies Will Foster the Growth of the Target Market
- 4. Market Factor Analysis
- 4.1. Porters Five Forces
- 4.2. Supply/Value Chain
- 4.3. PESTEL analysis
- 4.4. Market Entropy
- 4.5. Patent/Trademark Analysis
- 5. Tanzania Used Car Market Analysis, Insights and Forecast, 2020-2032
- 5.1. Market Analysis, Insights and Forecast - by Vehicle Type
- 5.1.1. Hatchbacks
- 5.1.2. Sedans
- 5.1.3. Sports U
- 5.2. Market Analysis, Insights and Forecast - by Vendor Type
- 5.2.1. Organized
- 5.2.2. Unorganized
- 5.3. Market Analysis, Insights and Forecast - by Fuel Type
- 5.3.1. Petrol
- 5.3.2. Diesel
- 5.3.3. Electric
- 5.3.4. Other Fuel Types (LPG, CNG, etc.)
- 5.4. Market Analysis, Insights and Forecast - by Sales Channel
- 5.4.1. Online
- 5.4.2. Offline
- 5.5. Market Analysis, Insights and Forecast - by Region
- 5.5.1. Tanzania
- 5.1. Market Analysis, Insights and Forecast - by Vehicle Type
- 6. Competitive Analysis
- 6.1. Market Share Analysis 2025
- 6.2. Company Profiles
- 6.2.1 Be Forward
- 6.2.1.1. Overview
- 6.2.1.2. Products
- 6.2.1.3. SWOT Analysis
- 6.2.1.4. Recent Developments
- 6.2.1.5. Financials (Based on Availability)
- 6.2.2 Enhance Auto
- 6.2.2.1. Overview
- 6.2.2.2. Products
- 6.2.2.3. SWOT Analysis
- 6.2.2.4. Recent Developments
- 6.2.2.5. Financials (Based on Availability)
- 6.2.3 Jan Japan
- 6.2.3.1. Overview
- 6.2.3.2. Products
- 6.2.3.3. SWOT Analysis
- 6.2.3.4. Recent Developments
- 6.2.3.5. Financials (Based on Availability)
- 6.2.4 Bizupon
- 6.2.4.1. Overview
- 6.2.4.2. Products
- 6.2.4.3. SWOT Analysis
- 6.2.4.4. Recent Developments
- 6.2.4.5. Financials (Based on Availability)
- 6.2.5 SBT Japan
- 6.2.5.1. Overview
- 6.2.5.2. Products
- 6.2.5.3. SWOT Analysis
- 6.2.5.4. Recent Developments
- 6.2.5.5. Financials (Based on Availability)
- 6.2.6 Jiji
- 6.2.6.1. Overview
- 6.2.6.2. Products
- 6.2.6.3. SWOT Analysis
- 6.2.6.4. Recent Developments
- 6.2.6.5. Financials (Based on Availability)
- 6.2.7 CarTanzania
- 6.2.7.1. Overview
- 6.2.7.2. Products
- 6.2.7.3. SWOT Analysis
- 6.2.7.4. Recent Developments
- 6.2.7.5. Financials (Based on Availability)
- 6.2.8 SBI Motor Japa
- 6.2.8.1. Overview
- 6.2.8.2. Products
- 6.2.8.3. SWOT Analysis
- 6.2.8.4. Recent Developments
- 6.2.8.5. Financials (Based on Availability)
- 6.2.9 Car Junction Tanzania
- 6.2.9.1. Overview
- 6.2.9.2. Products
- 6.2.9.3. SWOT Analysis
- 6.2.9.4. Recent Developments
- 6.2.9.5. Financials (Based on Availability)
- 6.2.10 UsedCars co tz
- 6.2.10.1. Overview
- 6.2.10.2. Products
- 6.2.10.3. SWOT Analysis
- 6.2.10.4. Recent Developments
- 6.2.10.5. Financials (Based on Availability)
- 6.2.11 Garipesa
- 6.2.11.1. Overview
- 6.2.11.2. Products
- 6.2.11.3. SWOT Analysis
- 6.2.11.4. Recent Developments
- 6.2.11.5. Financials (Based on Availability)
- 6.2.12 Autorod
- 6.2.12.1. Overview
- 6.2.12.2. Products
- 6.2.12.3. SWOT Analysis
- 6.2.12.4. Recent Developments
- 6.2.12.5. Financials (Based on Availability)
- 6.2.1 Be Forward
List of Figures
- Figure 1: Tanzania Used Car Market Revenue Breakdown (Million, %) by Product 2025 & 2033
- Figure 2: Tanzania Used Car Market Share (%) by Company 2025
List of Tables
- Table 1: Tanzania Used Car Market Revenue Million Forecast, by Region 2020 & 2033
- Table 2: Tanzania Used Car Market Revenue Million Forecast, by Vehicle Type 2020 & 2033
- Table 3: Tanzania Used Car Market Revenue Million Forecast, by Vendor Type 2020 & 2033
- Table 4: Tanzania Used Car Market Revenue Million Forecast, by Fuel Type 2020 & 2033
- Table 5: Tanzania Used Car Market Revenue Million Forecast, by Sales Channel 2020 & 2033
- Table 6: Tanzania Used Car Market Revenue Million Forecast, by Region 2020 & 2033
- Table 7: Tanzania Used Car Market Revenue Million Forecast, by Country 2020 & 2033
- Table 8: Tanzania Used Car Market Revenue Million Forecast, by Vehicle Type 2020 & 2033
- Table 9: Tanzania Used Car Market Revenue Million Forecast, by Vendor Type 2020 & 2033
- Table 10: Tanzania Used Car Market Revenue Million Forecast, by Fuel Type 2020 & 2033
- Table 11: Tanzania Used Car Market Revenue Million Forecast, by Sales Channel 2020 & 2033
- Table 12: Tanzania Used Car Market Revenue Million Forecast, by Country 2020 & 2033
Frequently Asked Questions
1. What is the projected Compound Annual Growth Rate (CAGR) of the Tanzania Used Car Market?
The projected CAGR is approximately 7.65%.
2. Which companies are prominent players in the Tanzania Used Car Market?
Key companies in the market include Be Forward, Enhance Auto, Jan Japan, Bizupon, SBT Japan, Jiji, CarTanzania, SBI Motor Japa, Car Junction Tanzania, UsedCars co tz, Garipesa, Autorod.
3. What are the main segments of the Tanzania Used Car Market?
The market segments include Vehicle Type, Vendor Type, Fuel Type, Sales Channel.
4. Can you provide details about the market size?
The market size is estimated to be USD 38.5 Million as of 2022.
5. What are some drivers contributing to market growth?
Rising Adoption of Digital Technologies.
6. What are the notable trends driving market growth?
Rising Adoption of Digital Technologies Will Foster the Growth of the Target Market.
7. Are there any restraints impacting market growth?
Increasing Fuel Prices to Hinder the Demand for Used Cars.
8. Can you provide examples of recent developments in the market?
November 2022: The Dar Es Salaam port in Tanzania witnessed a remarkable annual increase of 316% in the importation of both new and used vehicles by Zimbabweans in 2022, compared to the figures recorded in 2016. As of November 2022, it was estimated that approximately 15,000 vehicles were being imported annually by Zimbabweans through this port, a significant surge from the mere 3,600 vehicles in 2016. This substantial shift in preference towards Dar Es Salaam port for shipments by Zimbabwe's used car dealers can be attributed to challenges in the South African ports' logistical operations.
9. What pricing options are available for accessing the report?
Pricing options include single-user, multi-user, and enterprise licenses priced at USD 3800, USD 4500, and USD 5800 respectively.
10. Is the market size provided in terms of value or volume?
The market size is provided in terms of value, measured in Million.
11. Are there any specific market keywords associated with the report?
Yes, the market keyword associated with the report is "Tanzania Used Car Market," which aids in identifying and referencing the specific market segment covered.
12. How do I determine which pricing option suits my needs best?
The pricing options vary based on user requirements and access needs. Individual users may opt for single-user licenses, while businesses requiring broader access may choose multi-user or enterprise licenses for cost-effective access to the report.
13. Are there any additional resources or data provided in the Tanzania Used Car Market report?
While the report offers comprehensive insights, it's advisable to review the specific contents or supplementary materials provided to ascertain if additional resources or data are available.
14. How can I stay updated on further developments or reports in the Tanzania Used Car Market?
To stay informed about further developments, trends, and reports in the Tanzania Used Car Market, consider subscribing to industry newsletters, following relevant companies and organizations, or regularly checking reputable industry news sources and publications.
Methodology
Step 1 - Identification of Relevant Samples Size from Population Database


Step 2 - Approaches for Defining Global Market Size (Value, Volume* & Price*)

Note*: In applicable scenarios
Step 3 - Data Sources
Primary Research
- Web Analytics
- Survey Reports
- Research Institute
- Latest Research Reports
- Opinion Leaders
Secondary Research
- Annual Reports
- White Paper
- Latest Press Release
- Industry Association
- Paid Database
- Investor Presentations

Step 4 - Data Triangulation
Involves using different sources of information in order to increase the validity of a study
These sources are likely to be stakeholders in a program - participants, other researchers, program staff, other community members, and so on.
Then we put all data in single framework & apply various statistical tools to find out the dynamic on the market.
During the analysis stage, feedback from the stakeholder groups would be compared to determine areas of agreement as well as areas of divergence
