

Key Insights
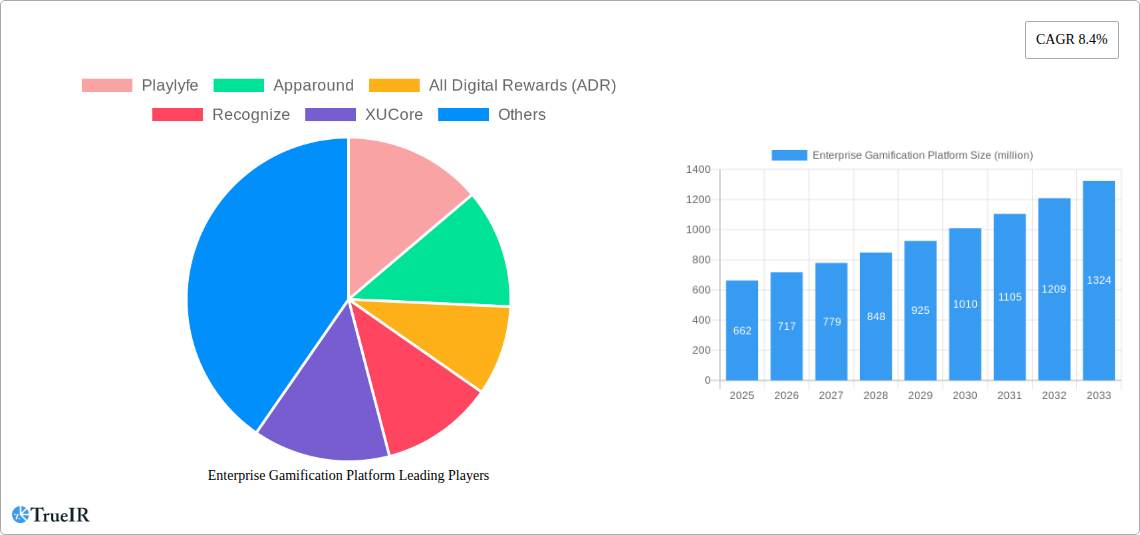
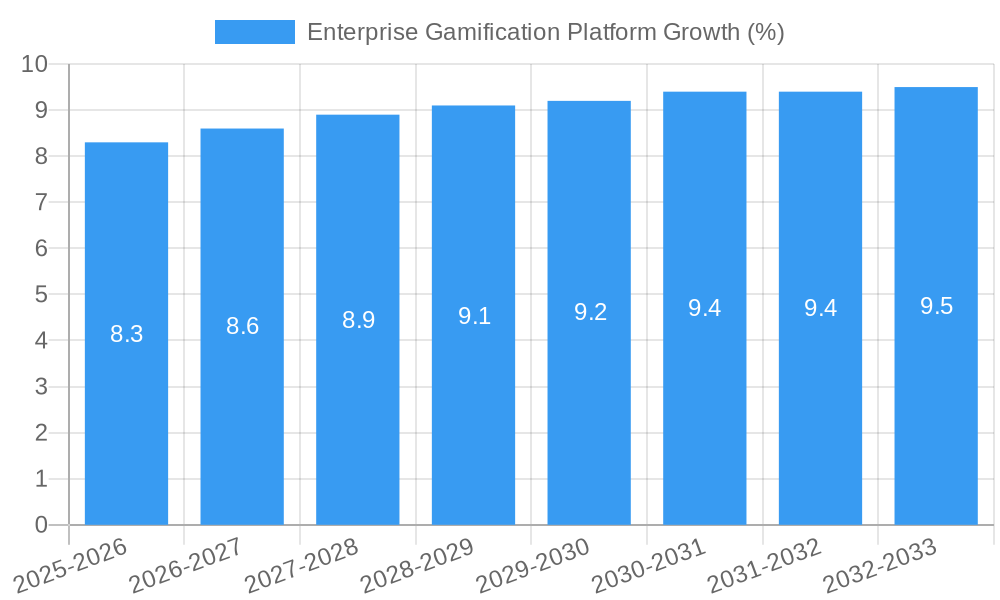
The global Enterprise Gamification Platform market is poised for significant expansion, projected to reach an estimated value of $662 million by 2025. This robust growth is underpinned by a projected Compound Annual Growth Rate (CAGR) of 8.4% throughout the forecast period of 2025-2033. A primary driver for this upward trajectory is the increasing adoption of gamification strategies by businesses of all sizes to enhance employee engagement, productivity, and skill development. SMEs, in particular, are leveraging these platforms to foster a more dynamic and rewarding work environment, while large enterprises are integrating them into their comprehensive talent management and training programs. The shift towards cloud-based and web-based solutions further accelerates this growth, offering greater accessibility, scalability, and cost-effectiveness for businesses seeking to implement gamified initiatives.
Key trends shaping the enterprise gamification landscape include the integration of AI and machine learning to personalize user experiences and provide actionable insights, the growing demand for platforms that support remote and hybrid workforces, and the focus on gamification for specific use cases such as sales enablement, customer service training, and compliance adherence. While the market benefits from strong demand and technological advancements, potential restraints include the initial cost of implementation, the need for clear ROI demonstration, and challenges in designing truly engaging and effective gamification strategies that avoid superficial application. Nonetheless, the overwhelming benefits in terms of improved employee morale, reduced attrition, and enhanced performance are expected to outweigh these challenges, driving sustained market dominance for enterprise gamification platforms.
Enterprise Gamification Platform Market Research Report: 2019-2033
This comprehensive report delves into the dynamic Enterprise Gamification Platform market, providing in-depth analysis and actionable insights for stakeholders. The study spans the historical period from 2019 to 2024, with a base year of 2025 and a forecast period extending to 2033, offering a robust outlook on market evolution.
Enterprise Gamification Platform Market Structure & Competitive Landscape
The Enterprise Gamification Platform market exhibits a moderately concentrated structure, with a blend of established players and emerging innovators. Key innovation drivers include the increasing demand for enhanced employee engagement, improved sales performance, and robust customer loyalty programs. Regulatory impacts are generally minimal, primarily focusing on data privacy and security, which are addressed by leading platforms. Product substitutes, such as traditional training methods and non-gamified engagement tools, are present but are increasingly being overshadowed by the superior ROI and engagement levels offered by gamified solutions. End-user segmentation reveals a strong adoption across both SMEs and Large Enterprises, each leveraging gamification for distinct objectives. Merger and acquisition (M&A) trends are evident, with approximately 15 significant M&A activities recorded in the historical period, aimed at consolidating market share and expanding technological capabilities. Leading companies like Playlyfe and Apparound are actively involved in strategic partnerships to broaden their service offerings.
Enterprise Gamification Platform Market Trends & Opportunities
The global Enterprise Gamification Platform market is poised for substantial expansion, projected to witness a Compound Annual Growth Rate (CAGR) of xx% between 2025 and 2033. This impressive growth is fueled by a paradigm shift in how businesses approach employee motivation, customer engagement, and learning and development. The market size is anticipated to reach over one million dollars by the end of the forecast period. Technological advancements, particularly in AI-driven personalization and immersive AR/VR experiences, are revolutionizing platform capabilities, moving beyond simple points and badges to sophisticated, data-driven engagement strategies. Consumer preferences are increasingly leaning towards interactive and rewarding digital experiences, directly translating into higher adoption rates for gamified solutions in the enterprise. Competitive dynamics are intensifying, with a notable trend towards platform specialization and the integration of gamification with other enterprise software solutions like CRM and HRIS. The market penetration rate for enterprise gamification is expected to surge as more organizations recognize its tangible benefits in boosting productivity by an estimated xx% and reducing employee turnover by an estimated xx%. The growing reliance on remote and hybrid work models further amplifies the need for engaging and motivating digital tools, presenting a significant opportunity for cloud-based enterprise gamification platforms. The rising adoption of gamification in sectors like sales enablement, onboarding, and compliance training underscores its versatility and broad applicability. Emerging opportunities lie in the development of advanced analytics to measure and optimize gamification ROI, as well as in niche industry-specific gamification solutions.
Dominant Markets & Segments in Enterprise Gamification Platform
Leading Application Segment: Large Enterprises
Large Enterprises represent the dominant application segment within the Enterprise Gamification Platform market, accounting for over sixty percent of the market share in 2025. This dominance is driven by their greater budgetary allocations for employee engagement, training, and customer loyalty initiatives, as well as the complexity of their organizational structures that benefit significantly from structured, gamified approaches to management and motivation.
- Key Growth Drivers in Large Enterprises:
- Scalability and Customization: Large enterprises require platforms that can scale to accommodate vast workforces and offer deep customization options to align with specific corporate cultures and business objectives.
- Complex Training and Onboarding Needs: The sheer volume of employees requiring training and onboarding in large organizations makes gamified solutions highly effective for engagement and knowledge retention.
- Sales Performance Optimization: Gamification is extensively used to drive sales performance through leaderboards, rewards, and competitive challenges, a critical focus for large sales teams.
- Employee Retention and Culture Building: Large companies invest heavily in fostering a positive work environment and retaining talent, areas where gamification proves instrumental in boosting morale and engagement.
Dominant Type: Cloud-Based Platforms
Cloud-Based Enterprise Gamification Platforms are leading the market, driven by their inherent advantages in accessibility, scalability, and cost-effectiveness. Over seventy percent of the market is captured by cloud solutions in 2025, with this share projected to grow.
- Key Growth Drivers for Cloud-Based Platforms:
- Flexibility and Accessibility: Cloud-based solutions allow for seamless access from any device, anywhere, which is crucial for distributed workforces and mobile employees.
- Lower Implementation Costs and Faster Deployment: Compared to on-premise solutions, cloud platforms require minimal IT infrastructure investment and can be deployed rapidly, appealing to both SMEs and large enterprises.
- Automatic Updates and Maintenance: Vendors manage updates and maintenance, freeing up IT resources within client organizations and ensuring access to the latest features.
- Subscription-Based Revenue Models: The subscription model makes enterprise gamification more accessible and predictable from a budgeting perspective.
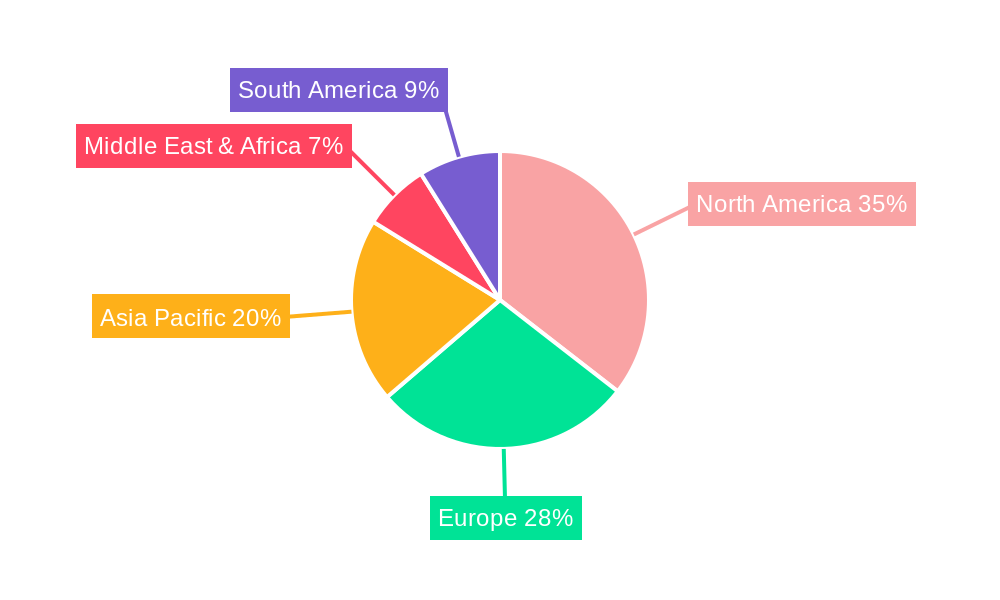
Leading Country/Region:
North America currently dominates the Enterprise Gamification Platform market, with the United States being the primary contributor. This leadership is attributed to a mature business environment, early adoption of innovative technologies, and a strong emphasis on employee engagement and performance management within its corporate landscape.
Enterprise Gamification Platform Product Analysis
Enterprise Gamification Platforms are evolving rapidly, moving beyond basic point systems to sophisticated, AI-powered engines that personalize user experiences and drive specific business outcomes. Innovations include adaptive learning modules, real-time performance feedback loops, and integration with existing enterprise systems for seamless data flow. Competitive advantages lie in platforms that offer robust analytics, highly customizable reward structures, and compelling user interfaces designed for maximum engagement and minimal friction. Technological advancements are focusing on predictive analytics to anticipate engagement needs and behavioral nudges to guide users towards desired actions, such as improved customer service or sales productivity.
Key Drivers, Barriers & Challenges in Enterprise Gamification Platform
Key Drivers:
The Enterprise Gamification Platform market is propelled by several key drivers. Technologically, the increasing sophistication of AI and machine learning enables more personalized and effective gamified experiences. Economically, the proven ROI in terms of increased productivity, improved employee retention (estimated to reduce turnover by xx%), and enhanced customer loyalty is a significant motivator. Policy-driven factors, such as the growing emphasis on employee well-being and development in corporate strategies, also contribute positively.
Barriers & Challenges:
Despite its growth, the market faces challenges. Implementation complexity and the need for expert strategy to design effective gamified systems can be a barrier for some organizations. A lack of clear understanding of gamification’s ROI, or poorly designed implementations, can lead to user disengagement and perceived ineffectiveness. Supply chain issues are generally not a concern for software-based platforms, but regulatory hurdles related to data privacy and security (e.g., GDPR, CCPA) require careful consideration and compliance by platform providers. Competitive pressures from both established players and new entrants demand continuous innovation and value differentiation.
Growth Drivers in the Enterprise Gamification Platform Market
Key growth drivers for the Enterprise Gamification Platform market include the escalating demand for enhanced employee engagement and productivity, particularly in remote and hybrid work environments. Technological advancements in AI and data analytics are enabling more personalized and impactful gamified experiences. Economically, the clear return on investment demonstrated by gamification in areas like sales enablement, customer loyalty, and employee training is a significant catalyst. Regulatory shifts promoting employee development and well-being indirectly fuel the adoption of tools that foster a more engaging and motivating workplace.
Challenges Impacting Enterprise Gamification Platform Growth
Challenges impacting Enterprise Gamification Platform growth include the potential for poorly designed implementations that can lead to user fatigue or disengagement, thus diminishing perceived value. While direct supply chain issues are minimal for software, the reliance on robust IT infrastructure and internet connectivity for cloud-based platforms can be a constraint in certain regions. Competitive pressures are intense, requiring continuous innovation and differentiation. Furthermore, a perceived lack of quantifiable ROI or the inability to integrate gamification effectively into existing business processes can act as significant barriers for adoption by hesitant organizations.
Key Players Shaping the Enterprise Gamification Platform Market
- Playlyfe
- Apparound
- All Digital Rewards (ADR)
- Recognize
- XUCore
- Bizbee
- Bravon
- Tremendous
- Atta
- Ambition
- Badgeville
- BankersLab
- BigDoor
- Bunchball
- CustomerAdvocacy
- Hoopla
- Belly
- Mambo.IO
Significant Enterprise Gamification Platform Industry Milestones
- 2019: Increased integration of gamification with CRM and HRIS systems, enhancing data-driven engagement.
- 2020: Surge in demand for remote employee engagement solutions, boosting cloud-based gamification platforms.
- 2021: Introduction of AI-powered personalization in gamified learning modules.
- 2022: Growing emphasis on gamification for customer loyalty and advocacy programs.
- 2023: Expansion of gamified solutions into sales enablement and performance coaching.
- 2024: Emergence of AR/VR integrated gamification experiences for immersive training.
- 2025 (Estimated): Greater focus on measurable ROI and advanced analytics for gamification strategies.
- 2026-2033 (Forecast): Continued innovation in behavioral economics integration and hyper-personalization.
Future Outlook for Enterprise Gamification Platform Market
The future outlook for the Enterprise Gamification Platform market is exceptionally bright, with strategic opportunities centered around hyper-personalization, AI-driven predictive engagement, and seamless integration across the entire enterprise technology stack. Market potential lies in further developing solutions for niche industry applications and addressing the evolving needs of a global, distributed workforce. The continuous drive for improved employee experience, enhanced customer lifetime value, and optimized business performance will undoubtedly fuel sustained growth and innovation in this dynamic sector. Anticipate a move towards more sophisticated, data-backed gamification strategies that deliver tangible and measurable business outcomes.
Enterprise Gamification Platform Segmentation
-
1. Application
- 1.1. SMEs
- 1.2. Large Enterprises
-
2. Types
- 2.1. Cloud Based
- 2.2. Web Based
Enterprise Gamification Platform Segmentation By Geography
-
1. North America
- 1.1. United States
- 1.2. Canada
- 1.3. Mexico
-
2. South America
- 2.1. Brazil
- 2.2. Argentina
- 2.3. Rest of South America
-
3. Europe
- 3.1. United Kingdom
- 3.2. Germany
- 3.3. France
- 3.4. Italy
- 3.5. Spain
- 3.6. Russia
- 3.7. Benelux
- 3.8. Nordics
- 3.9. Rest of Europe
-
4. Middle East & Africa
- 4.1. Turkey
- 4.2. Israel
- 4.3. GCC
- 4.4. North Africa
- 4.5. South Africa
- 4.6. Rest of Middle East & Africa
-
5. Asia Pacific
- 5.1. China
- 5.2. India
- 5.3. Japan
- 5.4. South Korea
- 5.5. ASEAN
- 5.6. Oceania
- 5.7. Rest of Asia Pacific
Enterprise Gamification Platform REPORT HIGHLIGHTS
| Aspects | Details |
|---|---|
| Study Period | 2019-2033 |
| Base Year | 2024 |
| Estimated Year | 2025 |
| Forecast Period | 2025-2033 |
| Historical Period | 2019-2024 |
| Growth Rate | CAGR of 8.4% from 2019-2033 |
| Segmentation |
|
Table of Contents
- 1. Introduction
- 1.1. Research Scope
- 1.2. Market Segmentation
- 1.3. Research Methodology
- 1.4. Definitions and Assumptions
- 2. Executive Summary
- 2.1. Introduction
- 3. Market Dynamics
- 3.1. Introduction
- 3.2. Market Drivers
- 3.3. Market Restrains
- 3.4. Market Trends
- 4. Market Factor Analysis
- 4.1. Porters Five Forces
- 4.2. Supply/Value Chain
- 4.3. PESTEL analysis
- 4.4. Market Entropy
- 4.5. Patent/Trademark Analysis
- 5. Global Enterprise Gamification Platform Analysis, Insights and Forecast, 2019-2031
- 5.1. Market Analysis, Insights and Forecast - by Application
- 5.1.1. SMEs
- 5.1.2. Large Enterprises
- 5.2. Market Analysis, Insights and Forecast - by Types
- 5.2.1. Cloud Based
- 5.2.2. Web Based
- 5.3. Market Analysis, Insights and Forecast - by Region
- 5.3.1. North America
- 5.3.2. South America
- 5.3.3. Europe
- 5.3.4. Middle East & Africa
- 5.3.5. Asia Pacific
- 5.1. Market Analysis, Insights and Forecast - by Application
- 6. North America Enterprise Gamification Platform Analysis, Insights and Forecast, 2019-2031
- 6.1. Market Analysis, Insights and Forecast - by Application
- 6.1.1. SMEs
- 6.1.2. Large Enterprises
- 6.2. Market Analysis, Insights and Forecast - by Types
- 6.2.1. Cloud Based
- 6.2.2. Web Based
- 6.1. Market Analysis, Insights and Forecast - by Application
- 7. South America Enterprise Gamification Platform Analysis, Insights and Forecast, 2019-2031
- 7.1. Market Analysis, Insights and Forecast - by Application
- 7.1.1. SMEs
- 7.1.2. Large Enterprises
- 7.2. Market Analysis, Insights and Forecast - by Types
- 7.2.1. Cloud Based
- 7.2.2. Web Based
- 7.1. Market Analysis, Insights and Forecast - by Application
- 8. Europe Enterprise Gamification Platform Analysis, Insights and Forecast, 2019-2031
- 8.1. Market Analysis, Insights and Forecast - by Application
- 8.1.1. SMEs
- 8.1.2. Large Enterprises
- 8.2. Market Analysis, Insights and Forecast - by Types
- 8.2.1. Cloud Based
- 8.2.2. Web Based
- 8.1. Market Analysis, Insights and Forecast - by Application
- 9. Middle East & Africa Enterprise Gamification Platform Analysis, Insights and Forecast, 2019-2031
- 9.1. Market Analysis, Insights and Forecast - by Application
- 9.1.1. SMEs
- 9.1.2. Large Enterprises
- 9.2. Market Analysis, Insights and Forecast - by Types
- 9.2.1. Cloud Based
- 9.2.2. Web Based
- 9.1. Market Analysis, Insights and Forecast - by Application
- 10. Asia Pacific Enterprise Gamification Platform Analysis, Insights and Forecast, 2019-2031
- 10.1. Market Analysis, Insights and Forecast - by Application
- 10.1.1. SMEs
- 10.1.2. Large Enterprises
- 10.2. Market Analysis, Insights and Forecast - by Types
- 10.2.1. Cloud Based
- 10.2.2. Web Based
- 10.1. Market Analysis, Insights and Forecast - by Application
- 11. Competitive Analysis
- 11.1. Global Market Share Analysis 2024
- 11.2. Company Profiles
- 11.2.1 Playlyfe
- 11.2.1.1. Overview
- 11.2.1.2. Products
- 11.2.1.3. SWOT Analysis
- 11.2.1.4. Recent Developments
- 11.2.1.5. Financials (Based on Availability)
- 11.2.2 Apparound
- 11.2.2.1. Overview
- 11.2.2.2. Products
- 11.2.2.3. SWOT Analysis
- 11.2.2.4. Recent Developments
- 11.2.2.5. Financials (Based on Availability)
- 11.2.3 All Digital Rewards (ADR)
- 11.2.3.1. Overview
- 11.2.3.2. Products
- 11.2.3.3. SWOT Analysis
- 11.2.3.4. Recent Developments
- 11.2.3.5. Financials (Based on Availability)
- 11.2.4 Recognize
- 11.2.4.1. Overview
- 11.2.4.2. Products
- 11.2.4.3. SWOT Analysis
- 11.2.4.4. Recent Developments
- 11.2.4.5. Financials (Based on Availability)
- 11.2.5 XUCore
- 11.2.5.1. Overview
- 11.2.5.2. Products
- 11.2.5.3. SWOT Analysis
- 11.2.5.4. Recent Developments
- 11.2.5.5. Financials (Based on Availability)
- 11.2.6 Bizbee
- 11.2.6.1. Overview
- 11.2.6.2. Products
- 11.2.6.3. SWOT Analysis
- 11.2.6.4. Recent Developments
- 11.2.6.5. Financials (Based on Availability)
- 11.2.7 Bravon
- 11.2.7.1. Overview
- 11.2.7.2. Products
- 11.2.7.3. SWOT Analysis
- 11.2.7.4. Recent Developments
- 11.2.7.5. Financials (Based on Availability)
- 11.2.8 Tremendous
- 11.2.8.1. Overview
- 11.2.8.2. Products
- 11.2.8.3. SWOT Analysis
- 11.2.8.4. Recent Developments
- 11.2.8.5. Financials (Based on Availability)
- 11.2.9 Atta
- 11.2.9.1. Overview
- 11.2.9.2. Products
- 11.2.9.3. SWOT Analysis
- 11.2.9.4. Recent Developments
- 11.2.9.5. Financials (Based on Availability)
- 11.2.10 Ambition
- 11.2.10.1. Overview
- 11.2.10.2. Products
- 11.2.10.3. SWOT Analysis
- 11.2.10.4. Recent Developments
- 11.2.10.5. Financials (Based on Availability)
- 11.2.11 Badgeville
- 11.2.11.1. Overview
- 11.2.11.2. Products
- 11.2.11.3. SWOT Analysis
- 11.2.11.4. Recent Developments
- 11.2.11.5. Financials (Based on Availability)
- 11.2.12 BankersLab
- 11.2.12.1. Overview
- 11.2.12.2. Products
- 11.2.12.3. SWOT Analysis
- 11.2.12.4. Recent Developments
- 11.2.12.5. Financials (Based on Availability)
- 11.2.13 BigDoor
- 11.2.13.1. Overview
- 11.2.13.2. Products
- 11.2.13.3. SWOT Analysis
- 11.2.13.4. Recent Developments
- 11.2.13.5. Financials (Based on Availability)
- 11.2.14 Bunchball
- 11.2.14.1. Overview
- 11.2.14.2. Products
- 11.2.14.3. SWOT Analysis
- 11.2.14.4. Recent Developments
- 11.2.14.5. Financials (Based on Availability)
- 11.2.15 CustomerAdvocacy
- 11.2.15.1. Overview
- 11.2.15.2. Products
- 11.2.15.3. SWOT Analysis
- 11.2.15.4. Recent Developments
- 11.2.15.5. Financials (Based on Availability)
- 11.2.16 Hoopla
- 11.2.16.1. Overview
- 11.2.16.2. Products
- 11.2.16.3. SWOT Analysis
- 11.2.16.4. Recent Developments
- 11.2.16.5. Financials (Based on Availability)
- 11.2.17 Belly
- 11.2.17.1. Overview
- 11.2.17.2. Products
- 11.2.17.3. SWOT Analysis
- 11.2.17.4. Recent Developments
- 11.2.17.5. Financials (Based on Availability)
- 11.2.18 Mambo.IO
- 11.2.18.1. Overview
- 11.2.18.2. Products
- 11.2.18.3. SWOT Analysis
- 11.2.18.4. Recent Developments
- 11.2.18.5. Financials (Based on Availability)
- 11.2.1 Playlyfe
List of Figures
- Figure 1: Global Enterprise Gamification Platform Revenue Breakdown (million, %) by Region 2024 & 2032
- Figure 2: North America Enterprise Gamification Platform Revenue (million), by Application 2024 & 2032
- Figure 3: North America Enterprise Gamification Platform Revenue Share (%), by Application 2024 & 2032
- Figure 4: North America Enterprise Gamification Platform Revenue (million), by Types 2024 & 2032
- Figure 5: North America Enterprise Gamification Platform Revenue Share (%), by Types 2024 & 2032
- Figure 6: North America Enterprise Gamification Platform Revenue (million), by Country 2024 & 2032
- Figure 7: North America Enterprise Gamification Platform Revenue Share (%), by Country 2024 & 2032
- Figure 8: South America Enterprise Gamification Platform Revenue (million), by Application 2024 & 2032
- Figure 9: South America Enterprise Gamification Platform Revenue Share (%), by Application 2024 & 2032
- Figure 10: South America Enterprise Gamification Platform Revenue (million), by Types 2024 & 2032
- Figure 11: South America Enterprise Gamification Platform Revenue Share (%), by Types 2024 & 2032
- Figure 12: South America Enterprise Gamification Platform Revenue (million), by Country 2024 & 2032
- Figure 13: South America Enterprise Gamification Platform Revenue Share (%), by Country 2024 & 2032
- Figure 14: Europe Enterprise Gamification Platform Revenue (million), by Application 2024 & 2032
- Figure 15: Europe Enterprise Gamification Platform Revenue Share (%), by Application 2024 & 2032
- Figure 16: Europe Enterprise Gamification Platform Revenue (million), by Types 2024 & 2032
- Figure 17: Europe Enterprise Gamification Platform Revenue Share (%), by Types 2024 & 2032
- Figure 18: Europe Enterprise Gamification Platform Revenue (million), by Country 2024 & 2032
- Figure 19: Europe Enterprise Gamification Platform Revenue Share (%), by Country 2024 & 2032
- Figure 20: Middle East & Africa Enterprise Gamification Platform Revenue (million), by Application 2024 & 2032
- Figure 21: Middle East & Africa Enterprise Gamification Platform Revenue Share (%), by Application 2024 & 2032
- Figure 22: Middle East & Africa Enterprise Gamification Platform Revenue (million), by Types 2024 & 2032
- Figure 23: Middle East & Africa Enterprise Gamification Platform Revenue Share (%), by Types 2024 & 2032
- Figure 24: Middle East & Africa Enterprise Gamification Platform Revenue (million), by Country 2024 & 2032
- Figure 25: Middle East & Africa Enterprise Gamification Platform Revenue Share (%), by Country 2024 & 2032
- Figure 26: Asia Pacific Enterprise Gamification Platform Revenue (million), by Application 2024 & 2032
- Figure 27: Asia Pacific Enterprise Gamification Platform Revenue Share (%), by Application 2024 & 2032
- Figure 28: Asia Pacific Enterprise Gamification Platform Revenue (million), by Types 2024 & 2032
- Figure 29: Asia Pacific Enterprise Gamification Platform Revenue Share (%), by Types 2024 & 2032
- Figure 30: Asia Pacific Enterprise Gamification Platform Revenue (million), by Country 2024 & 2032
- Figure 31: Asia Pacific Enterprise Gamification Platform Revenue Share (%), by Country 2024 & 2032
List of Tables
- Table 1: Global Enterprise Gamification Platform Revenue million Forecast, by Region 2019 & 2032
- Table 2: Global Enterprise Gamification Platform Revenue million Forecast, by Application 2019 & 2032
- Table 3: Global Enterprise Gamification Platform Revenue million Forecast, by Types 2019 & 2032
- Table 4: Global Enterprise Gamification Platform Revenue million Forecast, by Region 2019 & 2032
- Table 5: Global Enterprise Gamification Platform Revenue million Forecast, by Application 2019 & 2032
- Table 6: Global Enterprise Gamification Platform Revenue million Forecast, by Types 2019 & 2032
- Table 7: Global Enterprise Gamification Platform Revenue million Forecast, by Country 2019 & 2032
- Table 8: United States Enterprise Gamification Platform Revenue (million) Forecast, by Application 2019 & 2032
- Table 9: Canada Enterprise Gamification Platform Revenue (million) Forecast, by Application 2019 & 2032
- Table 10: Mexico Enterprise Gamification Platform Revenue (million) Forecast, by Application 2019 & 2032
- Table 11: Global Enterprise Gamification Platform Revenue million Forecast, by Application 2019 & 2032
- Table 12: Global Enterprise Gamification Platform Revenue million Forecast, by Types 2019 & 2032
- Table 13: Global Enterprise Gamification Platform Revenue million Forecast, by Country 2019 & 2032
- Table 14: Brazil Enterprise Gamification Platform Revenue (million) Forecast, by Application 2019 & 2032
- Table 15: Argentina Enterprise Gamification Platform Revenue (million) Forecast, by Application 2019 & 2032
- Table 16: Rest of South America Enterprise Gamification Platform Revenue (million) Forecast, by Application 2019 & 2032
- Table 17: Global Enterprise Gamification Platform Revenue million Forecast, by Application 2019 & 2032
- Table 18: Global Enterprise Gamification Platform Revenue million Forecast, by Types 2019 & 2032
- Table 19: Global Enterprise Gamification Platform Revenue million Forecast, by Country 2019 & 2032
- Table 20: United Kingdom Enterprise Gamification Platform Revenue (million) Forecast, by Application 2019 & 2032
- Table 21: Germany Enterprise Gamification Platform Revenue (million) Forecast, by Application 2019 & 2032
- Table 22: France Enterprise Gamification Platform Revenue (million) Forecast, by Application 2019 & 2032
- Table 23: Italy Enterprise Gamification Platform Revenue (million) Forecast, by Application 2019 & 2032
- Table 24: Spain Enterprise Gamification Platform Revenue (million) Forecast, by Application 2019 & 2032
- Table 25: Russia Enterprise Gamification Platform Revenue (million) Forecast, by Application 2019 & 2032
- Table 26: Benelux Enterprise Gamification Platform Revenue (million) Forecast, by Application 2019 & 2032
- Table 27: Nordics Enterprise Gamification Platform Revenue (million) Forecast, by Application 2019 & 2032
- Table 28: Rest of Europe Enterprise Gamification Platform Revenue (million) Forecast, by Application 2019 & 2032
- Table 29: Global Enterprise Gamification Platform Revenue million Forecast, by Application 2019 & 2032
- Table 30: Global Enterprise Gamification Platform Revenue million Forecast, by Types 2019 & 2032
- Table 31: Global Enterprise Gamification Platform Revenue million Forecast, by Country 2019 & 2032
- Table 32: Turkey Enterprise Gamification Platform Revenue (million) Forecast, by Application 2019 & 2032
- Table 33: Israel Enterprise Gamification Platform Revenue (million) Forecast, by Application 2019 & 2032
- Table 34: GCC Enterprise Gamification Platform Revenue (million) Forecast, by Application 2019 & 2032
- Table 35: North Africa Enterprise Gamification Platform Revenue (million) Forecast, by Application 2019 & 2032
- Table 36: South Africa Enterprise Gamification Platform Revenue (million) Forecast, by Application 2019 & 2032
- Table 37: Rest of Middle East & Africa Enterprise Gamification Platform Revenue (million) Forecast, by Application 2019 & 2032
- Table 38: Global Enterprise Gamification Platform Revenue million Forecast, by Application 2019 & 2032
- Table 39: Global Enterprise Gamification Platform Revenue million Forecast, by Types 2019 & 2032
- Table 40: Global Enterprise Gamification Platform Revenue million Forecast, by Country 2019 & 2032
- Table 41: China Enterprise Gamification Platform Revenue (million) Forecast, by Application 2019 & 2032
- Table 42: India Enterprise Gamification Platform Revenue (million) Forecast, by Application 2019 & 2032
- Table 43: Japan Enterprise Gamification Platform Revenue (million) Forecast, by Application 2019 & 2032
- Table 44: South Korea Enterprise Gamification Platform Revenue (million) Forecast, by Application 2019 & 2032
- Table 45: ASEAN Enterprise Gamification Platform Revenue (million) Forecast, by Application 2019 & 2032
- Table 46: Oceania Enterprise Gamification Platform Revenue (million) Forecast, by Application 2019 & 2032
- Table 47: Rest of Asia Pacific Enterprise Gamification Platform Revenue (million) Forecast, by Application 2019 & 2032
Frequently Asked Questions
1. What is the projected Compound Annual Growth Rate (CAGR) of the Enterprise Gamification Platform?
The projected CAGR is approximately 8.4%.
2. Which companies are prominent players in the Enterprise Gamification Platform?
Key companies in the market include Playlyfe, Apparound, All Digital Rewards (ADR), Recognize, XUCore, Bizbee, Bravon, Tremendous, Atta, Ambition, Badgeville, BankersLab, BigDoor, Bunchball, CustomerAdvocacy, Hoopla, Belly, Mambo.IO.
3. What are the main segments of the Enterprise Gamification Platform?
The market segments include Application, Types.
4. Can you provide details about the market size?
The market size is estimated to be USD 662 million as of 2022.
5. What are some drivers contributing to market growth?
N/A
6. What are the notable trends driving market growth?
N/A
7. Are there any restraints impacting market growth?
N/A
8. Can you provide examples of recent developments in the market?
N/A
9. What pricing options are available for accessing the report?
Pricing options include single-user, multi-user, and enterprise licenses priced at USD 2900.00, USD 4350.00, and USD 5800.00 respectively.
10. Is the market size provided in terms of value or volume?
The market size is provided in terms of value, measured in million.
11. Are there any specific market keywords associated with the report?
Yes, the market keyword associated with the report is "Enterprise Gamification Platform," which aids in identifying and referencing the specific market segment covered.
12. How do I determine which pricing option suits my needs best?
The pricing options vary based on user requirements and access needs. Individual users may opt for single-user licenses, while businesses requiring broader access may choose multi-user or enterprise licenses for cost-effective access to the report.
13. Are there any additional resources or data provided in the Enterprise Gamification Platform report?
While the report offers comprehensive insights, it's advisable to review the specific contents or supplementary materials provided to ascertain if additional resources or data are available.
14. How can I stay updated on further developments or reports in the Enterprise Gamification Platform?
To stay informed about further developments, trends, and reports in the Enterprise Gamification Platform, consider subscribing to industry newsletters, following relevant companies and organizations, or regularly checking reputable industry news sources and publications.
Methodology
Step 1 - Identification of Relevant Samples Size from Population Database


Step 2 - Approaches for Defining Global Market Size (Value, Volume* & Price*)

Note*: In applicable scenarios
Step 3 - Data Sources
Primary Research
- Web Analytics
- Survey Reports
- Research Institute
- Latest Research Reports
- Opinion Leaders
Secondary Research
- Annual Reports
- White Paper
- Latest Press Release
- Industry Association
- Paid Database
- Investor Presentations

Step 4 - Data Triangulation
Involves using different sources of information in order to increase the validity of a study
These sources are likely to be stakeholders in a program - participants, other researchers, program staff, other community members, and so on.
Then we put all data in single framework & apply various statistical tools to find out the dynamic on the market.
During the analysis stage, feedback from the stakeholder groups would be compared to determine areas of agreement as well as areas of divergence
