
Key Insights
The Smart Grid Data Analytics market is poised for substantial expansion, projected to reach an estimated USD 35,200 million by 2025, fueled by a robust Compound Annual Growth Rate (CAGR) of 12.76% through 2033. This dynamic growth is primarily driven by the increasing demand for enhanced grid efficiency, improved reliability, and the integration of renewable energy sources. Utilities globally are recognizing the critical role of data analytics in managing complex grid operations, optimizing resource allocation, and responding effectively to fluctuating energy demands. The proliferation of smart meters and advanced sensor technologies is generating vast amounts of data, creating a fertile ground for sophisticated analytics solutions. Furthermore, the growing emphasis on reducing operational costs, minimizing energy losses, and ensuring grid stability in the face of evolving energy landscapes are significant catalysts for market adoption.
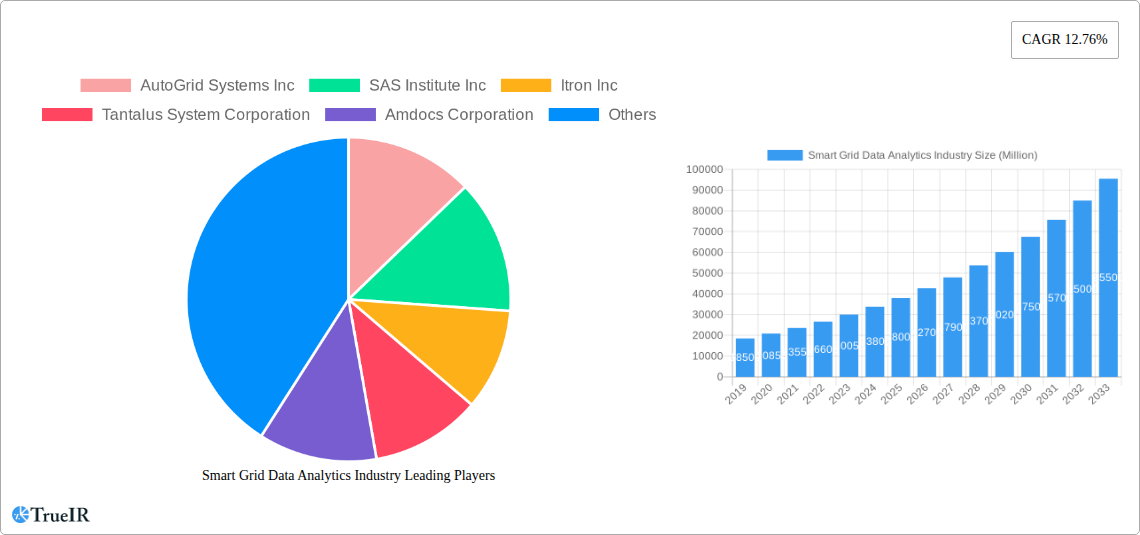
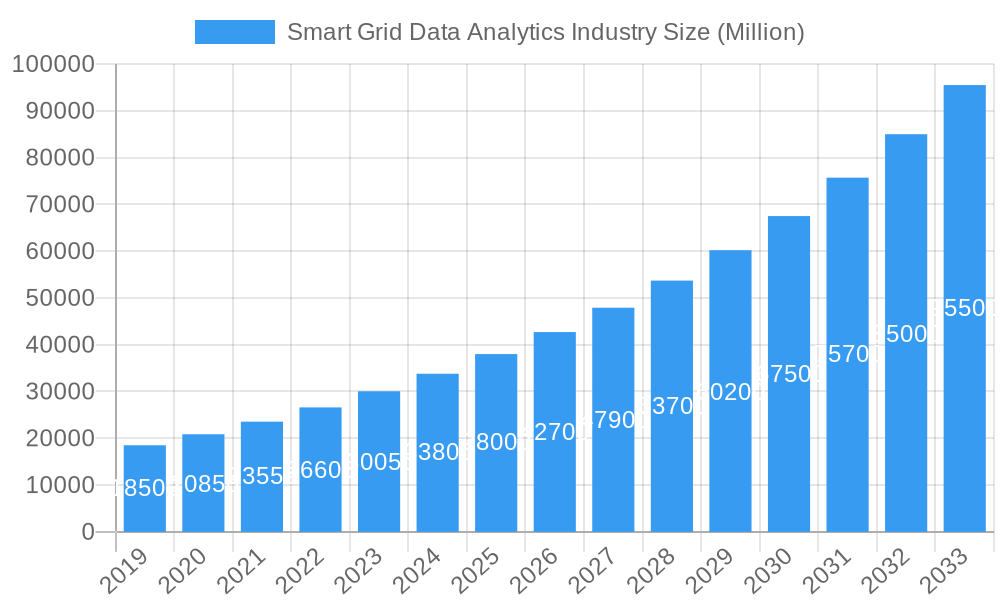
Smart Grid Data Analytics Industry Market Size (In Billion)
The market segmentation reveals a strong leaning towards cloud-based deployment solutions, reflecting the scalability, cost-effectiveness, and accessibility benefits they offer to utilities. Within the solution landscape, Transmission and Distribution (T&D) Network analytics are paramount, as they enable proactive maintenance, fault detection, and capacity planning. Advanced Metering Infrastructure (AMI) Analysis and Demand Response Analysis are also key application areas, empowering utilities to better understand consumer behavior, manage peak loads, and integrate distributed energy resources seamlessly. The private sector, encompassing both SMEs and large enterprises, alongside public sector utilities, represents a significant end-user base. While North America and Europe currently lead in market adoption due to mature smart grid infrastructure and regulatory support, the Asia Pacific region is anticipated to witness the fastest growth, driven by government initiatives and the rapid expansion of energy networks. Restraints such as high initial investment costs and concerns around data security and privacy are being addressed through technological advancements and evolving regulatory frameworks, paving the way for sustained market growth.
Smart Grid Data Analytics Industry Company Market Share
Smart Grid Data Analytics Industry: Unlocking Efficiency and Sustainability in Power Networks
This comprehensive report dives deep into the rapidly evolving Smart Grid Data Analytics Industry, providing in-depth market analysis, future projections, and competitive intelligence. With the global energy landscape undergoing a profound transformation towards decentralization and digitalization, the ability to effectively analyze vast amounts of smart grid data is paramount. This report explores how advanced analytics are revolutionizing utility operations, enhancing grid reliability, optimizing energy consumption, and accelerating the integration of renewable energy sources. Covering a study period from 2019 to 2033, with a base year of 2025, this analysis offers invaluable insights for stakeholders looking to navigate and capitalize on this dynamic market.
The Smart Grid Data Analytics market size is projected to reach an unprecedented scale, driven by the increasing deployment of smart meters, sophisticated grid infrastructure, and the growing demand for real-time data insights. This report will dissect the market into key segments, including Deployment (Cloud-based, On-premise), Solution (Transmission and Distribution (T&D) Network, Metering, Customer Analytics), and Application (Advanced Metering Infrastructure Analysis, Demand Response Analysis, Grid Optimization Analysis), providing a granular understanding of each segment's growth trajectory. Furthermore, the report examines the end-user verticals, such as the Private Sector (SMEs and Large Enterprises) and the Public Sector, highlighting their distinct analytical needs and adoption patterns.
This report is meticulously crafted for utility companies, technology providers, energy regulators, investment firms, and other industry participants seeking a strategic advantage. Leveraging high-volume keywords such as smart grid analytics, utility data analysis, grid optimization, demand response, advanced metering infrastructure, energy analytics, and digital utility transformation, this report is optimized for maximum search visibility and engagement.
Smart Grid Data Analytics Industry Market Structure & Competitive Landscape
The Smart Grid Data Analytics industry is characterized by a moderately concentrated market structure, with a blend of established technology giants and specialized analytics providers vying for market share. Innovation drivers are primarily centered around the development of advanced AI and machine learning algorithms for predictive maintenance, anomaly detection, and enhanced grid stability. Regulatory impacts are significant, with government mandates for smart grid deployment and data privacy shaping market dynamics. Product substitutes are emerging, including advanced SCADA systems and proprietary monitoring tools, though dedicated analytics platforms offer superior depth and breadth of insights. The end-user segmentation reveals a strong demand from utilities seeking operational efficiency and improved customer engagement. Mergers and acquisitions (M&A) are a notable trend, as larger players acquire innovative startups to bolster their analytics capabilities and expand their market reach. For instance, in the historical period, we observed an estimated XX M&A deals valued at over $XX Million, indicating a consolidating yet dynamic competitive landscape. The concentration ratio amongst the top 5 players is estimated to be around XX%, suggesting a significant but not insurmountable market dominance.
Smart Grid Data Analytics Industry Market Trends & Opportunities
The Smart Grid Data Analytics industry is experiencing a period of robust expansion, driven by a confluence of technological advancements, evolving consumer preferences, and a global imperative for more sustainable and resilient energy infrastructure. The market size is projected to witness a significant Compound Annual Growth Rate (CAGR) of approximately XX% during the forecast period (2025–2033), escalating from an estimated $XX Billion in the base year of 2025 to an impressive $XX Billion by 2033. This growth is fueled by the accelerating deployment of smart meters globally, with market penetration rates expected to surpass XX% by 2028, generating unprecedented volumes of granular data. Technological shifts are leaning heavily towards cloud-based analytics platforms, offering scalability, flexibility, and cost-effectiveness, although on-premise solutions remain relevant for organizations with stringent data security requirements. Consumer preferences are increasingly dictating a demand for personalized energy insights, transparent billing, and responsive demand-side management programs, all of which are enabled by sophisticated data analytics. Competitive dynamics are intensifying, with a focus on developing integrated solutions that combine data ingestion, processing, analysis, and visualization capabilities. Opportunities abound for companies that can offer advanced predictive analytics for grid fault detection, load forecasting with high accuracy, and real-time optimization of renewable energy integration. The increasing adoption of IoT devices within the grid ecosystem further amplifies the need for robust data analytics to manage and derive value from this connected infrastructure.
Dominant Markets & Segments in Smart Grid Data Analytics Industry
The Cloud-based Deployment segment is emerging as the dominant force in the Smart Grid Data Analytics industry, accounting for an estimated XX% of the market share in 2025. This dominance is propelled by the inherent scalability, cost-efficiency, and ease of integration offered by cloud platforms, allowing utilities to process and analyze vast datasets without significant upfront infrastructure investments. The Transmission and Distribution (T&D) Network Solution segment is another key driver of market growth, representing approximately XX% of the market. The continuous need for grid modernization, fault detection, and real-time monitoring of power flows in T&D networks makes advanced analytics indispensable. In terms of applications, Grid Optimization Analysis is poised for significant expansion, driven by the imperative to enhance grid reliability, reduce energy losses, and manage the intermittency of renewable energy sources. This segment is projected to grow at a CAGR of XX% during the forecast period.
Geographically, North America is expected to remain a dominant region, holding an estimated XX% of the global market share in 2025. This leadership is attributed to the early adoption of smart grid technologies, supportive government policies, and the presence of major utility providers and technology innovators. Within North America, the United States continues to lead due to substantial investments in grid modernization initiatives and regulatory frameworks that encourage data-driven utility operations. The Public Sector end-user vertical also presents substantial opportunities, with government agencies and municipal utilities increasingly investing in smart grid solutions to improve public services and energy security. Key growth drivers in this segment include infrastructure upgrades, stringent energy efficiency mandates, and the growing emphasis on smart city development.
Smart Grid Data Analytics Industry Product Analysis
The Smart Grid Data Analytics industry is witnessing a surge in product innovations focused on leveraging Artificial Intelligence (AI) and Machine Learning (ML) to derive actionable insights from complex grid data. These advancements are enhancing the capabilities of solutions such as Advanced Metering Infrastructure (AMI) analysis, enabling utilities to detect meter tampering and optimize billing cycles. Grid Optimization Analysis tools are now offering real-time predictive capabilities for fault detection and load balancing, significantly improving grid reliability and reducing outages. Competitive advantages are being built on the foundation of robust data processing, advanced visualization dashboards, and seamless integration with existing utility IT/OT systems, allowing for a holistic view of grid operations and customer behavior.
Key Drivers, Barriers & Challenges in Smart Grid Data Analytics Industry
Key Drivers: The Smart Grid Data Analytics industry is propelled by several key factors. The accelerating deployment of smart meters and IoT devices is generating massive datasets, necessitating advanced analytics for extraction of value. Government mandates and incentives for grid modernization and renewable energy integration are significant policy drivers. Furthermore, the increasing demand for energy efficiency and sustainability is pushing utilities to optimize their operations through data-driven insights. Technological advancements in AI, ML, and cloud computing are making sophisticated analytics more accessible and powerful.
Barriers & Challenges: Despite the strong growth trajectory, the industry faces considerable barriers and challenges. Integrating legacy systems with new analytics platforms often presents significant technical hurdles. Data security and privacy concerns remain paramount, requiring robust cybersecurity measures and adherence to evolving regulations. The scarcity of skilled data scientists and analytics professionals within the utility sector poses a talent gap. Furthermore, the high initial investment costs associated with implementing comprehensive smart grid analytics solutions can be a restraint, particularly for smaller utilities. Supply chain issues for specialized hardware and the complexity of regulatory compliance in different jurisdictions also present ongoing challenges.
Growth Drivers in the Smart Grid Data Analytics Industry Market
The growth drivers in the Smart Grid Data Analytics industry market are multifaceted, spanning technological, economic, and regulatory domains. The relentless expansion of smart grid infrastructure, including smart meters and sensors, is a primary catalyst, generating an unprecedented volume of real-time data. Economic drivers include the push for operational efficiency and cost reduction within utility companies, with analytics offering significant potential for optimizing energy distribution and minimizing losses. Regulatory frameworks worldwide are increasingly mandating smart grid adoption and data utilization for enhancing grid reliability and facilitating renewable energy integration, thereby creating a favorable policy environment. For example, initiatives promoting demand-side management and grid resilience directly fuel the demand for advanced analytics.
Challenges Impacting Smart Grid Data Analytics Industry Growth
Challenges impacting Smart Grid Data Analytics industry growth are substantial and varied. Regulatory complexities, including differing data privacy laws and interoperability standards across regions, can hinder widespread adoption and create implementation hurdles. Supply chain issues for critical hardware components required for data collection and processing can lead to project delays and increased costs. Competitive pressures are intensifying as new market entrants and established technology giants vie for dominance, often leading to price wars and demanding innovation cycles. Furthermore, the inherent complexity of integrating disparate legacy IT and operational technology (OT) systems within utility environments presents a significant technical challenge that requires substantial investment and expertise to overcome.
Key Players Shaping the Smart Grid Data Analytics Industry Market
- AutoGrid Systems Inc
- SAS Institute Inc
- Itron Inc
- Tantalus System Corporation
- Amdocs Corporation
- Uplight Inc
- IBM Corporation
- Landis & Gyr Group AG
- Hitachi Ltd
- Siemens AG
- Schneider Electric SE
- Sensus USA Inc (Xylem Inc )
- Oracle Corporation
- Uptake Technologies Inc
- General Electric Company
- SAP SE
Significant Smart Grid Data Analytics Industry Industry Milestones
- November 2022: Siemens Smart Infrastructure partnered with SEW, a prominent cloud platform provider specializing in digital customer and workforce experiences for utility providers, to support utilities globally, enhance customer and workforce experiences for smart meter users, and facilitate the transition to renewable energy sources. This move is expected to foster a long-term partnership that will advance the new platform paradigm in energy and utilities and accelerate digital transformation.
- September 2022: The R&D Center of Dubai Electricity and Water Authority (DEWA) is evaluating its Smart Grid Analytics project, which uses voltage and current data from critical substations to identify and anticipate medium-voltage (MV) disruptions. The R&D Center will also assess the "dInsight" Analytics Platform for comprehensive visual analytics of the grid, loads, and supplies.
- July 2022: Siemens Smart Infrastructure partnered with Esri, a geographic information systems (GIS) and location intelligence platform, to expand its ecosystem of partners for its grid software business. This collaboration will leverage Esri's mapping and spatial analytics tools with Siemens' expertise in electrical topology to assist grid operators in building, operating, and repairing power networks more effectively.
Future Outlook for Smart Grid Data Analytics Industry Market
The future outlook for the Smart Grid Data Analytics Industry is exceptionally promising, characterized by sustained high growth driven by the indispensable role of data in modernizing energy infrastructure. Strategic opportunities lie in the development of predictive maintenance solutions that can foresee equipment failures with unparalleled accuracy, thereby minimizing costly downtime and enhancing grid resilience. The increasing integration of distributed energy resources (DERs) and the rise of electric vehicles (EVs) will create new layers of complexity and demand for sophisticated analytics to manage grid stability and optimize energy flow. Furthermore, the evolution of AI and ML algorithms will enable more personalized customer engagement through tailored energy insights and demand-side management programs. The market is expected to witness continued innovation in cybersecurity solutions for protecting sensitive grid data, alongside a greater emphasis on interoperability and open data standards to foster collaboration and accelerate digital transformation across the global energy sector.
Smart Grid Data Analytics Industry Segmentation
-
1. Deployment
- 1.1. Cloud-based
- 1.2. On-premise
-
2. Solution
- 2.1. Transmission and Distribution (T&D) Network
- 2.2. Metering
- 2.3. Customer Analytics
-
3. Application
- 3.1. Advanced Metering Infrastructure Analysis
- 3.2. Demand Response Analysis
- 3.3. Grid Optimization Analysis
-
4. End-user Vertical
- 4.1. Private Sector (SMEs and Large Enterprises)
- 4.2. Public Sector
Smart Grid Data Analytics Industry Segmentation By Geography
- 1. North America
- 2. Europe
- 3. Asia Pacific
- 4. Latin America
- 5. Middle East
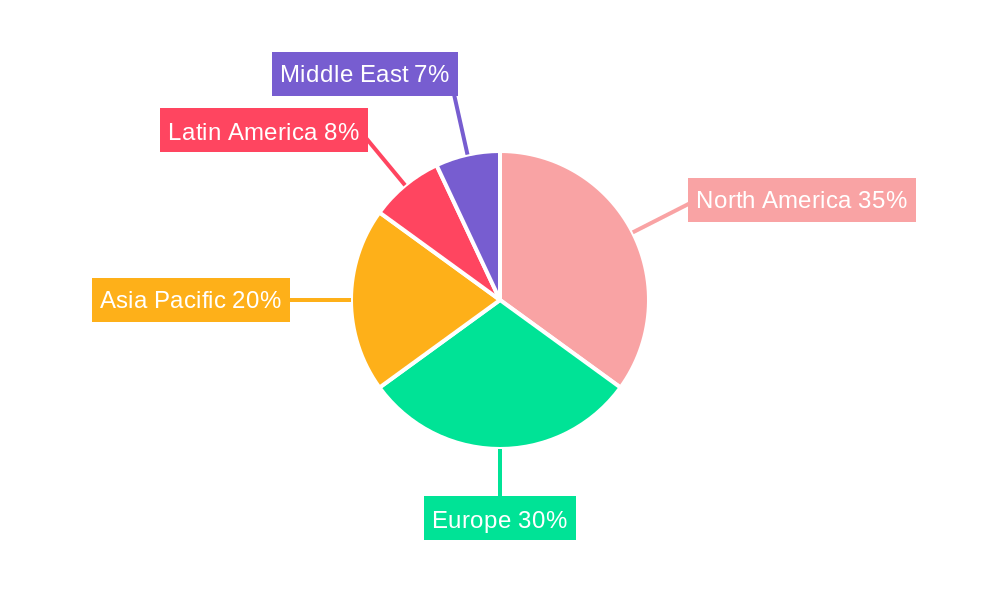
Smart Grid Data Analytics Industry Regional Market Share
Geographic Coverage of Smart Grid Data Analytics Industry
Smart Grid Data Analytics Industry REPORT HIGHLIGHTS
| Aspects | Details |
|---|---|
| Study Period | 2020-2034 |
| Base Year | 2025 |
| Estimated Year | 2026 |
| Forecast Period | 2026-2034 |
| Historical Period | 2020-2025 |
| Growth Rate | CAGR of 12.76% from 2020-2034 |
| Segmentation |
|
Table of Contents
- 1. Introduction
- 1.1. Research Scope
- 1.2. Market Segmentation
- 1.3. Research Methodology
- 1.4. Definitions and Assumptions
- 2. Executive Summary
- 2.1. Introduction
- 3. Market Dynamics
- 3.1. Introduction
- 3.2. Market Drivers
- 3.2.1. Growing Investments in Smart Grid Projects; Enormous Influx of Data
- 3.3. Market Restrains
- 3.3.1. Technical Difficulties
- 3.4. Market Trends
- 3.4.1. Growing Investments in Smart Grid Projects
- 4. Market Factor Analysis
- 4.1. Porters Five Forces
- 4.2. Supply/Value Chain
- 4.3. PESTEL analysis
- 4.4. Market Entropy
- 4.5. Patent/Trademark Analysis
- 5. Global Smart Grid Data Analytics Industry Analysis, Insights and Forecast, 2020-2032
- 5.1. Market Analysis, Insights and Forecast - by Deployment
- 5.1.1. Cloud-based
- 5.1.2. On-premise
- 5.2. Market Analysis, Insights and Forecast - by Solution
- 5.2.1. Transmission and Distribution (T&D) Network
- 5.2.2. Metering
- 5.2.3. Customer Analytics
- 5.3. Market Analysis, Insights and Forecast - by Application
- 5.3.1. Advanced Metering Infrastructure Analysis
- 5.3.2. Demand Response Analysis
- 5.3.3. Grid Optimization Analysis
- 5.4. Market Analysis, Insights and Forecast - by End-user Vertical
- 5.4.1. Private Sector (SMEs and Large Enterprises)
- 5.4.2. Public Sector
- 5.5. Market Analysis, Insights and Forecast - by Region
- 5.5.1. North America
- 5.5.2. Europe
- 5.5.3. Asia Pacific
- 5.5.4. Latin America
- 5.5.5. Middle East
- 5.1. Market Analysis, Insights and Forecast - by Deployment
- 6. North America Smart Grid Data Analytics Industry Analysis, Insights and Forecast, 2020-2032
- 6.1. Market Analysis, Insights and Forecast - by Deployment
- 6.1.1. Cloud-based
- 6.1.2. On-premise
- 6.2. Market Analysis, Insights and Forecast - by Solution
- 6.2.1. Transmission and Distribution (T&D) Network
- 6.2.2. Metering
- 6.2.3. Customer Analytics
- 6.3. Market Analysis, Insights and Forecast - by Application
- 6.3.1. Advanced Metering Infrastructure Analysis
- 6.3.2. Demand Response Analysis
- 6.3.3. Grid Optimization Analysis
- 6.4. Market Analysis, Insights and Forecast - by End-user Vertical
- 6.4.1. Private Sector (SMEs and Large Enterprises)
- 6.4.2. Public Sector
- 6.1. Market Analysis, Insights and Forecast - by Deployment
- 7. Europe Smart Grid Data Analytics Industry Analysis, Insights and Forecast, 2020-2032
- 7.1. Market Analysis, Insights and Forecast - by Deployment
- 7.1.1. Cloud-based
- 7.1.2. On-premise
- 7.2. Market Analysis, Insights and Forecast - by Solution
- 7.2.1. Transmission and Distribution (T&D) Network
- 7.2.2. Metering
- 7.2.3. Customer Analytics
- 7.3. Market Analysis, Insights and Forecast - by Application
- 7.3.1. Advanced Metering Infrastructure Analysis
- 7.3.2. Demand Response Analysis
- 7.3.3. Grid Optimization Analysis
- 7.4. Market Analysis, Insights and Forecast - by End-user Vertical
- 7.4.1. Private Sector (SMEs and Large Enterprises)
- 7.4.2. Public Sector
- 7.1. Market Analysis, Insights and Forecast - by Deployment
- 8. Asia Pacific Smart Grid Data Analytics Industry Analysis, Insights and Forecast, 2020-2032
- 8.1. Market Analysis, Insights and Forecast - by Deployment
- 8.1.1. Cloud-based
- 8.1.2. On-premise
- 8.2. Market Analysis, Insights and Forecast - by Solution
- 8.2.1. Transmission and Distribution (T&D) Network
- 8.2.2. Metering
- 8.2.3. Customer Analytics
- 8.3. Market Analysis, Insights and Forecast - by Application
- 8.3.1. Advanced Metering Infrastructure Analysis
- 8.3.2. Demand Response Analysis
- 8.3.3. Grid Optimization Analysis
- 8.4. Market Analysis, Insights and Forecast - by End-user Vertical
- 8.4.1. Private Sector (SMEs and Large Enterprises)
- 8.4.2. Public Sector
- 8.1. Market Analysis, Insights and Forecast - by Deployment
- 9. Latin America Smart Grid Data Analytics Industry Analysis, Insights and Forecast, 2020-2032
- 9.1. Market Analysis, Insights and Forecast - by Deployment
- 9.1.1. Cloud-based
- 9.1.2. On-premise
- 9.2. Market Analysis, Insights and Forecast - by Solution
- 9.2.1. Transmission and Distribution (T&D) Network
- 9.2.2. Metering
- 9.2.3. Customer Analytics
- 9.3. Market Analysis, Insights and Forecast - by Application
- 9.3.1. Advanced Metering Infrastructure Analysis
- 9.3.2. Demand Response Analysis
- 9.3.3. Grid Optimization Analysis
- 9.4. Market Analysis, Insights and Forecast - by End-user Vertical
- 9.4.1. Private Sector (SMEs and Large Enterprises)
- 9.4.2. Public Sector
- 9.1. Market Analysis, Insights and Forecast - by Deployment
- 10. Middle East Smart Grid Data Analytics Industry Analysis, Insights and Forecast, 2020-2032
- 10.1. Market Analysis, Insights and Forecast - by Deployment
- 10.1.1. Cloud-based
- 10.1.2. On-premise
- 10.2. Market Analysis, Insights and Forecast - by Solution
- 10.2.1. Transmission and Distribution (T&D) Network
- 10.2.2. Metering
- 10.2.3. Customer Analytics
- 10.3. Market Analysis, Insights and Forecast - by Application
- 10.3.1. Advanced Metering Infrastructure Analysis
- 10.3.2. Demand Response Analysis
- 10.3.3. Grid Optimization Analysis
- 10.4. Market Analysis, Insights and Forecast - by End-user Vertical
- 10.4.1. Private Sector (SMEs and Large Enterprises)
- 10.4.2. Public Sector
- 10.1. Market Analysis, Insights and Forecast - by Deployment
- 11. North America Smart Grid Data Analytics Industry Analysis, Insights and Forecast, 2020-2032
- 11.1. Market Analysis, Insights and Forecast - By Country/Sub-region
- 11.1.1.
- 12. Europe Smart Grid Data Analytics Industry Analysis, Insights and Forecast, 2020-2032
- 12.1. Market Analysis, Insights and Forecast - By Country/Sub-region
- 12.1.1.
- 13. Asia Pacific Smart Grid Data Analytics Industry Analysis, Insights and Forecast, 2020-2032
- 13.1. Market Analysis, Insights and Forecast - By Country/Sub-region
- 13.1.1.
- 14. Latin America Smart Grid Data Analytics Industry Analysis, Insights and Forecast, 2020-2032
- 14.1. Market Analysis, Insights and Forecast - By Country/Sub-region
- 14.1.1.
- 15. Middle East Smart Grid Data Analytics Industry Analysis, Insights and Forecast, 2020-2032
- 15.1. Market Analysis, Insights and Forecast - By Country/Sub-region
- 15.1.1.
- 16. Competitive Analysis
- 16.1. Global Market Share Analysis 2025
- 16.2. Company Profiles
- 16.2.1 AutoGrid Systems Inc
- 16.2.1.1. Overview
- 16.2.1.2. Products
- 16.2.1.3. SWOT Analysis
- 16.2.1.4. Recent Developments
- 16.2.1.5. Financials (Based on Availability)
- 16.2.2 SAS Institute Inc
- 16.2.2.1. Overview
- 16.2.2.2. Products
- 16.2.2.3. SWOT Analysis
- 16.2.2.4. Recent Developments
- 16.2.2.5. Financials (Based on Availability)
- 16.2.3 Itron Inc
- 16.2.3.1. Overview
- 16.2.3.2. Products
- 16.2.3.3. SWOT Analysis
- 16.2.3.4. Recent Developments
- 16.2.3.5. Financials (Based on Availability)
- 16.2.4 Tantalus System Corporation
- 16.2.4.1. Overview
- 16.2.4.2. Products
- 16.2.4.3. SWOT Analysis
- 16.2.4.4. Recent Developments
- 16.2.4.5. Financials (Based on Availability)
- 16.2.5 Amdocs Corporation
- 16.2.5.1. Overview
- 16.2.5.2. Products
- 16.2.5.3. SWOT Analysis
- 16.2.5.4. Recent Developments
- 16.2.5.5. Financials (Based on Availability)
- 16.2.6 Uplight Inc
- 16.2.6.1. Overview
- 16.2.6.2. Products
- 16.2.6.3. SWOT Analysis
- 16.2.6.4. Recent Developments
- 16.2.6.5. Financials (Based on Availability)
- 16.2.7 IBM Corporation
- 16.2.7.1. Overview
- 16.2.7.2. Products
- 16.2.7.3. SWOT Analysis
- 16.2.7.4. Recent Developments
- 16.2.7.5. Financials (Based on Availability)
- 16.2.8 Landis & Gyr Group AG
- 16.2.8.1. Overview
- 16.2.8.2. Products
- 16.2.8.3. SWOT Analysis
- 16.2.8.4. Recent Developments
- 16.2.8.5. Financials (Based on Availability)
- 16.2.9 Hitachi Ltd
- 16.2.9.1. Overview
- 16.2.9.2. Products
- 16.2.9.3. SWOT Analysis
- 16.2.9.4. Recent Developments
- 16.2.9.5. Financials (Based on Availability)
- 16.2.10 Siemens AG
- 16.2.10.1. Overview
- 16.2.10.2. Products
- 16.2.10.3. SWOT Analysis
- 16.2.10.4. Recent Developments
- 16.2.10.5. Financials (Based on Availability)
- 16.2.11 Schneider Electric SE
- 16.2.11.1. Overview
- 16.2.11.2. Products
- 16.2.11.3. SWOT Analysis
- 16.2.11.4. Recent Developments
- 16.2.11.5. Financials (Based on Availability)
- 16.2.12 Sensus USA Inc (Xylem Inc )*List Not Exhaustive
- 16.2.12.1. Overview
- 16.2.12.2. Products
- 16.2.12.3. SWOT Analysis
- 16.2.12.4. Recent Developments
- 16.2.12.5. Financials (Based on Availability)
- 16.2.13 Oracle Corporation
- 16.2.13.1. Overview
- 16.2.13.2. Products
- 16.2.13.3. SWOT Analysis
- 16.2.13.4. Recent Developments
- 16.2.13.5. Financials (Based on Availability)
- 16.2.14 Uptake Technologies Inc
- 16.2.14.1. Overview
- 16.2.14.2. Products
- 16.2.14.3. SWOT Analysis
- 16.2.14.4. Recent Developments
- 16.2.14.5. Financials (Based on Availability)
- 16.2.15 General Electric Company
- 16.2.15.1. Overview
- 16.2.15.2. Products
- 16.2.15.3. SWOT Analysis
- 16.2.15.4. Recent Developments
- 16.2.15.5. Financials (Based on Availability)
- 16.2.16 SAP SE
- 16.2.16.1. Overview
- 16.2.16.2. Products
- 16.2.16.3. SWOT Analysis
- 16.2.16.4. Recent Developments
- 16.2.16.5. Financials (Based on Availability)
- 16.2.1 AutoGrid Systems Inc
List of Figures
- Figure 1: Global Smart Grid Data Analytics Industry Revenue Breakdown (Million, %) by Region 2025 & 2033
- Figure 2: North America Smart Grid Data Analytics Industry Revenue (Million), by Country 2025 & 2033
- Figure 3: North America Smart Grid Data Analytics Industry Revenue Share (%), by Country 2025 & 2033
- Figure 4: Europe Smart Grid Data Analytics Industry Revenue (Million), by Country 2025 & 2033
- Figure 5: Europe Smart Grid Data Analytics Industry Revenue Share (%), by Country 2025 & 2033
- Figure 6: Asia Pacific Smart Grid Data Analytics Industry Revenue (Million), by Country 2025 & 2033
- Figure 7: Asia Pacific Smart Grid Data Analytics Industry Revenue Share (%), by Country 2025 & 2033
- Figure 8: Latin America Smart Grid Data Analytics Industry Revenue (Million), by Country 2025 & 2033
- Figure 9: Latin America Smart Grid Data Analytics Industry Revenue Share (%), by Country 2025 & 2033
- Figure 10: Middle East Smart Grid Data Analytics Industry Revenue (Million), by Country 2025 & 2033
- Figure 11: Middle East Smart Grid Data Analytics Industry Revenue Share (%), by Country 2025 & 2033
- Figure 12: North America Smart Grid Data Analytics Industry Revenue (Million), by Deployment 2025 & 2033
- Figure 13: North America Smart Grid Data Analytics Industry Revenue Share (%), by Deployment 2025 & 2033
- Figure 14: North America Smart Grid Data Analytics Industry Revenue (Million), by Solution 2025 & 2033
- Figure 15: North America Smart Grid Data Analytics Industry Revenue Share (%), by Solution 2025 & 2033
- Figure 16: North America Smart Grid Data Analytics Industry Revenue (Million), by Application 2025 & 2033
- Figure 17: North America Smart Grid Data Analytics Industry Revenue Share (%), by Application 2025 & 2033
- Figure 18: North America Smart Grid Data Analytics Industry Revenue (Million), by End-user Vertical 2025 & 2033
- Figure 19: North America Smart Grid Data Analytics Industry Revenue Share (%), by End-user Vertical 2025 & 2033
- Figure 20: North America Smart Grid Data Analytics Industry Revenue (Million), by Country 2025 & 2033
- Figure 21: North America Smart Grid Data Analytics Industry Revenue Share (%), by Country 2025 & 2033
- Figure 22: Europe Smart Grid Data Analytics Industry Revenue (Million), by Deployment 2025 & 2033
- Figure 23: Europe Smart Grid Data Analytics Industry Revenue Share (%), by Deployment 2025 & 2033
- Figure 24: Europe Smart Grid Data Analytics Industry Revenue (Million), by Solution 2025 & 2033
- Figure 25: Europe Smart Grid Data Analytics Industry Revenue Share (%), by Solution 2025 & 2033
- Figure 26: Europe Smart Grid Data Analytics Industry Revenue (Million), by Application 2025 & 2033
- Figure 27: Europe Smart Grid Data Analytics Industry Revenue Share (%), by Application 2025 & 2033
- Figure 28: Europe Smart Grid Data Analytics Industry Revenue (Million), by End-user Vertical 2025 & 2033
- Figure 29: Europe Smart Grid Data Analytics Industry Revenue Share (%), by End-user Vertical 2025 & 2033
- Figure 30: Europe Smart Grid Data Analytics Industry Revenue (Million), by Country 2025 & 2033
- Figure 31: Europe Smart Grid Data Analytics Industry Revenue Share (%), by Country 2025 & 2033
- Figure 32: Asia Pacific Smart Grid Data Analytics Industry Revenue (Million), by Deployment 2025 & 2033
- Figure 33: Asia Pacific Smart Grid Data Analytics Industry Revenue Share (%), by Deployment 2025 & 2033
- Figure 34: Asia Pacific Smart Grid Data Analytics Industry Revenue (Million), by Solution 2025 & 2033
- Figure 35: Asia Pacific Smart Grid Data Analytics Industry Revenue Share (%), by Solution 2025 & 2033
- Figure 36: Asia Pacific Smart Grid Data Analytics Industry Revenue (Million), by Application 2025 & 2033
- Figure 37: Asia Pacific Smart Grid Data Analytics Industry Revenue Share (%), by Application 2025 & 2033
- Figure 38: Asia Pacific Smart Grid Data Analytics Industry Revenue (Million), by End-user Vertical 2025 & 2033
- Figure 39: Asia Pacific Smart Grid Data Analytics Industry Revenue Share (%), by End-user Vertical 2025 & 2033
- Figure 40: Asia Pacific Smart Grid Data Analytics Industry Revenue (Million), by Country 2025 & 2033
- Figure 41: Asia Pacific Smart Grid Data Analytics Industry Revenue Share (%), by Country 2025 & 2033
- Figure 42: Latin America Smart Grid Data Analytics Industry Revenue (Million), by Deployment 2025 & 2033
- Figure 43: Latin America Smart Grid Data Analytics Industry Revenue Share (%), by Deployment 2025 & 2033
- Figure 44: Latin America Smart Grid Data Analytics Industry Revenue (Million), by Solution 2025 & 2033
- Figure 45: Latin America Smart Grid Data Analytics Industry Revenue Share (%), by Solution 2025 & 2033
- Figure 46: Latin America Smart Grid Data Analytics Industry Revenue (Million), by Application 2025 & 2033
- Figure 47: Latin America Smart Grid Data Analytics Industry Revenue Share (%), by Application 2025 & 2033
- Figure 48: Latin America Smart Grid Data Analytics Industry Revenue (Million), by End-user Vertical 2025 & 2033
- Figure 49: Latin America Smart Grid Data Analytics Industry Revenue Share (%), by End-user Vertical 2025 & 2033
- Figure 50: Latin America Smart Grid Data Analytics Industry Revenue (Million), by Country 2025 & 2033
- Figure 51: Latin America Smart Grid Data Analytics Industry Revenue Share (%), by Country 2025 & 2033
- Figure 52: Middle East Smart Grid Data Analytics Industry Revenue (Million), by Deployment 2025 & 2033
- Figure 53: Middle East Smart Grid Data Analytics Industry Revenue Share (%), by Deployment 2025 & 2033
- Figure 54: Middle East Smart Grid Data Analytics Industry Revenue (Million), by Solution 2025 & 2033
- Figure 55: Middle East Smart Grid Data Analytics Industry Revenue Share (%), by Solution 2025 & 2033
- Figure 56: Middle East Smart Grid Data Analytics Industry Revenue (Million), by Application 2025 & 2033
- Figure 57: Middle East Smart Grid Data Analytics Industry Revenue Share (%), by Application 2025 & 2033
- Figure 58: Middle East Smart Grid Data Analytics Industry Revenue (Million), by End-user Vertical 2025 & 2033
- Figure 59: Middle East Smart Grid Data Analytics Industry Revenue Share (%), by End-user Vertical 2025 & 2033
- Figure 60: Middle East Smart Grid Data Analytics Industry Revenue (Million), by Country 2025 & 2033
- Figure 61: Middle East Smart Grid Data Analytics Industry Revenue Share (%), by Country 2025 & 2033
List of Tables
- Table 1: Global Smart Grid Data Analytics Industry Revenue Million Forecast, by Region 2020 & 2033
- Table 2: Global Smart Grid Data Analytics Industry Revenue Million Forecast, by Deployment 2020 & 2033
- Table 3: Global Smart Grid Data Analytics Industry Revenue Million Forecast, by Solution 2020 & 2033
- Table 4: Global Smart Grid Data Analytics Industry Revenue Million Forecast, by Application 2020 & 2033
- Table 5: Global Smart Grid Data Analytics Industry Revenue Million Forecast, by End-user Vertical 2020 & 2033
- Table 6: Global Smart Grid Data Analytics Industry Revenue Million Forecast, by Region 2020 & 2033
- Table 7: Global Smart Grid Data Analytics Industry Revenue Million Forecast, by Country 2020 & 2033
- Table 8: Smart Grid Data Analytics Industry Revenue (Million) Forecast, by Application 2020 & 2033
- Table 9: Global Smart Grid Data Analytics Industry Revenue Million Forecast, by Country 2020 & 2033
- Table 10: Smart Grid Data Analytics Industry Revenue (Million) Forecast, by Application 2020 & 2033
- Table 11: Global Smart Grid Data Analytics Industry Revenue Million Forecast, by Country 2020 & 2033
- Table 12: Smart Grid Data Analytics Industry Revenue (Million) Forecast, by Application 2020 & 2033
- Table 13: Global Smart Grid Data Analytics Industry Revenue Million Forecast, by Country 2020 & 2033
- Table 14: Smart Grid Data Analytics Industry Revenue (Million) Forecast, by Application 2020 & 2033
- Table 15: Global Smart Grid Data Analytics Industry Revenue Million Forecast, by Country 2020 & 2033
- Table 16: Smart Grid Data Analytics Industry Revenue (Million) Forecast, by Application 2020 & 2033
- Table 17: Global Smart Grid Data Analytics Industry Revenue Million Forecast, by Deployment 2020 & 2033
- Table 18: Global Smart Grid Data Analytics Industry Revenue Million Forecast, by Solution 2020 & 2033
- Table 19: Global Smart Grid Data Analytics Industry Revenue Million Forecast, by Application 2020 & 2033
- Table 20: Global Smart Grid Data Analytics Industry Revenue Million Forecast, by End-user Vertical 2020 & 2033
- Table 21: Global Smart Grid Data Analytics Industry Revenue Million Forecast, by Country 2020 & 2033
- Table 22: Global Smart Grid Data Analytics Industry Revenue Million Forecast, by Deployment 2020 & 2033
- Table 23: Global Smart Grid Data Analytics Industry Revenue Million Forecast, by Solution 2020 & 2033
- Table 24: Global Smart Grid Data Analytics Industry Revenue Million Forecast, by Application 2020 & 2033
- Table 25: Global Smart Grid Data Analytics Industry Revenue Million Forecast, by End-user Vertical 2020 & 2033
- Table 26: Global Smart Grid Data Analytics Industry Revenue Million Forecast, by Country 2020 & 2033
- Table 27: Global Smart Grid Data Analytics Industry Revenue Million Forecast, by Deployment 2020 & 2033
- Table 28: Global Smart Grid Data Analytics Industry Revenue Million Forecast, by Solution 2020 & 2033
- Table 29: Global Smart Grid Data Analytics Industry Revenue Million Forecast, by Application 2020 & 2033
- Table 30: Global Smart Grid Data Analytics Industry Revenue Million Forecast, by End-user Vertical 2020 & 2033
- Table 31: Global Smart Grid Data Analytics Industry Revenue Million Forecast, by Country 2020 & 2033
- Table 32: Global Smart Grid Data Analytics Industry Revenue Million Forecast, by Deployment 2020 & 2033
- Table 33: Global Smart Grid Data Analytics Industry Revenue Million Forecast, by Solution 2020 & 2033
- Table 34: Global Smart Grid Data Analytics Industry Revenue Million Forecast, by Application 2020 & 2033
- Table 35: Global Smart Grid Data Analytics Industry Revenue Million Forecast, by End-user Vertical 2020 & 2033
- Table 36: Global Smart Grid Data Analytics Industry Revenue Million Forecast, by Country 2020 & 2033
- Table 37: Global Smart Grid Data Analytics Industry Revenue Million Forecast, by Deployment 2020 & 2033
- Table 38: Global Smart Grid Data Analytics Industry Revenue Million Forecast, by Solution 2020 & 2033
- Table 39: Global Smart Grid Data Analytics Industry Revenue Million Forecast, by Application 2020 & 2033
- Table 40: Global Smart Grid Data Analytics Industry Revenue Million Forecast, by End-user Vertical 2020 & 2033
- Table 41: Global Smart Grid Data Analytics Industry Revenue Million Forecast, by Country 2020 & 2033
Frequently Asked Questions
1. What is the projected Compound Annual Growth Rate (CAGR) of the Smart Grid Data Analytics Industry?
The projected CAGR is approximately 12.76%.
2. Which companies are prominent players in the Smart Grid Data Analytics Industry?
Key companies in the market include AutoGrid Systems Inc, SAS Institute Inc, Itron Inc, Tantalus System Corporation, Amdocs Corporation, Uplight Inc, IBM Corporation, Landis & Gyr Group AG, Hitachi Ltd, Siemens AG, Schneider Electric SE, Sensus USA Inc (Xylem Inc )*List Not Exhaustive, Oracle Corporation, Uptake Technologies Inc, General Electric Company, SAP SE.
3. What are the main segments of the Smart Grid Data Analytics Industry?
The market segments include Deployment, Solution, Application, End-user Vertical.
4. Can you provide details about the market size?
The market size is estimated to be USD XX Million as of 2022.
5. What are some drivers contributing to market growth?
Growing Investments in Smart Grid Projects; Enormous Influx of Data.
6. What are the notable trends driving market growth?
Growing Investments in Smart Grid Projects.
7. Are there any restraints impacting market growth?
Technical Difficulties.
8. Can you provide examples of recent developments in the market?
November 2022: Siemens Smart Infrastructure partnered with SEW, a prominent cloud platform provider that specializes in digital customer experiences and workforce experiences for utility providers, to support utilities globally, improve the customer and workforce experiences for utility smart meter users, and facilitate the transition to a world powered entirely by renewable energy sources. The companies say that this move could lead to a long-term partnership that will help move forward the new platform paradigm in energy and utilities and speed up the digital transformation process.
9. What pricing options are available for accessing the report?
Pricing options include single-user, multi-user, and enterprise licenses priced at USD 4750, USD 5250, and USD 8750 respectively.
10. Is the market size provided in terms of value or volume?
The market size is provided in terms of value, measured in Million.
11. Are there any specific market keywords associated with the report?
Yes, the market keyword associated with the report is "Smart Grid Data Analytics Industry," which aids in identifying and referencing the specific market segment covered.
12. How do I determine which pricing option suits my needs best?
The pricing options vary based on user requirements and access needs. Individual users may opt for single-user licenses, while businesses requiring broader access may choose multi-user or enterprise licenses for cost-effective access to the report.
13. Are there any additional resources or data provided in the Smart Grid Data Analytics Industry report?
While the report offers comprehensive insights, it's advisable to review the specific contents or supplementary materials provided to ascertain if additional resources or data are available.
14. How can I stay updated on further developments or reports in the Smart Grid Data Analytics Industry?
To stay informed about further developments, trends, and reports in the Smart Grid Data Analytics Industry, consider subscribing to industry newsletters, following relevant companies and organizations, or regularly checking reputable industry news sources and publications.
Methodology
Step 1 - Identification of Relevant Samples Size from Population Database


Step 2 - Approaches for Defining Global Market Size (Value, Volume* & Price*)

Note*: In applicable scenarios
Step 3 - Data Sources
Primary Research
- Web Analytics
- Survey Reports
- Research Institute
- Latest Research Reports
- Opinion Leaders
Secondary Research
- Annual Reports
- White Paper
- Latest Press Release
- Industry Association
- Paid Database
- Investor Presentations

Step 4 - Data Triangulation
Involves using different sources of information in order to increase the validity of a study
These sources are likely to be stakeholders in a program - participants, other researchers, program staff, other community members, and so on.
Then we put all data in single framework & apply various statistical tools to find out the dynamic on the market.
During the analysis stage, feedback from the stakeholder groups would be compared to determine areas of agreement as well as areas of divergence
