

Key Insights
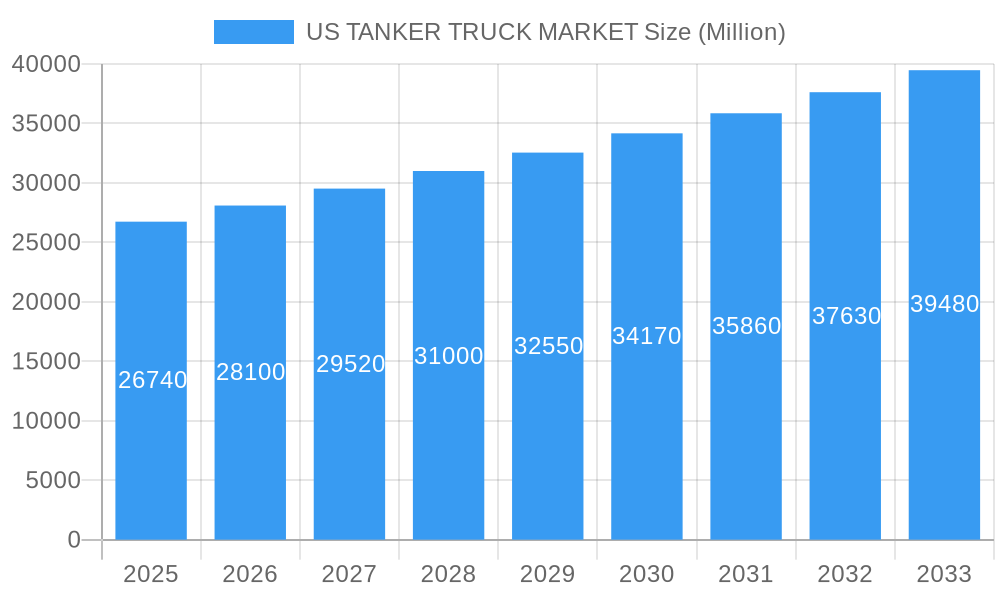
The US tanker truck market, valued at $26.74 billion in 2025, is projected to experience robust growth, driven by increasing demand across diverse sectors. The compound annual growth rate (CAGR) of 5.03% from 2025 to 2033 indicates a significant expansion of the market over the forecast period. Key growth drivers include the burgeoning oil and gas industry, expanding food and beverage sector requiring efficient transportation of liquids, and the rising need for chemical and water treatment transportation. Furthermore, the construction and waste management industries contribute significantly to the market's expansion by demanding specialized tanker truck services for transporting various materials. Segmentation by capacity reveals a substantial demand across all categories – less than 1,000 gallons, between 1,000 and 4,000 gallons, and more than 4,000 gallons – reflecting the varied needs of different industries. Major players like Freightliner Trucks, Iveco, Scania AB, and Volvo Group are actively shaping market dynamics through technological advancements and expansion strategies. Regional analysis focusing on the United States shows strong demand across all regions (Northeast, Southeast, Midwest, Southwest, and West), reflecting the country's diverse economic activities and infrastructure needs.
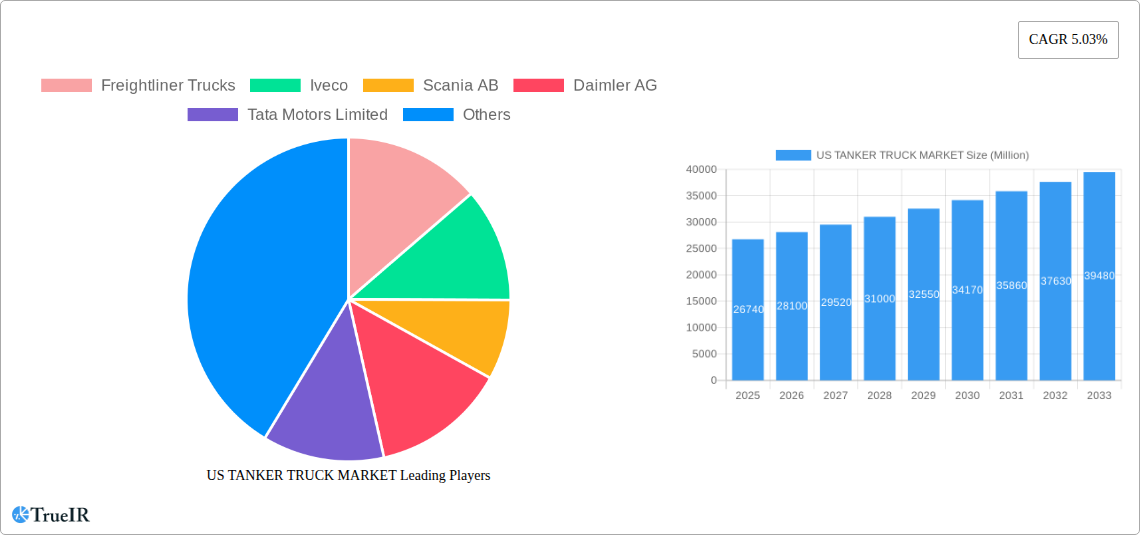
US TANKER TRUCK MARKET Market Size (In Billion)
The competitive landscape is characterized by a mix of established international and domestic players. Differentiation occurs through specialized features, technological advancements in fuel efficiency and safety, and strategic partnerships to gain market share. While the market faces potential restraints like fluctuating fuel prices and stringent environmental regulations, ongoing technological innovation – particularly in the development of sustainable and efficient tanker trucks – is expected to mitigate these challenges. The continuous growth in various sectors directly translates into consistent demand for tanker truck services, solidifying the market's positive outlook for the long term. Continued investments in infrastructure development and the adoption of advanced logistics solutions will further fuel the expansion of the US tanker truck market.
US TANKER TRUCK MARKET Company Market Share
US Tanker Truck Market: A Comprehensive Report (2019-2033)
This dynamic report provides a deep dive into the US Tanker Truck Market, offering invaluable insights for industry stakeholders, investors, and strategists. Leveraging extensive research and data analysis across the historical period (2019-2024), base year (2025), and forecast period (2025-2033), this report delivers a 360-degree view of market dynamics, trends, and future projections. The market is expected to reach xx Million by 2033, exhibiting a CAGR of xx% during the forecast period.
US Tanker Truck Market Market Structure & Competitive Landscape
This section analyzes the competitive intensity and structure of the US tanker truck market. We examine market concentration through metrics such as the Herfindahl-Hirschman Index (HHI) and identify key players like Freightliner Trucks, Iveco, Scania AB, Daimler AG, Tata Motors Limited, Volvo Group, Navistar International Corporation, Hyundai Motor Company, Polar Tank Trailer, Kenworth, and MAN Truck & Bus AG (list not exhaustive). The report also explores factors shaping the competitive landscape:
Market Concentration: The US tanker truck market exhibits a [Describe Concentration Level - e.g., moderately concentrated] structure, with a HHI of xx. This indicates [Describe the implication of the HHI e.g., the presence of both large and smaller players, limited market dominance by a single entity].
Innovation Drivers: Technological advancements in fuel efficiency, safety features (e.g., advanced driver-assistance systems), and emission control are key innovation drivers. The increasing adoption of electric and alternative fuel vehicles is further transforming the market.
Regulatory Impacts: Stringent emission regulations, safety standards (e.g., ELD mandate), and driver regulations significantly influence market dynamics. Compliance costs and technological adaptations represent key challenges for market players.
Product Substitutes: While direct substitutes are limited, the emergence of alternative transportation modes (e.g., pipelines, rail) presents indirect competition and influences market share.
End-User Segmentation: The market is segmented by capacity (Less than 1,000 gallons, Between 1,000 and 4,000 gallons, More than 4,000 gallons) and sector type (Oil and Gas Industry, Food Sector, Healthcare Sector, Water Treatment Facilities, Chemical Industry, Construction, Waste Management, Other Sectors). Analysis reveals varying growth trajectories across segments, reflecting differing demand drivers and regulatory landscapes.
M&A Trends: The report analyzes historical and projected merger and acquisition (M&A) activity, estimating an annual M&A volume of xx deals during the forecast period, driven primarily by [Mention key drivers of M&A like expansion strategies, technological integration, and market consolidation].
US Tanker Truck Market Market Trends & Opportunities
The US tanker truck market is poised for substantial growth driven by several key factors. The market size is projected to expand from xx Million in 2025 to xx Million by 2033. This growth is fueled by:
Rising Demand from Key Sectors: Expanding industrial activity in sectors like oil and gas, chemicals, and food processing fuels demand for efficient tanker transportation. The construction sector also presents significant opportunities.
Technological Advancements: Innovations such as telematics, improved fuel efficiency technologies, and the introduction of electric and alternative fuel trucks are transforming the market, enhancing operational efficiency and reducing environmental impact.
Evolving Consumer Preferences: Demand for enhanced safety and sustainability is pushing companies to invest in newer, more environmentally-friendly fleets. This trend creates opportunities for companies offering advanced safety features and sustainable solutions.
Competitive Dynamics: Intense competition among established and emerging players is driving innovation and price optimization, resulting in a dynamic and ever-evolving market.
The report further details market penetration rates across various segments and analyzes the CAGR for each.
Dominant Markets & Segments in US Tanker Truck Market
The report identifies the dominant market segments based on capacity and sector type. The analysis is based on market share, growth rates, and future potential.
By Capacity:
Between 1,000 Gallons and 4,000 Gallons: This segment holds the largest market share, primarily driven by its versatility across a wide range of applications.
More Than 4,000 Gallons: This segment is expected to experience significant growth, driven by increasing demand for bulk transportation in the oil and gas sector.
Less Than 1,000 Gallons: While smaller in size, this segment is likely to maintain steady growth, particularly fueled by specialized applications in the food and healthcare sectors.
By Sector Type:
Oil and Gas Industry: Remains a dominant sector due to its significant reliance on tanker trucks for the transportation of crude oil and refined petroleum products. Growth in this sector is directly correlated with oil production and refining activity.
Chemical Industry: This sector presents substantial growth potential, driven by the increasing demand for the transportation of various chemicals and hazardous materials.
Food Sector: The food and beverage industry's reliance on tanker trucks for transporting liquids, such as dairy products, juices, and syrups, fuels moderate growth in this segment.
Key Growth Drivers:
Infrastructure Development: Investments in infrastructure, particularly highway improvements, facilitate efficient tanker transportation.
Government Policies: Supportive government policies related to infrastructure development and the adoption of sustainable transport solutions will drive further growth.
US Tanker Truck Market Product Analysis
Technological advancements are leading to the development of more fuel-efficient, safer, and environmentally friendly tanker trucks. These advancements include improved aerodynamics, lightweight materials, advanced driver-assistance systems, and the adoption of alternative fuels (e.g., CNG, LNG, electric). The market fit for these innovations is largely determined by factors such as cost-effectiveness, regulatory compliance, and end-user preferences. The successful integration of telematics systems is also enhancing operational efficiency and fleet management.
Key Drivers, Barriers & Challenges in US Tanker Truck MARKET
Key Drivers:
The market is propelled by increasing demand from key sectors, technological advancements, and supportive government policies aimed at improving transportation efficiency and sustainability. The ongoing expansion of the infrastructure network further aids growth.
Challenges and Restraints:
Stringent emission regulations impose significant compliance costs on operators. Supply chain disruptions, particularly in the procurement of components, create production bottlenecks. Intense competition among existing players and the emergence of new entrants place pressure on pricing and profitability. These factors collectively exert a quantifiable negative impact on market growth, estimated to be xx% reduction in growth by 2030.
Growth Drivers in the US TANKER TRUCK MARKET Market
Growth is primarily driven by increasing demand from end-use sectors, technological improvements leading to enhanced efficiency and safety, and supportive government initiatives to promote sustainable transportation. Fuel efficiency regulations and investments in infrastructure also stimulate market expansion.
Challenges Impacting US TANKER TRUCK MARKET Growth
Significant challenges include the high initial cost of adopting new technologies (e.g., electric vehicles), stringent emission regulations, fluctuating fuel prices, and potential supply chain disruptions impacting the availability of parts and vehicles. Driver shortages also pose a considerable challenge to the industry.
Key Players Shaping the US TANKER TRUCK MARKET Market
Significant US TANKER TRUCK MARKET Industry Milestones
December 2023: Trina Solar launches its Trina-branded trucks for transporting PV modules, signaling a shift towards electric vehicles in its delivery fleet starting in 2024. This represents a significant move toward sustainable transportation within the industry.
April 2023: Daimler Truck unveils Rizon, a new brand of medium-duty electric trucks, specifically for the US market. This marks a major step towards electrifying the medium-duty segment of the tanker truck industry.
Future Outlook for US TANKER TRUCK MARKET Market
The US tanker truck market is expected to witness robust growth driven by increasing demand from diverse sectors, ongoing technological innovations (especially in electrification and automation), and supportive government policies. Strategic investments in fleet modernization and the adoption of sustainable transportation practices will be crucial for companies to thrive in this evolving market. The transition to electric and alternative fuel vehicles presents both challenges and significant opportunities for market players.
US TANKER TRUCK MARKET Segmentation
-
1. Capacity
- 1.1. Less Than 1, 000 Gallons
- 1.2. Between 1, 000 Gallons and 4, 000 Gallons
- 1.3. More Than 4, 000 Gallons
-
2. Sector Type
- 2.1. Oil and Gas Industry
- 2.2. Food Sector
- 2.3. Healthcare Sector
- 2.4. Water Treatment Facilities
- 2.5. Chemical Industry
- 2.6. Construction
- 2.7. Waste Management
- 2.8. Other Sectors
US TANKER TRUCK MARKET Segmentation By Geography
-
1. North America
- 1.1. United States
- 1.2. Canada
- 1.3. Mexico
-
2. South America
- 2.1. Brazil
- 2.2. Argentina
- 2.3. Rest of South America
-
3. Europe
- 3.1. United Kingdom
- 3.2. Germany
- 3.3. France
- 3.4. Italy
- 3.5. Spain
- 3.6. Russia
- 3.7. Benelux
- 3.8. Nordics
- 3.9. Rest of Europe
-
4. Middle East & Africa
- 4.1. Turkey
- 4.2. Israel
- 4.3. GCC
- 4.4. North Africa
- 4.5. South Africa
- 4.6. Rest of Middle East & Africa
-
5. Asia Pacific
- 5.1. China
- 5.2. India
- 5.3. Japan
- 5.4. South Korea
- 5.5. ASEAN
- 5.6. Oceania
- 5.7. Rest of Asia Pacific
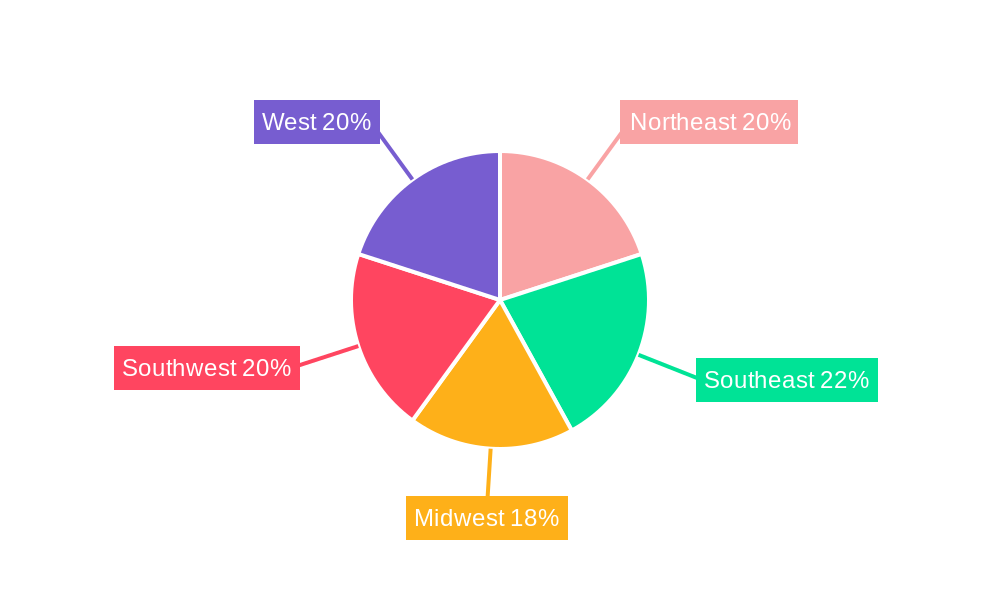
US TANKER TRUCK MARKET Regional Market Share
Geographic Coverage of US TANKER TRUCK MARKET
US TANKER TRUCK MARKET REPORT HIGHLIGHTS
| Aspects | Details |
|---|---|
| Study Period | 2020-2034 |
| Base Year | 2025 |
| Estimated Year | 2026 |
| Forecast Period | 2026-2034 |
| Historical Period | 2020-2025 |
| Growth Rate | CAGR of 5.03% from 2020-2034 |
| Segmentation |
|
Table of Contents
- 1. Introduction
- 1.1. Research Scope
- 1.2. Market Segmentation
- 1.3. Research Objective
- 1.4. Definitions and Assumptions
- 2. Executive Summary
- 2.1. Market Snapshot
- 3. Market Dynamics
- 3.1. Market Drivers
- 3.2. Market Restrains
- 3.3. Market Trends
- 3.4. Market Opportunities
- 4. Market Factor Analysis
- 4.1. Porters Five Forces
- 4.1.1. Bargaining Power of Suppliers
- 4.1.2. Bargaining Power of Buyers
- 4.1.3. Threat of New Entrants
- 4.1.4. Threat of Substitutes
- 4.1.5. Competitive Rivalry
- 4.2. PESTEL analysis
- 4.3. BCG Analysis
- 4.3.1. Stars (High Growth, High Market Share)
- 4.3.2. Cash Cows (Low Growth, High Market Share)
- 4.3.3. Question Mark (High Growth, Low Market Share)
- 4.3.4. Dogs (Low Growth, Low Market Share)
- 4.4. Ansoff Matrix Analysis
- 4.5. Supply Chain Analysis
- 4.6. Regulatory Landscape
- 4.7. Current Market Potential and Opportunity Assessment (TAM–SAM–SOM Framework)
- 4.8. TIR Analyst Note
- 4.1. Porters Five Forces
- 5. Market Analysis, Insights and Forecast 2021-2033
- 5.1. Market Analysis, Insights and Forecast - by Capacity
- 5.1.1. Less Than 1, 000 Gallons
- 5.1.2. Between 1, 000 Gallons and 4, 000 Gallons
- 5.1.3. More Than 4, 000 Gallons
- 5.2. Market Analysis, Insights and Forecast - by Sector Type
- 5.2.1. Oil and Gas Industry
- 5.2.2. Food Sector
- 5.2.3. Healthcare Sector
- 5.2.4. Water Treatment Facilities
- 5.2.5. Chemical Industry
- 5.2.6. Construction
- 5.2.7. Waste Management
- 5.2.8. Other Sectors
- 5.3. Market Analysis, Insights and Forecast - by Region
- 5.3.1. North America
- 5.3.2. South America
- 5.3.3. Europe
- 5.3.4. Middle East & Africa
- 5.3.5. Asia Pacific
- 5.1. Market Analysis, Insights and Forecast - by Capacity
- 6. Global US TANKER TRUCK MARKET Analysis, Insights and Forecast, 2021-2033
- 6.1. Market Analysis, Insights and Forecast - by Capacity
- 6.1.1. Less Than 1, 000 Gallons
- 6.1.2. Between 1, 000 Gallons and 4, 000 Gallons
- 6.1.3. More Than 4, 000 Gallons
- 6.2. Market Analysis, Insights and Forecast - by Sector Type
- 6.2.1. Oil and Gas Industry
- 6.2.2. Food Sector
- 6.2.3. Healthcare Sector
- 6.2.4. Water Treatment Facilities
- 6.2.5. Chemical Industry
- 6.2.6. Construction
- 6.2.7. Waste Management
- 6.2.8. Other Sectors
- 6.1. Market Analysis, Insights and Forecast - by Capacity
- 7. North America US TANKER TRUCK MARKET Analysis, Insights and Forecast, 2020-2032
- 7.1. Market Analysis, Insights and Forecast - by Capacity
- 7.1.1. Less Than 1, 000 Gallons
- 7.1.2. Between 1, 000 Gallons and 4, 000 Gallons
- 7.1.3. More Than 4, 000 Gallons
- 7.2. Market Analysis, Insights and Forecast - by Sector Type
- 7.2.1. Oil and Gas Industry
- 7.2.2. Food Sector
- 7.2.3. Healthcare Sector
- 7.2.4. Water Treatment Facilities
- 7.2.5. Chemical Industry
- 7.2.6. Construction
- 7.2.7. Waste Management
- 7.2.8. Other Sectors
- 7.1. Market Analysis, Insights and Forecast - by Capacity
- 8. South America US TANKER TRUCK MARKET Analysis, Insights and Forecast, 2020-2032
- 8.1. Market Analysis, Insights and Forecast - by Capacity
- 8.1.1. Less Than 1, 000 Gallons
- 8.1.2. Between 1, 000 Gallons and 4, 000 Gallons
- 8.1.3. More Than 4, 000 Gallons
- 8.2. Market Analysis, Insights and Forecast - by Sector Type
- 8.2.1. Oil and Gas Industry
- 8.2.2. Food Sector
- 8.2.3. Healthcare Sector
- 8.2.4. Water Treatment Facilities
- 8.2.5. Chemical Industry
- 8.2.6. Construction
- 8.2.7. Waste Management
- 8.2.8. Other Sectors
- 8.1. Market Analysis, Insights and Forecast - by Capacity
- 9. Europe US TANKER TRUCK MARKET Analysis, Insights and Forecast, 2020-2032
- 9.1. Market Analysis, Insights and Forecast - by Capacity
- 9.1.1. Less Than 1, 000 Gallons
- 9.1.2. Between 1, 000 Gallons and 4, 000 Gallons
- 9.1.3. More Than 4, 000 Gallons
- 9.2. Market Analysis, Insights and Forecast - by Sector Type
- 9.2.1. Oil and Gas Industry
- 9.2.2. Food Sector
- 9.2.3. Healthcare Sector
- 9.2.4. Water Treatment Facilities
- 9.2.5. Chemical Industry
- 9.2.6. Construction
- 9.2.7. Waste Management
- 9.2.8. Other Sectors
- 9.1. Market Analysis, Insights and Forecast - by Capacity
- 10. Middle East & Africa US TANKER TRUCK MARKET Analysis, Insights and Forecast, 2020-2032
- 10.1. Market Analysis, Insights and Forecast - by Capacity
- 10.1.1. Less Than 1, 000 Gallons
- 10.1.2. Between 1, 000 Gallons and 4, 000 Gallons
- 10.1.3. More Than 4, 000 Gallons
- 10.2. Market Analysis, Insights and Forecast - by Sector Type
- 10.2.1. Oil and Gas Industry
- 10.2.2. Food Sector
- 10.2.3. Healthcare Sector
- 10.2.4. Water Treatment Facilities
- 10.2.5. Chemical Industry
- 10.2.6. Construction
- 10.2.7. Waste Management
- 10.2.8. Other Sectors
- 10.1. Market Analysis, Insights and Forecast - by Capacity
- 11. Asia Pacific US TANKER TRUCK MARKET Analysis, Insights and Forecast, 2020-2032
- 11.1. Market Analysis, Insights and Forecast - by Capacity
- 11.1.1. Less Than 1, 000 Gallons
- 11.1.2. Between 1, 000 Gallons and 4, 000 Gallons
- 11.1.3. More Than 4, 000 Gallons
- 11.2. Market Analysis, Insights and Forecast - by Sector Type
- 11.2.1. Oil and Gas Industry
- 11.2.2. Food Sector
- 11.2.3. Healthcare Sector
- 11.2.4. Water Treatment Facilities
- 11.2.5. Chemical Industry
- 11.2.6. Construction
- 11.2.7. Waste Management
- 11.2.8. Other Sectors
- 11.1. Market Analysis, Insights and Forecast - by Capacity
- 12. Competitive Analysis
- 12.1. Company Profiles
- 12.1.1 Freightliner Trucks
- 12.1.1.1. Company Overview
- 12.1.1.2. Products
- 12.1.1.3. Company Financials
- 12.1.1.4. SWOT Analysis
- 12.1.2 Iveco
- 12.1.2.1. Company Overview
- 12.1.2.2. Products
- 12.1.2.3. Company Financials
- 12.1.2.4. SWOT Analysis
- 12.1.3 Scania AB
- 12.1.3.1. Company Overview
- 12.1.3.2. Products
- 12.1.3.3. Company Financials
- 12.1.3.4. SWOT Analysis
- 12.1.4 Daimler AG
- 12.1.4.1. Company Overview
- 12.1.4.2. Products
- 12.1.4.3. Company Financials
- 12.1.4.4. SWOT Analysis
- 12.1.5 Tata Motors Limited
- 12.1.5.1. Company Overview
- 12.1.5.2. Products
- 12.1.5.3. Company Financials
- 12.1.5.4. SWOT Analysis
- 12.1.6 Volvo Group
- 12.1.6.1. Company Overview
- 12.1.6.2. Products
- 12.1.6.3. Company Financials
- 12.1.6.4. SWOT Analysis
- 12.1.7 Navistar International Corporation
- 12.1.7.1. Company Overview
- 12.1.7.2. Products
- 12.1.7.3. Company Financials
- 12.1.7.4. SWOT Analysis
- 12.1.8 Hyundai Motor Company
- 12.1.8.1. Company Overview
- 12.1.8.2. Products
- 12.1.8.3. Company Financials
- 12.1.8.4. SWOT Analysis
- 12.1.9 Polar Tank Trailer*List Not Exhaustive
- 12.1.9.1. Company Overview
- 12.1.9.2. Products
- 12.1.9.3. Company Financials
- 12.1.9.4. SWOT Analysis
- 12.1.10 Kenworth
- 12.1.10.1. Company Overview
- 12.1.10.2. Products
- 12.1.10.3. Company Financials
- 12.1.10.4. SWOT Analysis
- 12.1.11 MAN Truck & Bus AG
- 12.1.11.1. Company Overview
- 12.1.11.2. Products
- 12.1.11.3. Company Financials
- 12.1.11.4. SWOT Analysis
- 12.1.1 Freightliner Trucks
- 12.2. Market Entropy
- 12.2.1 Company's Key Areas Served
- 12.2.2 Recent Developments
- 12.3. Company Market Share Analysis 2025
- 12.3.1 Top 5 Companies Market Share Analysis
- 12.3.2 Top 3 Companies Market Share Analysis
- 12.4. List of Potential Customers
- 13. Research Methodology
List of Figures
- Figure 1: Global US TANKER TRUCK MARKET Revenue Breakdown (Million, %) by Region 2025 & 2033
- Figure 2: North America US TANKER TRUCK MARKET Revenue (Million), by Capacity 2025 & 2033
- Figure 3: North America US TANKER TRUCK MARKET Revenue Share (%), by Capacity 2025 & 2033
- Figure 4: North America US TANKER TRUCK MARKET Revenue (Million), by Sector Type 2025 & 2033
- Figure 5: North America US TANKER TRUCK MARKET Revenue Share (%), by Sector Type 2025 & 2033
- Figure 6: North America US TANKER TRUCK MARKET Revenue (Million), by Country 2025 & 2033
- Figure 7: North America US TANKER TRUCK MARKET Revenue Share (%), by Country 2025 & 2033
- Figure 8: South America US TANKER TRUCK MARKET Revenue (Million), by Capacity 2025 & 2033
- Figure 9: South America US TANKER TRUCK MARKET Revenue Share (%), by Capacity 2025 & 2033
- Figure 10: South America US TANKER TRUCK MARKET Revenue (Million), by Sector Type 2025 & 2033
- Figure 11: South America US TANKER TRUCK MARKET Revenue Share (%), by Sector Type 2025 & 2033
- Figure 12: South America US TANKER TRUCK MARKET Revenue (Million), by Country 2025 & 2033
- Figure 13: South America US TANKER TRUCK MARKET Revenue Share (%), by Country 2025 & 2033
- Figure 14: Europe US TANKER TRUCK MARKET Revenue (Million), by Capacity 2025 & 2033
- Figure 15: Europe US TANKER TRUCK MARKET Revenue Share (%), by Capacity 2025 & 2033
- Figure 16: Europe US TANKER TRUCK MARKET Revenue (Million), by Sector Type 2025 & 2033
- Figure 17: Europe US TANKER TRUCK MARKET Revenue Share (%), by Sector Type 2025 & 2033
- Figure 18: Europe US TANKER TRUCK MARKET Revenue (Million), by Country 2025 & 2033
- Figure 19: Europe US TANKER TRUCK MARKET Revenue Share (%), by Country 2025 & 2033
- Figure 20: Middle East & Africa US TANKER TRUCK MARKET Revenue (Million), by Capacity 2025 & 2033
- Figure 21: Middle East & Africa US TANKER TRUCK MARKET Revenue Share (%), by Capacity 2025 & 2033
- Figure 22: Middle East & Africa US TANKER TRUCK MARKET Revenue (Million), by Sector Type 2025 & 2033
- Figure 23: Middle East & Africa US TANKER TRUCK MARKET Revenue Share (%), by Sector Type 2025 & 2033
- Figure 24: Middle East & Africa US TANKER TRUCK MARKET Revenue (Million), by Country 2025 & 2033
- Figure 25: Middle East & Africa US TANKER TRUCK MARKET Revenue Share (%), by Country 2025 & 2033
- Figure 26: Asia Pacific US TANKER TRUCK MARKET Revenue (Million), by Capacity 2025 & 2033
- Figure 27: Asia Pacific US TANKER TRUCK MARKET Revenue Share (%), by Capacity 2025 & 2033
- Figure 28: Asia Pacific US TANKER TRUCK MARKET Revenue (Million), by Sector Type 2025 & 2033
- Figure 29: Asia Pacific US TANKER TRUCK MARKET Revenue Share (%), by Sector Type 2025 & 2033
- Figure 30: Asia Pacific US TANKER TRUCK MARKET Revenue (Million), by Country 2025 & 2033
- Figure 31: Asia Pacific US TANKER TRUCK MARKET Revenue Share (%), by Country 2025 & 2033
List of Tables
- Table 1: Global US TANKER TRUCK MARKET Revenue Million Forecast, by Capacity 2020 & 2033
- Table 2: Global US TANKER TRUCK MARKET Revenue Million Forecast, by Sector Type 2020 & 2033
- Table 3: Global US TANKER TRUCK MARKET Revenue Million Forecast, by Region 2020 & 2033
- Table 4: Global US TANKER TRUCK MARKET Revenue Million Forecast, by Capacity 2020 & 2033
- Table 5: Global US TANKER TRUCK MARKET Revenue Million Forecast, by Sector Type 2020 & 2033
- Table 6: Global US TANKER TRUCK MARKET Revenue Million Forecast, by Country 2020 & 2033
- Table 7: United States US TANKER TRUCK MARKET Revenue (Million) Forecast, by Application 2020 & 2033
- Table 8: Canada US TANKER TRUCK MARKET Revenue (Million) Forecast, by Application 2020 & 2033
- Table 9: Mexico US TANKER TRUCK MARKET Revenue (Million) Forecast, by Application 2020 & 2033
- Table 10: Global US TANKER TRUCK MARKET Revenue Million Forecast, by Capacity 2020 & 2033
- Table 11: Global US TANKER TRUCK MARKET Revenue Million Forecast, by Sector Type 2020 & 2033
- Table 12: Global US TANKER TRUCK MARKET Revenue Million Forecast, by Country 2020 & 2033
- Table 13: Brazil US TANKER TRUCK MARKET Revenue (Million) Forecast, by Application 2020 & 2033
- Table 14: Argentina US TANKER TRUCK MARKET Revenue (Million) Forecast, by Application 2020 & 2033
- Table 15: Rest of South America US TANKER TRUCK MARKET Revenue (Million) Forecast, by Application 2020 & 2033
- Table 16: Global US TANKER TRUCK MARKET Revenue Million Forecast, by Capacity 2020 & 2033
- Table 17: Global US TANKER TRUCK MARKET Revenue Million Forecast, by Sector Type 2020 & 2033
- Table 18: Global US TANKER TRUCK MARKET Revenue Million Forecast, by Country 2020 & 2033
- Table 19: United Kingdom US TANKER TRUCK MARKET Revenue (Million) Forecast, by Application 2020 & 2033
- Table 20: Germany US TANKER TRUCK MARKET Revenue (Million) Forecast, by Application 2020 & 2033
- Table 21: France US TANKER TRUCK MARKET Revenue (Million) Forecast, by Application 2020 & 2033
- Table 22: Italy US TANKER TRUCK MARKET Revenue (Million) Forecast, by Application 2020 & 2033
- Table 23: Spain US TANKER TRUCK MARKET Revenue (Million) Forecast, by Application 2020 & 2033
- Table 24: Russia US TANKER TRUCK MARKET Revenue (Million) Forecast, by Application 2020 & 2033
- Table 25: Benelux US TANKER TRUCK MARKET Revenue (Million) Forecast, by Application 2020 & 2033
- Table 26: Nordics US TANKER TRUCK MARKET Revenue (Million) Forecast, by Application 2020 & 2033
- Table 27: Rest of Europe US TANKER TRUCK MARKET Revenue (Million) Forecast, by Application 2020 & 2033
- Table 28: Global US TANKER TRUCK MARKET Revenue Million Forecast, by Capacity 2020 & 2033
- Table 29: Global US TANKER TRUCK MARKET Revenue Million Forecast, by Sector Type 2020 & 2033
- Table 30: Global US TANKER TRUCK MARKET Revenue Million Forecast, by Country 2020 & 2033
- Table 31: Turkey US TANKER TRUCK MARKET Revenue (Million) Forecast, by Application 2020 & 2033
- Table 32: Israel US TANKER TRUCK MARKET Revenue (Million) Forecast, by Application 2020 & 2033
- Table 33: GCC US TANKER TRUCK MARKET Revenue (Million) Forecast, by Application 2020 & 2033
- Table 34: North Africa US TANKER TRUCK MARKET Revenue (Million) Forecast, by Application 2020 & 2033
- Table 35: South Africa US TANKER TRUCK MARKET Revenue (Million) Forecast, by Application 2020 & 2033
- Table 36: Rest of Middle East & Africa US TANKER TRUCK MARKET Revenue (Million) Forecast, by Application 2020 & 2033
- Table 37: Global US TANKER TRUCK MARKET Revenue Million Forecast, by Capacity 2020 & 2033
- Table 38: Global US TANKER TRUCK MARKET Revenue Million Forecast, by Sector Type 2020 & 2033
- Table 39: Global US TANKER TRUCK MARKET Revenue Million Forecast, by Country 2020 & 2033
- Table 40: China US TANKER TRUCK MARKET Revenue (Million) Forecast, by Application 2020 & 2033
- Table 41: India US TANKER TRUCK MARKET Revenue (Million) Forecast, by Application 2020 & 2033
- Table 42: Japan US TANKER TRUCK MARKET Revenue (Million) Forecast, by Application 2020 & 2033
- Table 43: South Korea US TANKER TRUCK MARKET Revenue (Million) Forecast, by Application 2020 & 2033
- Table 44: ASEAN US TANKER TRUCK MARKET Revenue (Million) Forecast, by Application 2020 & 2033
- Table 45: Oceania US TANKER TRUCK MARKET Revenue (Million) Forecast, by Application 2020 & 2033
- Table 46: Rest of Asia Pacific US TANKER TRUCK MARKET Revenue (Million) Forecast, by Application 2020 & 2033
Frequently Asked Questions
1. What is the projected Compound Annual Growth Rate (CAGR) of the US TANKER TRUCK MARKET?
The projected CAGR is approximately 5.03%.
2. Which companies are prominent players in the US TANKER TRUCK MARKET?
Key companies in the market include Freightliner Trucks, Iveco, Scania AB, Daimler AG, Tata Motors Limited, Volvo Group, Navistar International Corporation, Hyundai Motor Company, Polar Tank Trailer*List Not Exhaustive, Kenworth, MAN Truck & Bus AG.
3. What are the main segments of the US TANKER TRUCK MARKET?
The market segments include Capacity, Sector Type.
4. Can you provide details about the market size?
The market size is estimated to be USD 26.74 Million as of 2022.
5. What are some drivers contributing to market growth?
Increased Vehicle Sales to Fuel Market Growth.
6. What are the notable trends driving market growth?
Between 1. 000 Gallons and 4. 000 Gallons Tanker Truck is Dominating the Market.
7. Are there any restraints impacting market growth?
N/A
8. Can you provide examples of recent developments in the market?
In December 2023, Trina Solar, a provider of intelligent solar solutions, introduced its latest lineup of Trina-branded trucks to transport photovoltaic (PV) modules for large-scale solar projects across the United States.
9. What pricing options are available for accessing the report?
Pricing options include single-user, multi-user, and enterprise licenses priced at USD 3800, USD 4500, and USD 5800 respectively.
10. Is the market size provided in terms of value or volume?
The market size is provided in terms of value, measured in Million.
11. Are there any specific market keywords associated with the report?
Yes, the market keyword associated with the report is "US TANKER TRUCK MARKET," which aids in identifying and referencing the specific market segment covered.
12. How do I determine which pricing option suits my needs best?
The pricing options vary based on user requirements and access needs. Individual users may opt for single-user licenses, while businesses requiring broader access may choose multi-user or enterprise licenses for cost-effective access to the report.
13. Are there any additional resources or data provided in the US TANKER TRUCK MARKET report?
While the report offers comprehensive insights, it's advisable to review the specific contents or supplementary materials provided to ascertain if additional resources or data are available.
14. How can I stay updated on further developments or reports in the US TANKER TRUCK MARKET?
To stay informed about further developments, trends, and reports in the US TANKER TRUCK MARKET, consider subscribing to industry newsletters, following relevant companies and organizations, or regularly checking reputable industry news sources and publications.
Methodology
Step 1 - Identification of Relevant Samples Size from Population Database


Step 2 - Approaches for Defining Global Market Size (Value, Volume* & Price*)

Note*: In applicable scenarios
Step 3 - Data Sources
Primary Research
- Web Analytics
- Survey Reports
- Research Institute
- Latest Research Reports
- Opinion Leaders
Secondary Research
- Annual Reports
- White Paper
- Latest Press Release
- Industry Association
- Paid Database
- Investor Presentations

Step 4 - Data Triangulation
Involves using different sources of information in order to increase the validity of a study
These sources are likely to be stakeholders in a program - participants, other researchers, program staff, other community members, and so on.
Then we put all data in single framework & apply various statistical tools to find out the dynamic on the market.
During the analysis stage, feedback from the stakeholder groups would be compared to determine areas of agreement as well as areas of divergence