

Key Insights
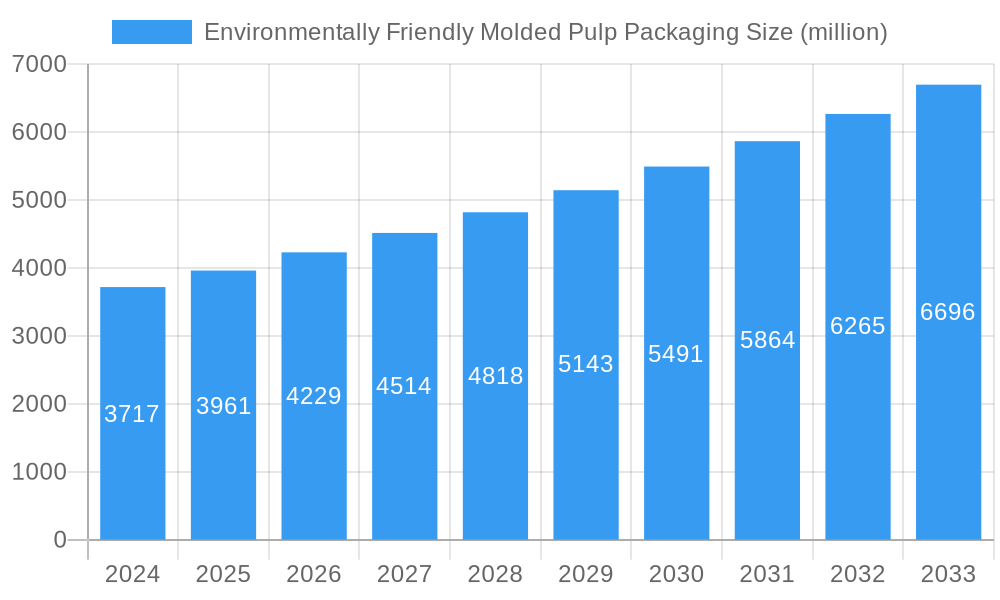
The global Environmentally Friendly Molded Pulp Packaging market is poised for significant expansion, projected to reach USD 3961 million by 2025, exhibiting a robust Compound Annual Growth Rate (CAGR) of 6.7% throughout the forecast period of 2025-2033. This growth is propelled by a confluence of escalating consumer demand for sustainable alternatives to traditional plastics, stringent government regulations aimed at curbing plastic waste, and increasing corporate commitments to environmental responsibility. The food and beverage sector, driven by the need for eco-conscious packaging solutions for products ranging from takeout containers to egg cartons, represents a primary application segment. Industrial applications, encompassing protective packaging for electronics, automotive parts, and consumer goods, are also witnessing substantial adoption due to their ability to offer custom-fit, shock-absorbent, and biodegradable cushioning. The medical sector, while smaller, is emerging with applications in sterile packaging and disposable medical devices, prioritizing hygiene and environmental disposal.
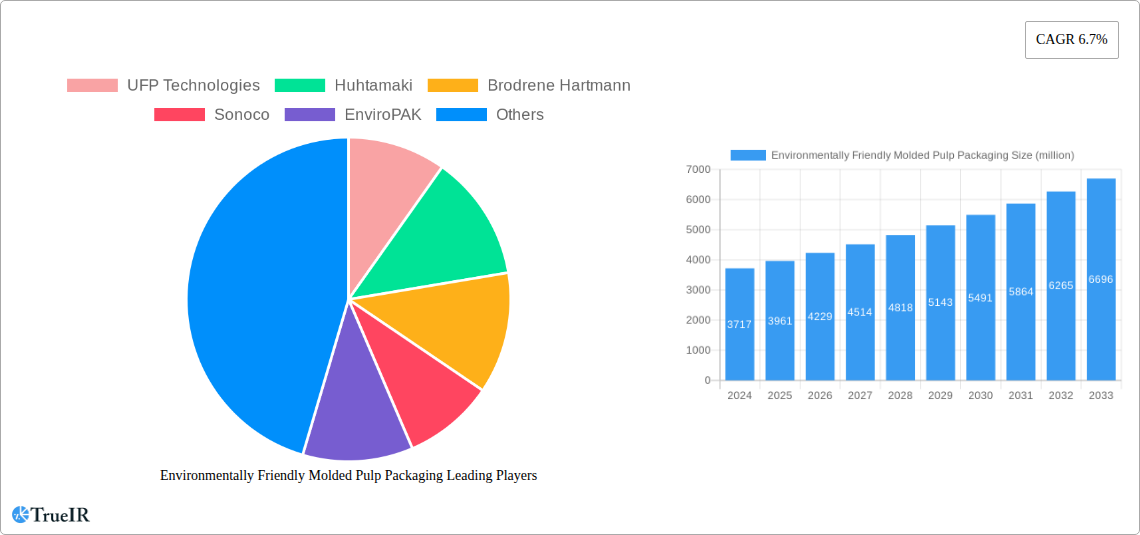
Environmentally Friendly Molded Pulp Packaging Market Size (In Billion)
Key trends shaping this market include advancements in pulp processing technologies that enhance the strength, water resistance, and aesthetic appeal of molded pulp, thereby broadening its application scope. The emphasis on closed-loop systems and the increasing availability of recycled paper as a feedstock are further strengthening the sustainability narrative. However, the market is not without its challenges. Restrains such as the perceived limitations in high-barrier properties compared to certain plastics for specific applications, and the initial capital investment required for setting up advanced manufacturing facilities, could temper growth in niche areas. Despite these hurdles, the overwhelming shift towards a circular economy and the clear environmental benefits of molded pulp packaging are expected to outweigh these limitations, driving consistent market penetration across diverse industries and regions. The competitive landscape is characterized by a mix of established players and emerging innovators, all vying to capture market share through product innovation, strategic partnerships, and cost-effective production.
Environmentally Friendly Molded Pulp Packaging Company Market Share
Environmentally Friendly Molded Pulp Packaging Market: A Comprehensive Analysis and Forecast (2019-2033)
This in-depth report provides a detailed examination of the global environmentally friendly molded pulp packaging market, spanning the historical period of 2019–2024, the base and estimated year of 2025, and a comprehensive forecast extending to 2033. We delve into market dynamics, key players, trends, opportunities, and challenges, offering actionable insights for industry stakeholders. The report is structured for maximum clarity and SEO optimization, utilizing high-volume keywords relevant to sustainable packaging solutions.
Environmentally Friendly Molded Pulp Packaging Market Structure & Competitive Landscape
The environmentally friendly molded pulp packaging market exhibits a moderately concentrated landscape, with a blend of large multinational corporations and specialized regional players. Major companies such as UFP Technologies, Huhtamaki, and Brodrene Hartmann command significant market share due to their established infrastructure, R&D capabilities, and extensive product portfolios. Innovation drivers are primarily fueled by the escalating demand for sustainable alternatives to traditional plastics, a growing awareness of environmental concerns among consumers, and stricter government regulations. Product substitutes, while present in the form of other eco-friendly materials like cardboard and bioplastics, often face cost or performance limitations compared to molded pulp for specific applications.
Key aspects of the market structure include:
- Market Concentration: While top-tier players hold substantial portions of the market, numerous smaller and medium-sized enterprises contribute to market dynamism and cater to niche segments. The top 5 companies are estimated to hold approximately 45 million of the global market share.
- Innovation Drivers:
- Development of advanced molding techniques for enhanced strength and aesthetics.
- Research into novel fiber sources and treatments for improved water resistance and grease barrier properties.
- Focus on lightweighting to reduce shipping costs and environmental impact.
- Regulatory Impacts: Government mandates promoting recycled content and restricting single-use plastics are a significant impetus for growth. For instance, regions with advanced circular economy policies are seeing accelerated adoption.
- Product Substitutes: While alternatives exist, molded pulp offers a compelling balance of biodegradability, compostability, and cost-effectiveness for many applications.
- End-User Segmentation: Diversified end-user demand, from food and beverage to medical and industrial sectors, drives segment-specific innovation.
- M&A Trends: Mergers and acquisitions are observed as larger companies seek to expand their product offerings, geographical reach, and technological capabilities. Over the historical period, approximately 15 million in M&A deals were recorded, indicating strategic consolidation.
Environmentally Friendly Molded Pulp Packaging Market Trends & Opportunities
The global environmentally friendly molded pulp packaging market is poised for substantial expansion, driven by a confluence of evolving consumer preferences, stringent environmental regulations, and technological advancements. During the study period (2019-2033), the market is projected to witness a robust Compound Annual Growth Rate (CAGR) of approximately 7.5%. This growth trajectory is underpinned by the increasing global awareness of plastic pollution and a collective shift towards circular economy principles. Consumers are actively seeking out brands that demonstrate a commitment to sustainability, leading to a surge in demand for packaging materials that are recyclable, compostable, and biodegradable.
Technological shifts are playing a pivotal role in enhancing the appeal and functionality of molded pulp packaging. Innovations in fiber processing, such as the use of post-consumer recycled paper and cardboard, are making the production process more sustainable and cost-effective. Furthermore, advancements in molding techniques are enabling manufacturers to create more complex shapes, improve surface finishes, and enhance the structural integrity of molded pulp products. This allows for greater design flexibility, making molded pulp a viable alternative for a wider array of applications previously dominated by plastics. For example, improvements in water and grease resistance are opening up new opportunities in the food and beverage sector, traditionally a challenging area for paper-based packaging.
Competitive dynamics are intensifying as established players and new entrants vie for market share. Companies are investing heavily in research and development to optimize their production processes, develop innovative product designs, and expand their geographical footprint. Strategic partnerships and collaborations are also becoming more prevalent, facilitating the sharing of expertise and resources to accelerate innovation and market penetration. The market penetration rate for environmentally friendly molded pulp packaging, currently estimated at around 28 million units in the base year of 2025, is expected to climb steadily as its advantages become more widely recognized and adopted.
Opportunities abound for companies that can effectively address the growing demand for sustainable packaging solutions. The food and beverage industry, with its vast packaging needs, represents a significant growth segment. The medical sector, demanding sterile and protective packaging, is another area where molded pulp is gaining traction due to its ability to be sterilized and its eco-friendly credentials. The industrial sector also presents opportunities, particularly for protective packaging for electronics and sensitive components.
Key opportunities identified include:
- Expansion into Emerging Markets: Growing environmental consciousness in developing economies presents a significant untapped market.
- Development of High-Performance Molded Pulp: Investing in R&D to create molded pulp with enhanced barrier properties (moisture, grease, oxygen) will unlock further applications.
- Customized Solutions: Offering tailored packaging designs for specific product requirements will appeal to a broad range of industries.
- Focus on Circularity: Emphasizing the closed-loop nature of molded pulp, from recycled content to end-of-life compostability, aligns with consumer and regulatory expectations.
The global market size for environmentally friendly molded pulp packaging is projected to reach over 90 million by the end of the forecast period, underscoring its robust growth potential.
Dominant Markets & Segments in Environmentally Friendly Molded Pulp Packaging
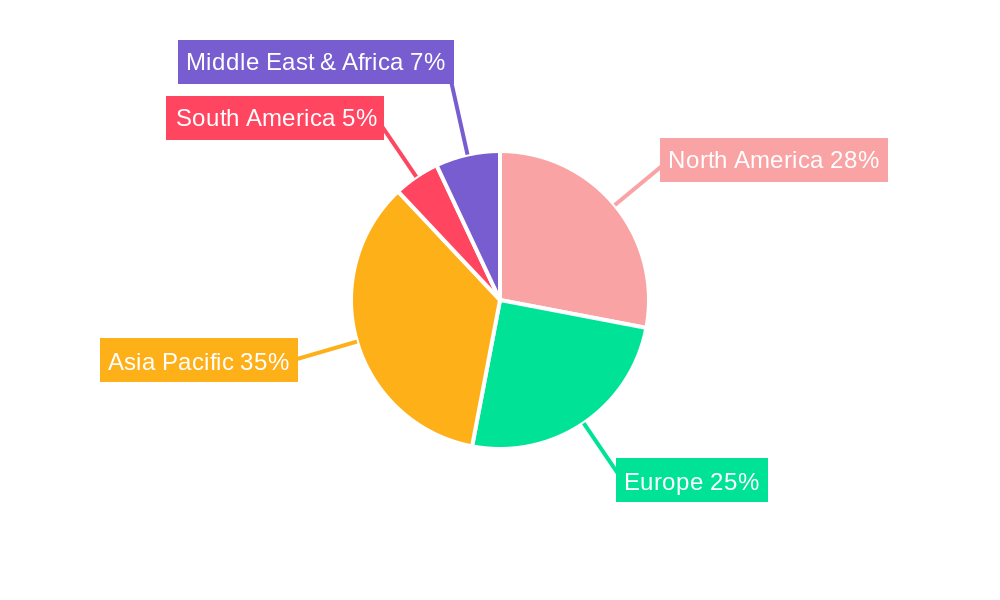
The environmentally friendly molded pulp packaging market is experiencing dynamic growth across various regions and application segments. Currently, North America stands as the dominant region, driven by a strong consumer preference for sustainable products and a robust regulatory framework that actively promotes eco-friendly packaging solutions. Within North America, the United States leads the market due to its large consumer base, significant industrial activity, and widespread adoption of recycling and composting initiatives. The estimated market value in the United States alone is projected to reach 30 million by 2025.
The Food and Beverage application segment is the largest and fastest-growing segment within the molded pulp packaging market. This dominance is fueled by the sector's immense packaging requirements and the increasing pressure from consumers and regulators to move away from single-use plastics. Molded pulp's ability to be molded into various shapes, its protective qualities, and its compostable nature make it an ideal choice for packaging items like egg cartons, trays for fruits and vegetables, takeout containers, and beverage carriers. The sheer volume of consumption in this sector translates to a substantial demand for molded pulp packaging, projected to contribute over 55 million to the global market by 2033.
Key growth drivers for the Food and Beverage segment include:
- Consumer Demand for Sustainable Options: A growing segment of consumers actively seeks out products packaged in environmentally responsible materials.
- Regulatory Bans on Single-Use Plastics: Many jurisdictions are implementing bans or restrictions on certain plastic packaging, pushing food and beverage companies towards alternatives like molded pulp.
- Versatility in Design: Molded pulp can be engineered to meet specific needs, such as insulation, shock absorption, and grease resistance, enhancing its suitability for a wide range of food products.
- Brand Image Enhancement: Companies are leveraging sustainable packaging to improve their brand perception and appeal to environmentally conscious consumers.
The Recyclable type of molded pulp packaging holds a commanding market share, reflecting the global emphasis on circular economy principles. The ease with which molded pulp can be recycled and repurposed aligns perfectly with waste reduction goals. While non-recyclable molded pulp solutions exist, particularly for specialized applications requiring advanced barrier properties or specific functionalities, the market predominantly favors materials that can be reintegrated into the product lifecycle. The projected market size for recyclable molded pulp is expected to exceed 70 million by 2033.
Other significant growth drivers and market insights include:
- Industrial Segment Growth: The industrial segment is experiencing steady growth, driven by the need for protective packaging for electronics, automotive parts, and other manufactured goods. Molded pulp provides excellent cushioning and shock absorption properties.
- Medical Segment Potential: The medical sector is a burgeoning area for molded pulp, especially for disposable items and sterile packaging, where its compostability and ability to withstand sterilization processes are advantageous.
- Emerging Markets: Regions like Asia-Pacific are showing rapid adoption due to increasing environmental awareness and government initiatives to promote sustainable packaging. China, in particular, is a significant player, with its large manufacturing base and growing domestic demand for eco-friendly products. The market in China is projected to reach 15 million by 2025.
Environmentally Friendly Molded Pulp Packaging Product Analysis
Environmentally friendly molded pulp packaging represents a significant advancement in sustainable material science. Its primary advantage lies in its derivation from renewable resources and its end-of-life compostability and biodegradability, offering a compelling alternative to petroleum-based plastics. Product innovations focus on enhancing its functional attributes, such as improving water and grease resistance through advanced fiber treatments and barrier coatings, which are crucial for expanding its application in the food and beverage sector. Furthermore, advancements in molding technologies allow for greater design complexity, intricate detailing, and superior surface finishes, enabling the creation of aesthetically pleasing and highly protective packaging solutions for a diverse range of products, from delicate electronics to fresh produce. The competitive advantage of molded pulp lies in its balance of cost-effectiveness, environmental benefits, and versatile performance characteristics, making it a preferred choice for brands prioritizing sustainability without compromising on product protection and presentation.
Key Drivers, Barriers & Challenges in Environmentally Friendly Molded Pulp Packaging
The environmentally friendly molded pulp packaging market is propelled by a robust set of drivers. Increasing consumer demand for sustainable products is paramount, with buyers actively seeking eco-conscious brands. Stricter government regulations and policies promoting recycled content and restricting single-use plastics worldwide further accelerate adoption. Technological advancements in fiber processing and molding techniques are enhancing the performance and aesthetic appeal of molded pulp, making it suitable for a broader range of applications. Cost-effectiveness compared to some premium eco-friendly alternatives also makes it an attractive option for businesses. The market is also benefiting from a growing emphasis on circular economy principles, where the recyclability and compostability of molded pulp align perfectly with waste reduction goals.
However, the market faces several barriers and challenges. Limited barrier properties against moisture and grease, particularly for certain food applications, remains a significant hurdle, although ongoing innovations are addressing this. Higher upfront investment costs for specialized machinery can be a deterrent for smaller manufacturers. Supply chain complexities and the availability of consistent quality recycled fiber can also pose challenges. Perception issues and consumer education are important, as some consumers may still associate paper-based packaging with lower performance than plastics. Furthermore, competitive pressures from other sustainable packaging materials, such as bioplastics and advanced paperboards, require continuous innovation and cost optimization. The estimated market impact of these challenges could potentially reduce growth by up to 10 million in potential revenue if not effectively mitigated.
Growth Drivers in the Environmentally Friendly Molded Pulp Packaging Market
The growth of the environmentally friendly molded pulp packaging market is significantly influenced by several key factors. Technologically, advancements in refining and treating recycled fibers are leading to stronger, more water-resistant, and aesthetically pleasing molded pulp products, expanding their application scope. Economically, the increasing cost of petroleum-based plastics and growing consumer willingness to pay a premium for sustainable options are making molded pulp more competitive. Regulatory drivers, such as bans on single-use plastics and mandates for recycled content, are creating a favorable environment for molded pulp adoption. For example, policies favoring extended producer responsibility schemes directly benefit materials like molded pulp that can be efficiently recycled or composted.
Challenges Impacting Environmentally Friendly Molded Pulp Packaging Growth
Several challenges can impede the growth of the environmentally friendly molded pulp packaging market. Regulatory complexities, such as varying standards for compostability and recycling across different regions, can create confusion and hinder widespread adoption. Supply chain issues, including the consistent availability of high-quality recycled fiber and potential fluctuations in raw material prices, can impact production efficiency and cost. Competitive pressures from other emerging sustainable packaging materials, each with its own set of advantages, necessitate continuous innovation and differentiation for molded pulp. Moreover, the initial capital investment required for advanced molding equipment can be a significant barrier, particularly for smaller enterprises looking to enter the market.
Key Players Shaping the Environmentally Friendly Molded Pulp Packaging Market
- UFP Technologies
- Huhtamaki
- Brodrene Hartmann
- Sonoco
- EnviroPAK
- Nippon Molding
- CDL Omni-Pac
- Vernacare
- Pactiv
- Henry Molded Products
- Pacific Pulp Molding
- Keiding
- FiberCel Packaging
- Guangxi Qiaowang Pulp Packing Products
- Lihua Group
- Qingdao Xinya
- Shenzhen Prince New Material
- Dongguan Zelin
- Shaanxi Huanke
- Yulin Paper
Significant Environmentally Friendly Molded Pulp Packaging Industry Milestones
- 2019: Increased global regulatory focus on reducing single-use plastics, leading to heightened interest in molded pulp alternatives.
- 2020: Innovations in bio-coatings for molded pulp emerge, enhancing water and grease resistance for food applications.
- 2021: Major food and beverage companies announce ambitious sustainability goals, increasing their demand for eco-friendly packaging.
- 2022: Significant investments in R&D for advanced molded pulp manufacturing techniques, improving efficiency and product quality.
- 2023: Growing consumer awareness of compostability leads to wider adoption of certified compostable molded pulp packaging.
- 2024: Expansion of molded pulp applications into the medical and pharmaceutical sectors, driven by its sterile and disposable properties.
Future Outlook for Environmentally Friendly Molded Pulp Packaging Market
The future outlook for the environmentally friendly molded pulp packaging market is exceptionally bright, fueled by an unwavering global commitment to sustainability. Strategic opportunities lie in further innovation to overcome existing limitations, particularly in enhancing barrier properties and aesthetics for high-end applications. The increasing demand for personalized and custom-designed packaging presents a significant avenue for growth. As more countries implement robust policies supporting circular economy models, the market penetration of molded pulp is set to accelerate. The potential for integration with smart packaging technologies also offers exciting prospects. With an estimated market size poised to surpass 120 million by 2033, the environmentally friendly molded pulp packaging market is a key growth sector within the broader packaging industry.
Environmentally Friendly Molded Pulp Packaging Segmentation
-
1. Application
- 1.1. Food and Beverage
- 1.2. Industrial
- 1.3. Medical
-
2. Type
- 2.1. Recyclable
- 2.2. Non-recyclable
Environmentally Friendly Molded Pulp Packaging Segmentation By Geography
-
1. North America
- 1.1. United States
- 1.2. Canada
- 1.3. Mexico
-
2. South America
- 2.1. Brazil
- 2.2. Argentina
- 2.3. Rest of South America
-
3. Europe
- 3.1. United Kingdom
- 3.2. Germany
- 3.3. France
- 3.4. Italy
- 3.5. Spain
- 3.6. Russia
- 3.7. Benelux
- 3.8. Nordics
- 3.9. Rest of Europe
-
4. Middle East & Africa
- 4.1. Turkey
- 4.2. Israel
- 4.3. GCC
- 4.4. North Africa
- 4.5. South Africa
- 4.6. Rest of Middle East & Africa
-
5. Asia Pacific
- 5.1. China
- 5.2. India
- 5.3. Japan
- 5.4. South Korea
- 5.5. ASEAN
- 5.6. Oceania
- 5.7. Rest of Asia Pacific
Environmentally Friendly Molded Pulp Packaging Regional Market Share
Geographic Coverage of Environmentally Friendly Molded Pulp Packaging
Environmentally Friendly Molded Pulp Packaging REPORT HIGHLIGHTS
| Aspects | Details |
|---|---|
| Study Period | 2020-2034 |
| Base Year | 2025 |
| Estimated Year | 2026 |
| Forecast Period | 2026-2034 |
| Historical Period | 2020-2025 |
| Growth Rate | CAGR of 6.7% from 2020-2034 |
| Segmentation |
|
Table of Contents
- 1. Introduction
- 1.1. Research Scope
- 1.2. Market Segmentation
- 1.3. Research Methodology
- 1.4. Definitions and Assumptions
- 2. Executive Summary
- 2.1. Introduction
- 3. Market Dynamics
- 3.1. Introduction
- 3.2. Market Drivers
- 3.3. Market Restrains
- 3.4. Market Trends
- 4. Market Factor Analysis
- 4.1. Porters Five Forces
- 4.2. Supply/Value Chain
- 4.3. PESTEL analysis
- 4.4. Market Entropy
- 4.5. Patent/Trademark Analysis
- 5. Global Environmentally Friendly Molded Pulp Packaging Analysis, Insights and Forecast, 2020-2032
- 5.1. Market Analysis, Insights and Forecast - by Application
- 5.1.1. Food and Beverage
- 5.1.2. Industrial
- 5.1.3. Medical
- 5.2. Market Analysis, Insights and Forecast - by Type
- 5.2.1. Recyclable
- 5.2.2. Non-recyclable
- 5.3. Market Analysis, Insights and Forecast - by Region
- 5.3.1. North America
- 5.3.2. South America
- 5.3.3. Europe
- 5.3.4. Middle East & Africa
- 5.3.5. Asia Pacific
- 5.1. Market Analysis, Insights and Forecast - by Application
- 6. North America Environmentally Friendly Molded Pulp Packaging Analysis, Insights and Forecast, 2020-2032
- 6.1. Market Analysis, Insights and Forecast - by Application
- 6.1.1. Food and Beverage
- 6.1.2. Industrial
- 6.1.3. Medical
- 6.2. Market Analysis, Insights and Forecast - by Type
- 6.2.1. Recyclable
- 6.2.2. Non-recyclable
- 6.1. Market Analysis, Insights and Forecast - by Application
- 7. South America Environmentally Friendly Molded Pulp Packaging Analysis, Insights and Forecast, 2020-2032
- 7.1. Market Analysis, Insights and Forecast - by Application
- 7.1.1. Food and Beverage
- 7.1.2. Industrial
- 7.1.3. Medical
- 7.2. Market Analysis, Insights and Forecast - by Type
- 7.2.1. Recyclable
- 7.2.2. Non-recyclable
- 7.1. Market Analysis, Insights and Forecast - by Application
- 8. Europe Environmentally Friendly Molded Pulp Packaging Analysis, Insights and Forecast, 2020-2032
- 8.1. Market Analysis, Insights and Forecast - by Application
- 8.1.1. Food and Beverage
- 8.1.2. Industrial
- 8.1.3. Medical
- 8.2. Market Analysis, Insights and Forecast - by Type
- 8.2.1. Recyclable
- 8.2.2. Non-recyclable
- 8.1. Market Analysis, Insights and Forecast - by Application
- 9. Middle East & Africa Environmentally Friendly Molded Pulp Packaging Analysis, Insights and Forecast, 2020-2032
- 9.1. Market Analysis, Insights and Forecast - by Application
- 9.1.1. Food and Beverage
- 9.1.2. Industrial
- 9.1.3. Medical
- 9.2. Market Analysis, Insights and Forecast - by Type
- 9.2.1. Recyclable
- 9.2.2. Non-recyclable
- 9.1. Market Analysis, Insights and Forecast - by Application
- 10. Asia Pacific Environmentally Friendly Molded Pulp Packaging Analysis, Insights and Forecast, 2020-2032
- 10.1. Market Analysis, Insights and Forecast - by Application
- 10.1.1. Food and Beverage
- 10.1.2. Industrial
- 10.1.3. Medical
- 10.2. Market Analysis, Insights and Forecast - by Type
- 10.2.1. Recyclable
- 10.2.2. Non-recyclable
- 10.1. Market Analysis, Insights and Forecast - by Application
- 11. Competitive Analysis
- 11.1. Global Market Share Analysis 2025
- 11.2. Company Profiles
- 11.2.1 UFP Technologies
- 11.2.1.1. Overview
- 11.2.1.2. Products
- 11.2.1.3. SWOT Analysis
- 11.2.1.4. Recent Developments
- 11.2.1.5. Financials (Based on Availability)
- 11.2.2 Huhtamaki
- 11.2.2.1. Overview
- 11.2.2.2. Products
- 11.2.2.3. SWOT Analysis
- 11.2.2.4. Recent Developments
- 11.2.2.5. Financials (Based on Availability)
- 11.2.3 Brodrene Hartmann
- 11.2.3.1. Overview
- 11.2.3.2. Products
- 11.2.3.3. SWOT Analysis
- 11.2.3.4. Recent Developments
- 11.2.3.5. Financials (Based on Availability)
- 11.2.4 Sonoco
- 11.2.4.1. Overview
- 11.2.4.2. Products
- 11.2.4.3. SWOT Analysis
- 11.2.4.4. Recent Developments
- 11.2.4.5. Financials (Based on Availability)
- 11.2.5 EnviroPAK
- 11.2.5.1. Overview
- 11.2.5.2. Products
- 11.2.5.3. SWOT Analysis
- 11.2.5.4. Recent Developments
- 11.2.5.5. Financials (Based on Availability)
- 11.2.6 Nippon Molding
- 11.2.6.1. Overview
- 11.2.6.2. Products
- 11.2.6.3. SWOT Analysis
- 11.2.6.4. Recent Developments
- 11.2.6.5. Financials (Based on Availability)
- 11.2.7 CDL Omni-Pac
- 11.2.7.1. Overview
- 11.2.7.2. Products
- 11.2.7.3. SWOT Analysis
- 11.2.7.4. Recent Developments
- 11.2.7.5. Financials (Based on Availability)
- 11.2.8 Vernacare
- 11.2.8.1. Overview
- 11.2.8.2. Products
- 11.2.8.3. SWOT Analysis
- 11.2.8.4. Recent Developments
- 11.2.8.5. Financials (Based on Availability)
- 11.2.9 Pactiv
- 11.2.9.1. Overview
- 11.2.9.2. Products
- 11.2.9.3. SWOT Analysis
- 11.2.9.4. Recent Developments
- 11.2.9.5. Financials (Based on Availability)
- 11.2.10 Henry Molded Products
- 11.2.10.1. Overview
- 11.2.10.2. Products
- 11.2.10.3. SWOT Analysis
- 11.2.10.4. Recent Developments
- 11.2.10.5. Financials (Based on Availability)
- 11.2.11 Pacific Pulp Molding
- 11.2.11.1. Overview
- 11.2.11.2. Products
- 11.2.11.3. SWOT Analysis
- 11.2.11.4. Recent Developments
- 11.2.11.5. Financials (Based on Availability)
- 11.2.12 Keiding
- 11.2.12.1. Overview
- 11.2.12.2. Products
- 11.2.12.3. SWOT Analysis
- 11.2.12.4. Recent Developments
- 11.2.12.5. Financials (Based on Availability)
- 11.2.13 FiberCel Packaging
- 11.2.13.1. Overview
- 11.2.13.2. Products
- 11.2.13.3. SWOT Analysis
- 11.2.13.4. Recent Developments
- 11.2.13.5. Financials (Based on Availability)
- 11.2.14 Guangxi Qiaowang Pulp Packing Products
- 11.2.14.1. Overview
- 11.2.14.2. Products
- 11.2.14.3. SWOT Analysis
- 11.2.14.4. Recent Developments
- 11.2.14.5. Financials (Based on Availability)
- 11.2.15 Lihua Group
- 11.2.15.1. Overview
- 11.2.15.2. Products
- 11.2.15.3. SWOT Analysis
- 11.2.15.4. Recent Developments
- 11.2.15.5. Financials (Based on Availability)
- 11.2.16 Qingdao Xinya
- 11.2.16.1. Overview
- 11.2.16.2. Products
- 11.2.16.3. SWOT Analysis
- 11.2.16.4. Recent Developments
- 11.2.16.5. Financials (Based on Availability)
- 11.2.17 Shenzhen Prince New Material
- 11.2.17.1. Overview
- 11.2.17.2. Products
- 11.2.17.3. SWOT Analysis
- 11.2.17.4. Recent Developments
- 11.2.17.5. Financials (Based on Availability)
- 11.2.18 Dongguan Zelin
- 11.2.18.1. Overview
- 11.2.18.2. Products
- 11.2.18.3. SWOT Analysis
- 11.2.18.4. Recent Developments
- 11.2.18.5. Financials (Based on Availability)
- 11.2.19 Shaanxi Huanke
- 11.2.19.1. Overview
- 11.2.19.2. Products
- 11.2.19.3. SWOT Analysis
- 11.2.19.4. Recent Developments
- 11.2.19.5. Financials (Based on Availability)
- 11.2.20 Yulin Paper
- 11.2.20.1. Overview
- 11.2.20.2. Products
- 11.2.20.3. SWOT Analysis
- 11.2.20.4. Recent Developments
- 11.2.20.5. Financials (Based on Availability)
- 11.2.1 UFP Technologies
List of Figures
- Figure 1: Global Environmentally Friendly Molded Pulp Packaging Revenue Breakdown (million, %) by Region 2025 & 2033
- Figure 2: Global Environmentally Friendly Molded Pulp Packaging Volume Breakdown (K, %) by Region 2025 & 2033
- Figure 3: North America Environmentally Friendly Molded Pulp Packaging Revenue (million), by Application 2025 & 2033
- Figure 4: North America Environmentally Friendly Molded Pulp Packaging Volume (K), by Application 2025 & 2033
- Figure 5: North America Environmentally Friendly Molded Pulp Packaging Revenue Share (%), by Application 2025 & 2033
- Figure 6: North America Environmentally Friendly Molded Pulp Packaging Volume Share (%), by Application 2025 & 2033
- Figure 7: North America Environmentally Friendly Molded Pulp Packaging Revenue (million), by Type 2025 & 2033
- Figure 8: North America Environmentally Friendly Molded Pulp Packaging Volume (K), by Type 2025 & 2033
- Figure 9: North America Environmentally Friendly Molded Pulp Packaging Revenue Share (%), by Type 2025 & 2033
- Figure 10: North America Environmentally Friendly Molded Pulp Packaging Volume Share (%), by Type 2025 & 2033
- Figure 11: North America Environmentally Friendly Molded Pulp Packaging Revenue (million), by Country 2025 & 2033
- Figure 12: North America Environmentally Friendly Molded Pulp Packaging Volume (K), by Country 2025 & 2033
- Figure 13: North America Environmentally Friendly Molded Pulp Packaging Revenue Share (%), by Country 2025 & 2033
- Figure 14: North America Environmentally Friendly Molded Pulp Packaging Volume Share (%), by Country 2025 & 2033
- Figure 15: South America Environmentally Friendly Molded Pulp Packaging Revenue (million), by Application 2025 & 2033
- Figure 16: South America Environmentally Friendly Molded Pulp Packaging Volume (K), by Application 2025 & 2033
- Figure 17: South America Environmentally Friendly Molded Pulp Packaging Revenue Share (%), by Application 2025 & 2033
- Figure 18: South America Environmentally Friendly Molded Pulp Packaging Volume Share (%), by Application 2025 & 2033
- Figure 19: South America Environmentally Friendly Molded Pulp Packaging Revenue (million), by Type 2025 & 2033
- Figure 20: South America Environmentally Friendly Molded Pulp Packaging Volume (K), by Type 2025 & 2033
- Figure 21: South America Environmentally Friendly Molded Pulp Packaging Revenue Share (%), by Type 2025 & 2033
- Figure 22: South America Environmentally Friendly Molded Pulp Packaging Volume Share (%), by Type 2025 & 2033
- Figure 23: South America Environmentally Friendly Molded Pulp Packaging Revenue (million), by Country 2025 & 2033
- Figure 24: South America Environmentally Friendly Molded Pulp Packaging Volume (K), by Country 2025 & 2033
- Figure 25: South America Environmentally Friendly Molded Pulp Packaging Revenue Share (%), by Country 2025 & 2033
- Figure 26: South America Environmentally Friendly Molded Pulp Packaging Volume Share (%), by Country 2025 & 2033
- Figure 27: Europe Environmentally Friendly Molded Pulp Packaging Revenue (million), by Application 2025 & 2033
- Figure 28: Europe Environmentally Friendly Molded Pulp Packaging Volume (K), by Application 2025 & 2033
- Figure 29: Europe Environmentally Friendly Molded Pulp Packaging Revenue Share (%), by Application 2025 & 2033
- Figure 30: Europe Environmentally Friendly Molded Pulp Packaging Volume Share (%), by Application 2025 & 2033
- Figure 31: Europe Environmentally Friendly Molded Pulp Packaging Revenue (million), by Type 2025 & 2033
- Figure 32: Europe Environmentally Friendly Molded Pulp Packaging Volume (K), by Type 2025 & 2033
- Figure 33: Europe Environmentally Friendly Molded Pulp Packaging Revenue Share (%), by Type 2025 & 2033
- Figure 34: Europe Environmentally Friendly Molded Pulp Packaging Volume Share (%), by Type 2025 & 2033
- Figure 35: Europe Environmentally Friendly Molded Pulp Packaging Revenue (million), by Country 2025 & 2033
- Figure 36: Europe Environmentally Friendly Molded Pulp Packaging Volume (K), by Country 2025 & 2033
- Figure 37: Europe Environmentally Friendly Molded Pulp Packaging Revenue Share (%), by Country 2025 & 2033
- Figure 38: Europe Environmentally Friendly Molded Pulp Packaging Volume Share (%), by Country 2025 & 2033
- Figure 39: Middle East & Africa Environmentally Friendly Molded Pulp Packaging Revenue (million), by Application 2025 & 2033
- Figure 40: Middle East & Africa Environmentally Friendly Molded Pulp Packaging Volume (K), by Application 2025 & 2033
- Figure 41: Middle East & Africa Environmentally Friendly Molded Pulp Packaging Revenue Share (%), by Application 2025 & 2033
- Figure 42: Middle East & Africa Environmentally Friendly Molded Pulp Packaging Volume Share (%), by Application 2025 & 2033
- Figure 43: Middle East & Africa Environmentally Friendly Molded Pulp Packaging Revenue (million), by Type 2025 & 2033
- Figure 44: Middle East & Africa Environmentally Friendly Molded Pulp Packaging Volume (K), by Type 2025 & 2033
- Figure 45: Middle East & Africa Environmentally Friendly Molded Pulp Packaging Revenue Share (%), by Type 2025 & 2033
- Figure 46: Middle East & Africa Environmentally Friendly Molded Pulp Packaging Volume Share (%), by Type 2025 & 2033
- Figure 47: Middle East & Africa Environmentally Friendly Molded Pulp Packaging Revenue (million), by Country 2025 & 2033
- Figure 48: Middle East & Africa Environmentally Friendly Molded Pulp Packaging Volume (K), by Country 2025 & 2033
- Figure 49: Middle East & Africa Environmentally Friendly Molded Pulp Packaging Revenue Share (%), by Country 2025 & 2033
- Figure 50: Middle East & Africa Environmentally Friendly Molded Pulp Packaging Volume Share (%), by Country 2025 & 2033
- Figure 51: Asia Pacific Environmentally Friendly Molded Pulp Packaging Revenue (million), by Application 2025 & 2033
- Figure 52: Asia Pacific Environmentally Friendly Molded Pulp Packaging Volume (K), by Application 2025 & 2033
- Figure 53: Asia Pacific Environmentally Friendly Molded Pulp Packaging Revenue Share (%), by Application 2025 & 2033
- Figure 54: Asia Pacific Environmentally Friendly Molded Pulp Packaging Volume Share (%), by Application 2025 & 2033
- Figure 55: Asia Pacific Environmentally Friendly Molded Pulp Packaging Revenue (million), by Type 2025 & 2033
- Figure 56: Asia Pacific Environmentally Friendly Molded Pulp Packaging Volume (K), by Type 2025 & 2033
- Figure 57: Asia Pacific Environmentally Friendly Molded Pulp Packaging Revenue Share (%), by Type 2025 & 2033
- Figure 58: Asia Pacific Environmentally Friendly Molded Pulp Packaging Volume Share (%), by Type 2025 & 2033
- Figure 59: Asia Pacific Environmentally Friendly Molded Pulp Packaging Revenue (million), by Country 2025 & 2033
- Figure 60: Asia Pacific Environmentally Friendly Molded Pulp Packaging Volume (K), by Country 2025 & 2033
- Figure 61: Asia Pacific Environmentally Friendly Molded Pulp Packaging Revenue Share (%), by Country 2025 & 2033
- Figure 62: Asia Pacific Environmentally Friendly Molded Pulp Packaging Volume Share (%), by Country 2025 & 2033
List of Tables
- Table 1: Global Environmentally Friendly Molded Pulp Packaging Revenue million Forecast, by Application 2020 & 2033
- Table 2: Global Environmentally Friendly Molded Pulp Packaging Volume K Forecast, by Application 2020 & 2033
- Table 3: Global Environmentally Friendly Molded Pulp Packaging Revenue million Forecast, by Type 2020 & 2033
- Table 4: Global Environmentally Friendly Molded Pulp Packaging Volume K Forecast, by Type 2020 & 2033
- Table 5: Global Environmentally Friendly Molded Pulp Packaging Revenue million Forecast, by Region 2020 & 2033
- Table 6: Global Environmentally Friendly Molded Pulp Packaging Volume K Forecast, by Region 2020 & 2033
- Table 7: Global Environmentally Friendly Molded Pulp Packaging Revenue million Forecast, by Application 2020 & 2033
- Table 8: Global Environmentally Friendly Molded Pulp Packaging Volume K Forecast, by Application 2020 & 2033
- Table 9: Global Environmentally Friendly Molded Pulp Packaging Revenue million Forecast, by Type 2020 & 2033
- Table 10: Global Environmentally Friendly Molded Pulp Packaging Volume K Forecast, by Type 2020 & 2033
- Table 11: Global Environmentally Friendly Molded Pulp Packaging Revenue million Forecast, by Country 2020 & 2033
- Table 12: Global Environmentally Friendly Molded Pulp Packaging Volume K Forecast, by Country 2020 & 2033
- Table 13: United States Environmentally Friendly Molded Pulp Packaging Revenue (million) Forecast, by Application 2020 & 2033
- Table 14: United States Environmentally Friendly Molded Pulp Packaging Volume (K) Forecast, by Application 2020 & 2033
- Table 15: Canada Environmentally Friendly Molded Pulp Packaging Revenue (million) Forecast, by Application 2020 & 2033
- Table 16: Canada Environmentally Friendly Molded Pulp Packaging Volume (K) Forecast, by Application 2020 & 2033
- Table 17: Mexico Environmentally Friendly Molded Pulp Packaging Revenue (million) Forecast, by Application 2020 & 2033
- Table 18: Mexico Environmentally Friendly Molded Pulp Packaging Volume (K) Forecast, by Application 2020 & 2033
- Table 19: Global Environmentally Friendly Molded Pulp Packaging Revenue million Forecast, by Application 2020 & 2033
- Table 20: Global Environmentally Friendly Molded Pulp Packaging Volume K Forecast, by Application 2020 & 2033
- Table 21: Global Environmentally Friendly Molded Pulp Packaging Revenue million Forecast, by Type 2020 & 2033
- Table 22: Global Environmentally Friendly Molded Pulp Packaging Volume K Forecast, by Type 2020 & 2033
- Table 23: Global Environmentally Friendly Molded Pulp Packaging Revenue million Forecast, by Country 2020 & 2033
- Table 24: Global Environmentally Friendly Molded Pulp Packaging Volume K Forecast, by Country 2020 & 2033
- Table 25: Brazil Environmentally Friendly Molded Pulp Packaging Revenue (million) Forecast, by Application 2020 & 2033
- Table 26: Brazil Environmentally Friendly Molded Pulp Packaging Volume (K) Forecast, by Application 2020 & 2033
- Table 27: Argentina Environmentally Friendly Molded Pulp Packaging Revenue (million) Forecast, by Application 2020 & 2033
- Table 28: Argentina Environmentally Friendly Molded Pulp Packaging Volume (K) Forecast, by Application 2020 & 2033
- Table 29: Rest of South America Environmentally Friendly Molded Pulp Packaging Revenue (million) Forecast, by Application 2020 & 2033
- Table 30: Rest of South America Environmentally Friendly Molded Pulp Packaging Volume (K) Forecast, by Application 2020 & 2033
- Table 31: Global Environmentally Friendly Molded Pulp Packaging Revenue million Forecast, by Application 2020 & 2033
- Table 32: Global Environmentally Friendly Molded Pulp Packaging Volume K Forecast, by Application 2020 & 2033
- Table 33: Global Environmentally Friendly Molded Pulp Packaging Revenue million Forecast, by Type 2020 & 2033
- Table 34: Global Environmentally Friendly Molded Pulp Packaging Volume K Forecast, by Type 2020 & 2033
- Table 35: Global Environmentally Friendly Molded Pulp Packaging Revenue million Forecast, by Country 2020 & 2033
- Table 36: Global Environmentally Friendly Molded Pulp Packaging Volume K Forecast, by Country 2020 & 2033
- Table 37: United Kingdom Environmentally Friendly Molded Pulp Packaging Revenue (million) Forecast, by Application 2020 & 2033
- Table 38: United Kingdom Environmentally Friendly Molded Pulp Packaging Volume (K) Forecast, by Application 2020 & 2033
- Table 39: Germany Environmentally Friendly Molded Pulp Packaging Revenue (million) Forecast, by Application 2020 & 2033
- Table 40: Germany Environmentally Friendly Molded Pulp Packaging Volume (K) Forecast, by Application 2020 & 2033
- Table 41: France Environmentally Friendly Molded Pulp Packaging Revenue (million) Forecast, by Application 2020 & 2033
- Table 42: France Environmentally Friendly Molded Pulp Packaging Volume (K) Forecast, by Application 2020 & 2033
- Table 43: Italy Environmentally Friendly Molded Pulp Packaging Revenue (million) Forecast, by Application 2020 & 2033
- Table 44: Italy Environmentally Friendly Molded Pulp Packaging Volume (K) Forecast, by Application 2020 & 2033
- Table 45: Spain Environmentally Friendly Molded Pulp Packaging Revenue (million) Forecast, by Application 2020 & 2033
- Table 46: Spain Environmentally Friendly Molded Pulp Packaging Volume (K) Forecast, by Application 2020 & 2033
- Table 47: Russia Environmentally Friendly Molded Pulp Packaging Revenue (million) Forecast, by Application 2020 & 2033
- Table 48: Russia Environmentally Friendly Molded Pulp Packaging Volume (K) Forecast, by Application 2020 & 2033
- Table 49: Benelux Environmentally Friendly Molded Pulp Packaging Revenue (million) Forecast, by Application 2020 & 2033
- Table 50: Benelux Environmentally Friendly Molded Pulp Packaging Volume (K) Forecast, by Application 2020 & 2033
- Table 51: Nordics Environmentally Friendly Molded Pulp Packaging Revenue (million) Forecast, by Application 2020 & 2033
- Table 52: Nordics Environmentally Friendly Molded Pulp Packaging Volume (K) Forecast, by Application 2020 & 2033
- Table 53: Rest of Europe Environmentally Friendly Molded Pulp Packaging Revenue (million) Forecast, by Application 2020 & 2033
- Table 54: Rest of Europe Environmentally Friendly Molded Pulp Packaging Volume (K) Forecast, by Application 2020 & 2033
- Table 55: Global Environmentally Friendly Molded Pulp Packaging Revenue million Forecast, by Application 2020 & 2033
- Table 56: Global Environmentally Friendly Molded Pulp Packaging Volume K Forecast, by Application 2020 & 2033
- Table 57: Global Environmentally Friendly Molded Pulp Packaging Revenue million Forecast, by Type 2020 & 2033
- Table 58: Global Environmentally Friendly Molded Pulp Packaging Volume K Forecast, by Type 2020 & 2033
- Table 59: Global Environmentally Friendly Molded Pulp Packaging Revenue million Forecast, by Country 2020 & 2033
- Table 60: Global Environmentally Friendly Molded Pulp Packaging Volume K Forecast, by Country 2020 & 2033
- Table 61: Turkey Environmentally Friendly Molded Pulp Packaging Revenue (million) Forecast, by Application 2020 & 2033
- Table 62: Turkey Environmentally Friendly Molded Pulp Packaging Volume (K) Forecast, by Application 2020 & 2033
- Table 63: Israel Environmentally Friendly Molded Pulp Packaging Revenue (million) Forecast, by Application 2020 & 2033
- Table 64: Israel Environmentally Friendly Molded Pulp Packaging Volume (K) Forecast, by Application 2020 & 2033
- Table 65: GCC Environmentally Friendly Molded Pulp Packaging Revenue (million) Forecast, by Application 2020 & 2033
- Table 66: GCC Environmentally Friendly Molded Pulp Packaging Volume (K) Forecast, by Application 2020 & 2033
- Table 67: North Africa Environmentally Friendly Molded Pulp Packaging Revenue (million) Forecast, by Application 2020 & 2033
- Table 68: North Africa Environmentally Friendly Molded Pulp Packaging Volume (K) Forecast, by Application 2020 & 2033
- Table 69: South Africa Environmentally Friendly Molded Pulp Packaging Revenue (million) Forecast, by Application 2020 & 2033
- Table 70: South Africa Environmentally Friendly Molded Pulp Packaging Volume (K) Forecast, by Application 2020 & 2033
- Table 71: Rest of Middle East & Africa Environmentally Friendly Molded Pulp Packaging Revenue (million) Forecast, by Application 2020 & 2033
- Table 72: Rest of Middle East & Africa Environmentally Friendly Molded Pulp Packaging Volume (K) Forecast, by Application 2020 & 2033
- Table 73: Global Environmentally Friendly Molded Pulp Packaging Revenue million Forecast, by Application 2020 & 2033
- Table 74: Global Environmentally Friendly Molded Pulp Packaging Volume K Forecast, by Application 2020 & 2033
- Table 75: Global Environmentally Friendly Molded Pulp Packaging Revenue million Forecast, by Type 2020 & 2033
- Table 76: Global Environmentally Friendly Molded Pulp Packaging Volume K Forecast, by Type 2020 & 2033
- Table 77: Global Environmentally Friendly Molded Pulp Packaging Revenue million Forecast, by Country 2020 & 2033
- Table 78: Global Environmentally Friendly Molded Pulp Packaging Volume K Forecast, by Country 2020 & 2033
- Table 79: China Environmentally Friendly Molded Pulp Packaging Revenue (million) Forecast, by Application 2020 & 2033
- Table 80: China Environmentally Friendly Molded Pulp Packaging Volume (K) Forecast, by Application 2020 & 2033
- Table 81: India Environmentally Friendly Molded Pulp Packaging Revenue (million) Forecast, by Application 2020 & 2033
- Table 82: India Environmentally Friendly Molded Pulp Packaging Volume (K) Forecast, by Application 2020 & 2033
- Table 83: Japan Environmentally Friendly Molded Pulp Packaging Revenue (million) Forecast, by Application 2020 & 2033
- Table 84: Japan Environmentally Friendly Molded Pulp Packaging Volume (K) Forecast, by Application 2020 & 2033
- Table 85: South Korea Environmentally Friendly Molded Pulp Packaging Revenue (million) Forecast, by Application 2020 & 2033
- Table 86: South Korea Environmentally Friendly Molded Pulp Packaging Volume (K) Forecast, by Application 2020 & 2033
- Table 87: ASEAN Environmentally Friendly Molded Pulp Packaging Revenue (million) Forecast, by Application 2020 & 2033
- Table 88: ASEAN Environmentally Friendly Molded Pulp Packaging Volume (K) Forecast, by Application 2020 & 2033
- Table 89: Oceania Environmentally Friendly Molded Pulp Packaging Revenue (million) Forecast, by Application 2020 & 2033
- Table 90: Oceania Environmentally Friendly Molded Pulp Packaging Volume (K) Forecast, by Application 2020 & 2033
- Table 91: Rest of Asia Pacific Environmentally Friendly Molded Pulp Packaging Revenue (million) Forecast, by Application 2020 & 2033
- Table 92: Rest of Asia Pacific Environmentally Friendly Molded Pulp Packaging Volume (K) Forecast, by Application 2020 & 2033
Frequently Asked Questions
1. What is the projected Compound Annual Growth Rate (CAGR) of the Environmentally Friendly Molded Pulp Packaging?
The projected CAGR is approximately 6.7%.
2. Which companies are prominent players in the Environmentally Friendly Molded Pulp Packaging?
Key companies in the market include UFP Technologies, Huhtamaki, Brodrene Hartmann, Sonoco, EnviroPAK, Nippon Molding, CDL Omni-Pac, Vernacare, Pactiv, Henry Molded Products, Pacific Pulp Molding, Keiding, FiberCel Packaging, Guangxi Qiaowang Pulp Packing Products, Lihua Group, Qingdao Xinya, Shenzhen Prince New Material, Dongguan Zelin, Shaanxi Huanke, Yulin Paper.
3. What are the main segments of the Environmentally Friendly Molded Pulp Packaging?
The market segments include Application, Type.
4. Can you provide details about the market size?
The market size is estimated to be USD 3961 million as of 2022.
5. What are some drivers contributing to market growth?
N/A
6. What are the notable trends driving market growth?
N/A
7. Are there any restraints impacting market growth?
N/A
8. Can you provide examples of recent developments in the market?
N/A
9. What pricing options are available for accessing the report?
Pricing options include single-user, multi-user, and enterprise licenses priced at USD 3950.00, USD 5925.00, and USD 7900.00 respectively.
10. Is the market size provided in terms of value or volume?
The market size is provided in terms of value, measured in million and volume, measured in K.
11. Are there any specific market keywords associated with the report?
Yes, the market keyword associated with the report is "Environmentally Friendly Molded Pulp Packaging," which aids in identifying and referencing the specific market segment covered.
12. How do I determine which pricing option suits my needs best?
The pricing options vary based on user requirements and access needs. Individual users may opt for single-user licenses, while businesses requiring broader access may choose multi-user or enterprise licenses for cost-effective access to the report.
13. Are there any additional resources or data provided in the Environmentally Friendly Molded Pulp Packaging report?
While the report offers comprehensive insights, it's advisable to review the specific contents or supplementary materials provided to ascertain if additional resources or data are available.
14. How can I stay updated on further developments or reports in the Environmentally Friendly Molded Pulp Packaging?
To stay informed about further developments, trends, and reports in the Environmentally Friendly Molded Pulp Packaging, consider subscribing to industry newsletters, following relevant companies and organizations, or regularly checking reputable industry news sources and publications.
Methodology
Step 1 - Identification of Relevant Samples Size from Population Database


Step 2 - Approaches for Defining Global Market Size (Value, Volume* & Price*)

Note*: In applicable scenarios
Step 3 - Data Sources
Primary Research
- Web Analytics
- Survey Reports
- Research Institute
- Latest Research Reports
- Opinion Leaders
Secondary Research
- Annual Reports
- White Paper
- Latest Press Release
- Industry Association
- Paid Database
- Investor Presentations

Step 4 - Data Triangulation
Involves using different sources of information in order to increase the validity of a study
These sources are likely to be stakeholders in a program - participants, other researchers, program staff, other community members, and so on.
Then we put all data in single framework & apply various statistical tools to find out the dynamic on the market.
During the analysis stage, feedback from the stakeholder groups would be compared to determine areas of agreement as well as areas of divergence