

Key Insights
The Non-Destructive Testing (NDT) market in the oil and gas industry is experiencing robust growth, driven by stringent safety regulations, increasing demand for enhanced operational efficiency, and the need to mitigate risks associated with aging infrastructure. A compound annual growth rate (CAGR) of 6.52% from 2019 to 2024 suggests a significant expansion, and this upward trajectory is projected to continue through 2033. The market is segmented by type (equipment, services, upstream, midstream, downstream) and technique (ultrasonic, radiography, visual inspection, liquid penetrant, magnetic particle, eddy current). The demand for advanced NDT techniques, such as ultrasonic testing and radiography, is particularly high due to their ability to detect subsurface flaws and provide detailed inspection reports. Upstream operations, focusing on exploration and production, represent a major segment due to the critical role of NDT in ensuring the integrity of pipelines, drilling equipment, and wellheads. Key players like Intertek, Zetec, Applus, and Fujifilm are driving innovation, offering a range of sophisticated technologies and services. The growth is further fueled by increasing investments in offshore exploration and the expansion of aging oil and gas infrastructure necessitating rigorous inspection and maintenance programs.
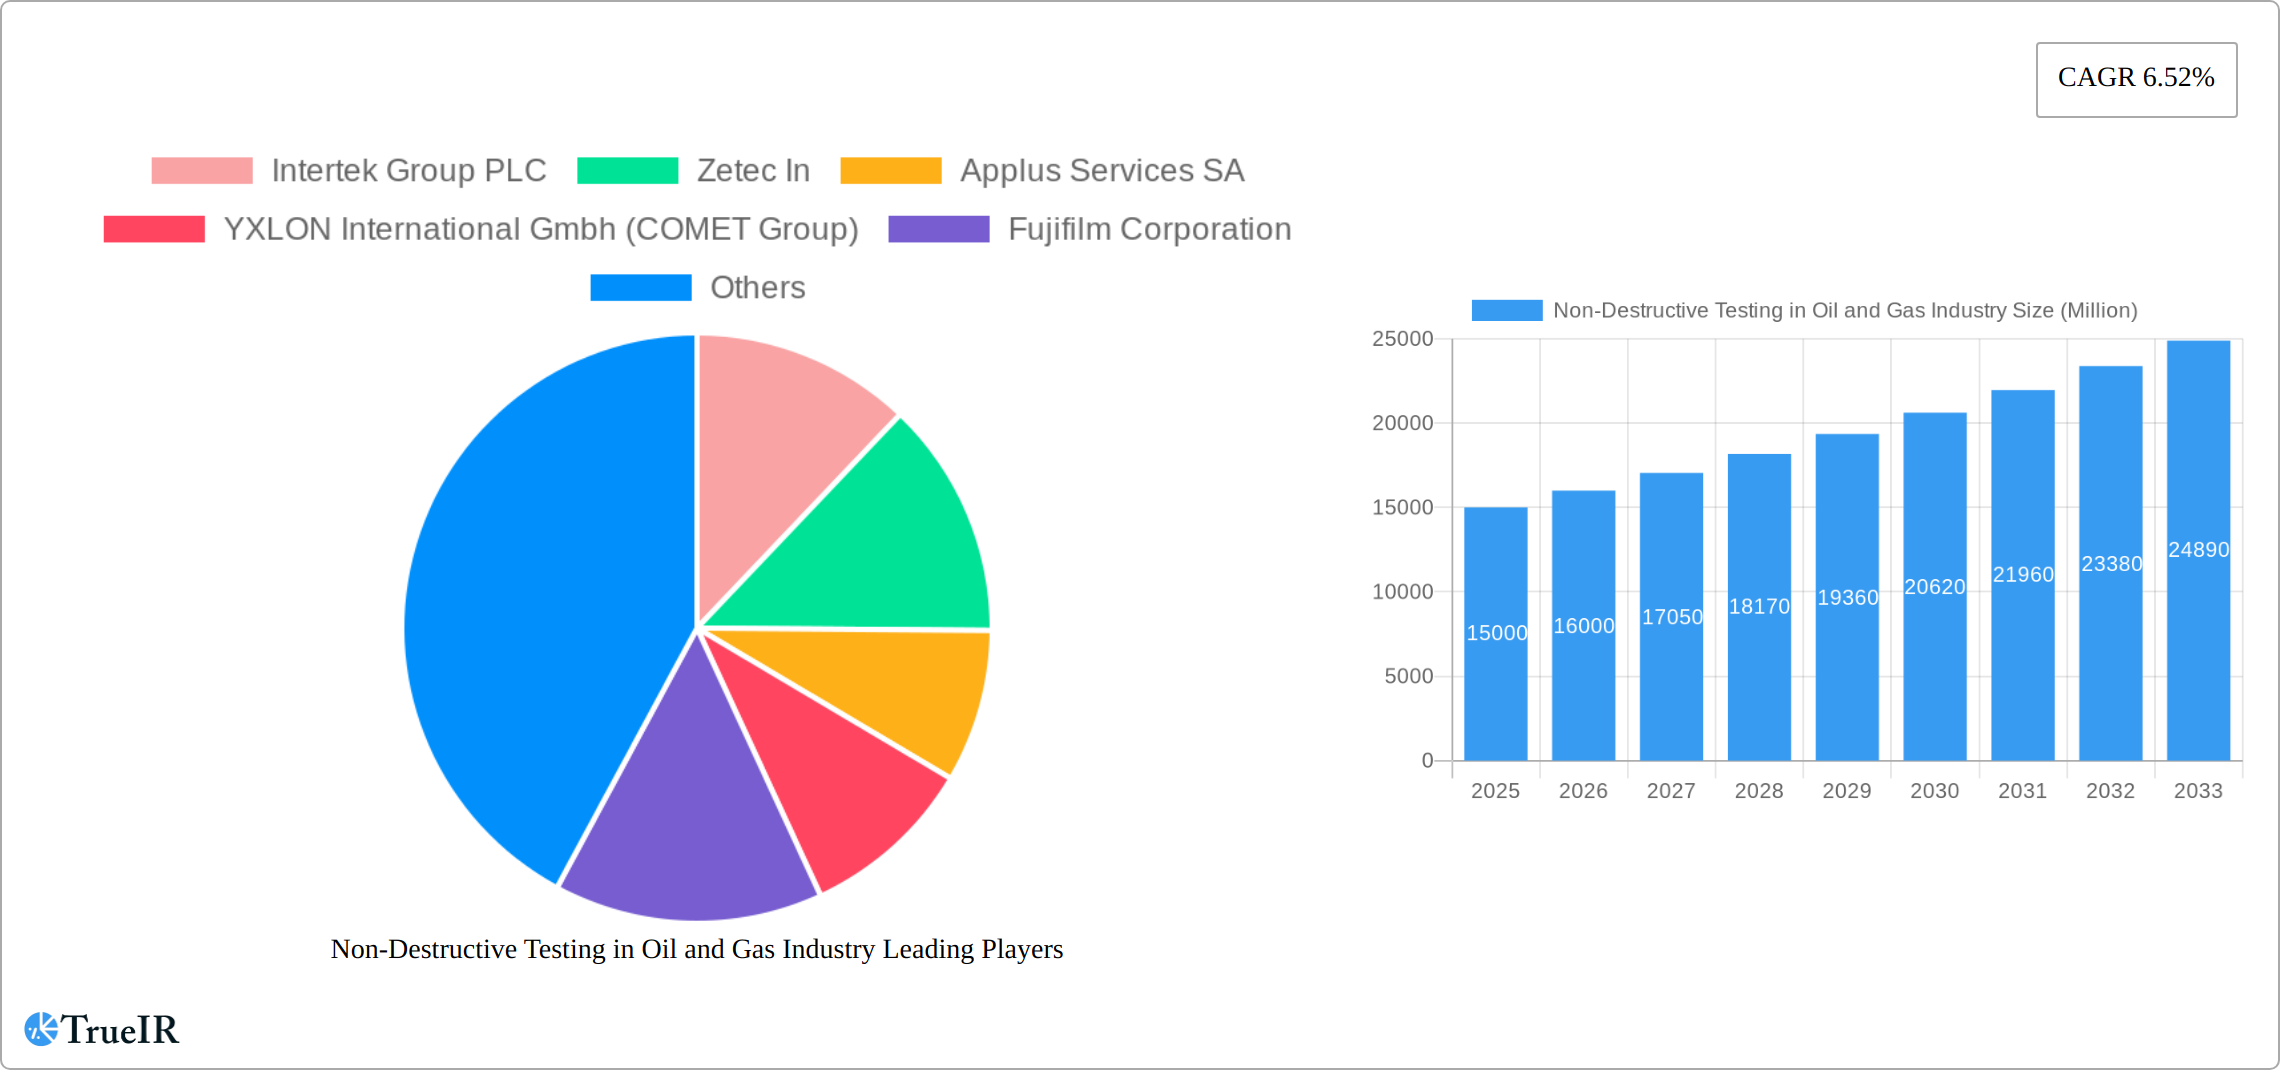
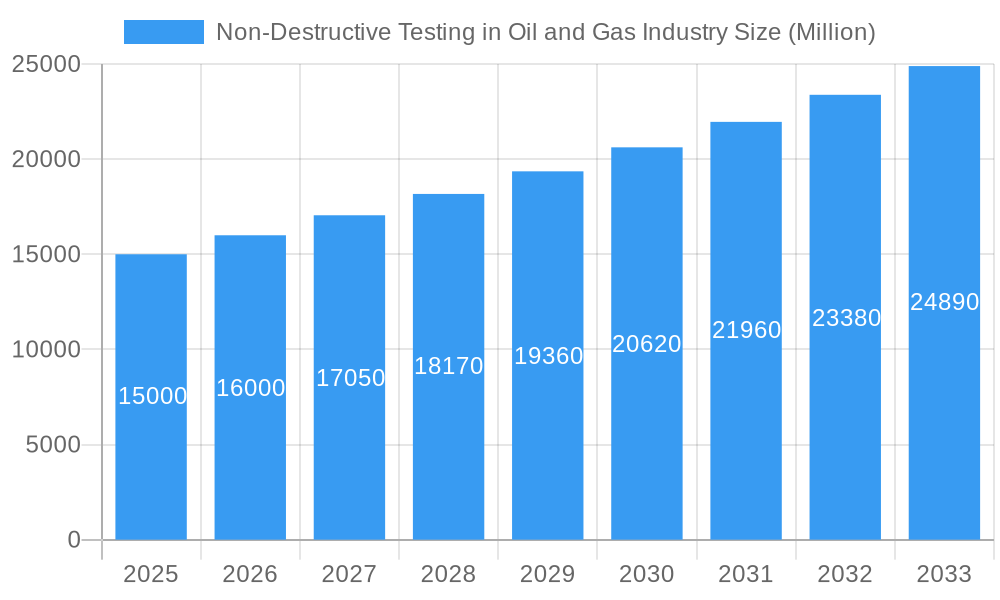
Non-Destructive Testing in Oil and Gas Industry Market Size (In Billion)
Significant regional variations exist. North America and Europe currently hold larger market shares due to established oil and gas industries and a greater emphasis on regulatory compliance. However, the Asia-Pacific region is anticipated to witness the fastest growth rate over the forecast period, driven by rising energy consumption, significant investments in new infrastructure projects, and increased adoption of advanced NDT techniques in emerging economies. While challenges like fluctuating oil prices and economic downturns can temporarily affect growth, the overall long-term outlook for the NDT market in oil and gas remains positive due to the inherent need for safety and efficiency improvements in the industry. The continuous development of advanced NDT technologies and the increased awareness of their importance will continue to drive market expansion in the years to come.
Non-Destructive Testing in Oil and Gas Industry Company Market Share
Non-Destructive Testing (NDT) in the Oil & Gas Industry: A Comprehensive Market Report (2019-2033)
This dynamic report provides a comprehensive analysis of the Non-Destructive Testing (NDT) market within the oil and gas industry, offering invaluable insights for stakeholders, investors, and industry professionals. Covering the period 2019-2033, with a focus on 2025, this report details market size, segmentation, competitive dynamics, and future growth potential. The market is projected to reach XX Million by 2033, exhibiting a significant CAGR of XX% during the forecast period (2025-2033).
Non-Destructive Testing in Oil and Gas Industry Market Structure & Competitive Landscape
The Non-Destructive Testing (NDT) market within the oil and gas sector exhibits a moderately concentrated structure, with a distinguished array of global and regional players vying for market dominance. These key entities, including industry leaders such as Intertek Group PLC, Zetec Inc., Applus Services SA, YXLON International GmbH (COMET Group), Fujifilm Corporation, GE Measurement and Control (Baker Hughes), Karl Storz Ndtec GmbH, Bureau Veritas SA, Olympus Corporation, Magnaflux Corp, and Magnetic Analysis Corporation, engage in fierce competition. Their strategies revolve around continuous technological innovation, the broadening of service portfolios, and strategic mergers and acquisitions to solidify their market positions.
- Market Concentration: The market's competitive intensity is assessed through metrics like the Herfindahl-Hirschman Index (HHI), which is estimated at a level indicating moderate concentration, suggesting a balanced landscape where both large and smaller players can find opportunities.
- Innovation Drivers: The relentless pursuit of enhanced inspection capabilities is fueled by advancements in cutting-edge sensor technologies, the integration of Artificial Intelligence (AI) for sophisticated data analysis, and the increasing adoption of automation. These innovations are pivotal in elevating NDT efficiency, accuracy, and the interpretability of results.
- Regulatory Impacts: A significant factor shaping the NDT market is the pervasive influence of stringent safety regulations and comprehensive environmental protection policies. These mandates necessitate the adoption and continuous upgrading of advanced NDT techniques to ensure operational integrity and environmental stewardship.
- Product Substitutes: While direct substitutes for established NDT methods are limited, ongoing refinements in alternative inspection technologies or methodologies could potentially introduce competitive pressures, prompting NDT providers to maintain a proactive approach to innovation.
- End-User Segmentation: The diverse operational spectrum of the oil and gas industry necessitates a tailored approach to NDT. The market is strategically segmented to address the distinct requirements of upstream (exploration and production), midstream (transportation and storage), and downstream (refining and processing) operations, each presenting unique inspection challenges and opportunities.
- M&A Trends: Over the past five years, the NDT sector within the oil and gas industry has experienced substantial merger and acquisition (M&A) activity, with an estimated value of xx Million. These strategic consolidations are primarily driven by companies aiming to expand their service offerings, enhance their technological capabilities, and broaden their geographical footprint to serve a global clientele.
Non-Destructive Testing in Oil and Gas Industry Market Trends & Opportunities
The global NDT market in the oil and gas industry is experiencing robust growth, fueled by several key trends. Increasing exploration and production activities in both established and emerging markets are driving demand for reliable and efficient NDT solutions. The market is witnessing a significant shift towards advanced techniques such as automated ultrasonic testing and advanced radiography, which offer enhanced accuracy, speed, and data analysis capabilities. Consumer preference is moving towards integrated NDT solutions that provide comprehensive data management and analysis features. The competitive landscape is characterized by continuous innovation, strategic partnerships, and acquisitions, leading to a dynamic and evolving market structure. The market size is expected to grow from XX Million in 2025 to XX Million by 2033, with a CAGR of XX%. Market penetration of advanced NDT techniques is projected to increase from xx% in 2025 to xx% by 2033.
Dominant Markets & Segments in Non-Destructive Testing in Oil and Gas Industry
The global Non-Destructive Testing market in the oil and gas industry is currently led by the North American region, reflecting its robust oil and gas infrastructure and significant investments in exploration and production. This dominance is closely followed by the Middle East and Europe, which also represent substantial markets for NDT services and technologies.
Within the market segments:
By Type:
- Services: The services segment commands the largest share of the market. This is largely attributable to the increasing trend of oil and gas companies outsourcing their NDT operations to specialized third-party providers, allowing them to focus on core competencies while ensuring compliance and asset integrity.
- Equipment: The equipment segment is experiencing consistent and healthy growth. This expansion is driven by ongoing technological advancements in NDT tools, the development of more sophisticated and portable inspection devices, and the growing demand for advanced NDT solutions that offer greater precision and efficiency.
By Technique:
- Ultrasonic Testing (UT): Remains the preeminent NDT technique due to its inherent versatility, cost-effectiveness, and broad applicability across a wide array of materials and defect types. Its ability to penetrate thick materials and provide detailed internal defect information makes it indispensable.
- Radiography Testing (RT): Continues to hold a significant market share, particularly for its established reliability in detecting internal flaws, voids, and discontinuities within materials, welds, and complex structures.
- Others (Magnetic Particle Testing & Eddy Current Testing): These specialized techniques are witnessing increasing adoption in niche applications where they offer unique advantages. Magnetic Particle Testing is highly effective for surface and near-surface defects in ferromagnetic materials, while Eddy Current Testing excels in detecting surface and subsurface flaws in conductive materials.
Key Growth Drivers:
- Sustained and robust investments in oil and gas exploration, development, and production activities worldwide.
- The escalating stringency of safety regulations and environmental protection mandates, which directly promote the comprehensive utilization of NDT methods for asset integrity management.
- Continuous technological advancements in NDT equipment and methodologies, leading to more efficient, accurate, and data-rich inspection outcomes.
- The accelerating adoption of digitalization, the Industrial Internet of Things (IIoT), and advanced data analytics in NDT processes, enabling predictive maintenance and optimized operational strategies.
Non-Destructive Testing in Oil and Gas Industry Product Analysis
Recent advancements focus on miniaturization, automation, and improved data analysis capabilities in NDT equipment. This includes handheld X-ray imagers with enhanced resolution and portability, and automated ultrasonic testing systems with advanced data processing software. These innovations enhance efficiency, reduce inspection time, and improve the accuracy of defect detection, resulting in cost savings and improved safety in oil and gas operations. The market fit for these innovative products is strong, driven by increasing demand for enhanced safety, efficiency, and data-driven decision-making.
Key Drivers, Barriers & Challenges in Non-Destructive Testing in Oil and Gas Industry
Key Drivers:
- Growing demand for enhanced safety and reliability in oil and gas operations.
- Stringent regulations mandating comprehensive NDT procedures.
- Technological advancements leading to more efficient and accurate NDT methods.
- Increasing need for real-time data analysis and remote inspection capabilities.
Challenges:
- High initial investment costs for advanced NDT equipment.
- Skilled labor shortages in specialized NDT techniques.
- Regulatory complexities and variations across different regions.
- Supply chain disruptions impacting the availability of NDT equipment and components. These disruptions have resulted in an estimated xx% increase in equipment costs in the past year.
Growth Drivers in the Non-Destructive Testing in Oil and Gas Industry Market
The primary growth drivers include the increasing demand for enhanced safety and reliability in oil and gas operations, stringent government regulations mandating NDT procedures, advancements in technology leading to more accurate and efficient methods, and the growing need for real-time data analysis and remote inspection capabilities. These factors collectively contribute to the expansion of the NDT market within the oil and gas sector.
Challenges Impacting Non-Destructive Testing in Oil and Gas Industry Growth
Despite the promising outlook, the growth of the Non-Destructive Testing market in the oil and gas industry faces several significant challenges. The high initial capital investment required for sophisticated NDT equipment and advanced technology can be a substantial barrier for some organizations. Furthermore, a persistent shortage of highly skilled and certified NDT technicians poses a constraint on service delivery and expansion. Regional variations in regulatory frameworks and standards can create complexities for international operations. Additionally, potential disruptions in global supply chains for essential NDT equipment and replacement parts can impact accessibility and project timelines. Addressing these hurdles is crucial for unlocking the full growth potential of the market.
Key Players Shaping the Non-Destructive Testing in Oil and Gas Industry Market
- Intertek Group PLC
- Zetec Inc.
- Applus Services SA
- YXLON International GmbH (COMET Group)
- Fujifilm Corporation
- GE Measurement and Control (Baker Hughes)
- Karl Storz Ndtec GmbH
- Bureau Veritas SA
- Olympus Corporation
- Magnaflux Corp
- Magnetic Analysis Corporation
Significant Non-Destructive Testing in Oil and Gas Industry Industry Milestones
- September 2022: Waygate Technologies launched the innovative Ruby|plate 240 calibration phantom for industrial computed tomography (CT). This development significantly enhances the accuracy of calibration and improves defect detection capabilities in CT scanning.
- October 2022: Videray Technologies Inc. introduced PX Ultra, a revolutionary handheld backscatter X-ray imager. This portable device expands the accessibility and application range of X-ray imaging for NDT, making advanced inspections more feasible in diverse field conditions.
Future Outlook for Non-Destructive Testing in Oil and Gas Industry Market
The future trajectory for the Non-Destructive Testing market within the oil and gas industry is exceptionally bright, underpinned by several compelling growth catalysts. Continued robust investments in exploration and production activities globally will sustain the demand for asset integrity management. An ever-increasing emphasis on stringent safety standards and regulatory compliance will further solidify the indispensable role of NDT. Moreover, the relentless pace of technological innovation, particularly in areas like AI, automation, robotics, and advanced data analytics, promises to revolutionize NDT processes, offering enhanced efficiency, deeper insights, and predictive capabilities. The growing imperative for improved inspection reliability and operational efficiency across the entire oil and gas value chain will undoubtedly propel significant market expansion and create exciting new strategic opportunities.
Non-Destructive Testing in Oil and Gas Industry Segmentation
-
1. Type
- 1.1. Equipment
- 1.2. Services
-
2. Type
- 2.1. Upstream
- 2.2. Midstream
- 2.3. Downstream
-
3. Technique
- 3.1. Ultrasonic
- 3.2. Radiography
- 3.3. Visual Inspection
- 3.4. Liquid Penetrant
- 3.5. Others (Magnetic Particle & Eddy Current)
Non-Destructive Testing in Oil and Gas Industry Segmentation By Geography
- 1. North America
- 2. Europe
- 3. Asia Pacific
- 4. Rest of the World

Non-Destructive Testing in Oil and Gas Industry Regional Market Share
Geographic Coverage of Non-Destructive Testing in Oil and Gas Industry
Non-Destructive Testing in Oil and Gas Industry REPORT HIGHLIGHTS
| Aspects | Details |
|---|---|
| Study Period | 2020-2034 |
| Base Year | 2025 |
| Estimated Year | 2026 |
| Forecast Period | 2026-2034 |
| Historical Period | 2020-2025 |
| Growth Rate | CAGR of 8.8% from 2020-2034 |
| Segmentation |
|
Table of Contents
- 1. Introduction
- 1.1. Research Scope
- 1.2. Market Segmentation
- 1.3. Research Objective
- 1.4. Definitions and Assumptions
- 2. Executive Summary
- 2.1. Market Snapshot
- 3. Market Dynamics
- 3.1. Market Drivers
- 3.2. Market Restrains
- 3.3. Market Trends
- 3.4. Market Opportunities
- 4. Market Factor Analysis
- 4.1. Porters Five Forces
- 4.1.1. Bargaining Power of Suppliers
- 4.1.2. Bargaining Power of Buyers
- 4.1.3. Threat of New Entrants
- 4.1.4. Threat of Substitutes
- 4.1.5. Competitive Rivalry
- 4.2. PESTEL analysis
- 4.3. BCG Analysis
- 4.3.1. Stars (High Growth, High Market Share)
- 4.3.2. Cash Cows (Low Growth, High Market Share)
- 4.3.3. Question Mark (High Growth, Low Market Share)
- 4.3.4. Dogs (Low Growth, Low Market Share)
- 4.4. Ansoff Matrix Analysis
- 4.5. Supply Chain Analysis
- 4.6. Regulatory Landscape
- 4.7. Current Market Potential and Opportunity Assessment (TAM–SAM–SOM Framework)
- 4.8. TIR Analyst Note
- 4.1. Porters Five Forces
- 5. Market Analysis, Insights and Forecast 2021-2033
- 5.1. Market Analysis, Insights and Forecast - by Type
- 5.1.1. Equipment
- 5.1.2. Services
- 5.2. Market Analysis, Insights and Forecast - by Type
- 5.2.1. Upstream
- 5.2.2. Midstream
- 5.2.3. Downstream
- 5.3. Market Analysis, Insights and Forecast - by Technique
- 5.3.1. Ultrasonic
- 5.3.2. Radiography
- 5.3.3. Visual Inspection
- 5.3.4. Liquid Penetrant
- 5.3.5. Others (Magnetic Particle & Eddy Current)
- 5.4. Market Analysis, Insights and Forecast - by Region
- 5.4.1. North America
- 5.4.2. Europe
- 5.4.3. Asia Pacific
- 5.4.4. Rest of the World
- 5.1. Market Analysis, Insights and Forecast - by Type
- 6. Global Non-Destructive Testing in Oil and Gas Industry Analysis, Insights and Forecast, 2021-2033
- 6.1. Market Analysis, Insights and Forecast - by Type
- 6.1.1. Equipment
- 6.1.2. Services
- 6.2. Market Analysis, Insights and Forecast - by Type
- 6.2.1. Upstream
- 6.2.2. Midstream
- 6.2.3. Downstream
- 6.3. Market Analysis, Insights and Forecast - by Technique
- 6.3.1. Ultrasonic
- 6.3.2. Radiography
- 6.3.3. Visual Inspection
- 6.3.4. Liquid Penetrant
- 6.3.5. Others (Magnetic Particle & Eddy Current)
- 6.1. Market Analysis, Insights and Forecast - by Type
- 7. North America Non-Destructive Testing in Oil and Gas Industry Analysis, Insights and Forecast, 2020-2032
- 7.1. Market Analysis, Insights and Forecast - by Type
- 7.1.1. Equipment
- 7.1.2. Services
- 7.2. Market Analysis, Insights and Forecast - by Type
- 7.2.1. Upstream
- 7.2.2. Midstream
- 7.2.3. Downstream
- 7.3. Market Analysis, Insights and Forecast - by Technique
- 7.3.1. Ultrasonic
- 7.3.2. Radiography
- 7.3.3. Visual Inspection
- 7.3.4. Liquid Penetrant
- 7.3.5. Others (Magnetic Particle & Eddy Current)
- 7.1. Market Analysis, Insights and Forecast - by Type
- 8. Europe Non-Destructive Testing in Oil and Gas Industry Analysis, Insights and Forecast, 2020-2032
- 8.1. Market Analysis, Insights and Forecast - by Type
- 8.1.1. Equipment
- 8.1.2. Services
- 8.2. Market Analysis, Insights and Forecast - by Type
- 8.2.1. Upstream
- 8.2.2. Midstream
- 8.2.3. Downstream
- 8.3. Market Analysis, Insights and Forecast - by Technique
- 8.3.1. Ultrasonic
- 8.3.2. Radiography
- 8.3.3. Visual Inspection
- 8.3.4. Liquid Penetrant
- 8.3.5. Others (Magnetic Particle & Eddy Current)
- 8.1. Market Analysis, Insights and Forecast - by Type
- 9. Asia Pacific Non-Destructive Testing in Oil and Gas Industry Analysis, Insights and Forecast, 2020-2032
- 9.1. Market Analysis, Insights and Forecast - by Type
- 9.1.1. Equipment
- 9.1.2. Services
- 9.2. Market Analysis, Insights and Forecast - by Type
- 9.2.1. Upstream
- 9.2.2. Midstream
- 9.2.3. Downstream
- 9.3. Market Analysis, Insights and Forecast - by Technique
- 9.3.1. Ultrasonic
- 9.3.2. Radiography
- 9.3.3. Visual Inspection
- 9.3.4. Liquid Penetrant
- 9.3.5. Others (Magnetic Particle & Eddy Current)
- 9.1. Market Analysis, Insights and Forecast - by Type
- 10. Rest of the World Non-Destructive Testing in Oil and Gas Industry Analysis, Insights and Forecast, 2020-2032
- 10.1. Market Analysis, Insights and Forecast - by Type
- 10.1.1. Equipment
- 10.1.2. Services
- 10.2. Market Analysis, Insights and Forecast - by Type
- 10.2.1. Upstream
- 10.2.2. Midstream
- 10.2.3. Downstream
- 10.3. Market Analysis, Insights and Forecast - by Technique
- 10.3.1. Ultrasonic
- 10.3.2. Radiography
- 10.3.3. Visual Inspection
- 10.3.4. Liquid Penetrant
- 10.3.5. Others (Magnetic Particle & Eddy Current)
- 10.1. Market Analysis, Insights and Forecast - by Type
- 11. Competitive Analysis
- 11.1. Company Profiles
- 11.1.1 Intertek Group PLC
- 11.1.1.1. Company Overview
- 11.1.1.2. Products
- 11.1.1.3. Company Financials
- 11.1.1.4. SWOT Analysis
- 11.1.2 Zetec In
- 11.1.2.1. Company Overview
- 11.1.2.2. Products
- 11.1.2.3. Company Financials
- 11.1.2.4. SWOT Analysis
- 11.1.3 Applus Services SA
- 11.1.3.1. Company Overview
- 11.1.3.2. Products
- 11.1.3.3. Company Financials
- 11.1.3.4. SWOT Analysis
- 11.1.4 YXLON International Gmbh (COMET Group)
- 11.1.4.1. Company Overview
- 11.1.4.2. Products
- 11.1.4.3. Company Financials
- 11.1.4.4. SWOT Analysis
- 11.1.5 Fujifilm Corporation
- 11.1.5.1. Company Overview
- 11.1.5.2. Products
- 11.1.5.3. Company Financials
- 11.1.5.4. SWOT Analysis
- 11.1.6 GE Measurement and Control (Baker Hughes)
- 11.1.6.1. Company Overview
- 11.1.6.2. Products
- 11.1.6.3. Company Financials
- 11.1.6.4. SWOT Analysis
- 11.1.7 Karl Storz Ndtec Gmbh
- 11.1.7.1. Company Overview
- 11.1.7.2. Products
- 11.1.7.3. Company Financials
- 11.1.7.4. SWOT Analysis
- 11.1.8 Bureau Veritas SA
- 11.1.8.1. Company Overview
- 11.1.8.2. Products
- 11.1.8.3. Company Financials
- 11.1.8.4. SWOT Analysis
- 11.1.9 Olympus Corporation
- 11.1.9.1. Company Overview
- 11.1.9.2. Products
- 11.1.9.3. Company Financials
- 11.1.9.4. SWOT Analysis
- 11.1.10 Magnaflux Corp
- 11.1.10.1. Company Overview
- 11.1.10.2. Products
- 11.1.10.3. Company Financials
- 11.1.10.4. SWOT Analysis
- 11.1.11 Magnetic Analysis Corporation
- 11.1.11.1. Company Overview
- 11.1.11.2. Products
- 11.1.11.3. Company Financials
- 11.1.11.4. SWOT Analysis
- 11.1.1 Intertek Group PLC
- 11.2. Market Entropy
- 11.2.1 Company's Key Areas Served
- 11.2.2 Recent Developments
- 11.3. Company Market Share Analysis 2025
- 11.3.1 Top 5 Companies Market Share Analysis
- 11.3.2 Top 3 Companies Market Share Analysis
- 11.4. List of Potential Customers
- 12. Research Methodology
List of Figures
- Figure 1: Global Non-Destructive Testing in Oil and Gas Industry Revenue Breakdown (billion, %) by Region 2025 & 2033
- Figure 2: North America Non-Destructive Testing in Oil and Gas Industry Revenue (billion), by Type 2025 & 2033
- Figure 3: North America Non-Destructive Testing in Oil and Gas Industry Revenue Share (%), by Type 2025 & 2033
- Figure 4: North America Non-Destructive Testing in Oil and Gas Industry Revenue (billion), by Type 2025 & 2033
- Figure 5: North America Non-Destructive Testing in Oil and Gas Industry Revenue Share (%), by Type 2025 & 2033
- Figure 6: North America Non-Destructive Testing in Oil and Gas Industry Revenue (billion), by Technique 2025 & 2033
- Figure 7: North America Non-Destructive Testing in Oil and Gas Industry Revenue Share (%), by Technique 2025 & 2033
- Figure 8: North America Non-Destructive Testing in Oil and Gas Industry Revenue (billion), by Country 2025 & 2033
- Figure 9: North America Non-Destructive Testing in Oil and Gas Industry Revenue Share (%), by Country 2025 & 2033
- Figure 10: Europe Non-Destructive Testing in Oil and Gas Industry Revenue (billion), by Type 2025 & 2033
- Figure 11: Europe Non-Destructive Testing in Oil and Gas Industry Revenue Share (%), by Type 2025 & 2033
- Figure 12: Europe Non-Destructive Testing in Oil and Gas Industry Revenue (billion), by Type 2025 & 2033
- Figure 13: Europe Non-Destructive Testing in Oil and Gas Industry Revenue Share (%), by Type 2025 & 2033
- Figure 14: Europe Non-Destructive Testing in Oil and Gas Industry Revenue (billion), by Technique 2025 & 2033
- Figure 15: Europe Non-Destructive Testing in Oil and Gas Industry Revenue Share (%), by Technique 2025 & 2033
- Figure 16: Europe Non-Destructive Testing in Oil and Gas Industry Revenue (billion), by Country 2025 & 2033
- Figure 17: Europe Non-Destructive Testing in Oil and Gas Industry Revenue Share (%), by Country 2025 & 2033
- Figure 18: Asia Pacific Non-Destructive Testing in Oil and Gas Industry Revenue (billion), by Type 2025 & 2033
- Figure 19: Asia Pacific Non-Destructive Testing in Oil and Gas Industry Revenue Share (%), by Type 2025 & 2033
- Figure 20: Asia Pacific Non-Destructive Testing in Oil and Gas Industry Revenue (billion), by Type 2025 & 2033
- Figure 21: Asia Pacific Non-Destructive Testing in Oil and Gas Industry Revenue Share (%), by Type 2025 & 2033
- Figure 22: Asia Pacific Non-Destructive Testing in Oil and Gas Industry Revenue (billion), by Technique 2025 & 2033
- Figure 23: Asia Pacific Non-Destructive Testing in Oil and Gas Industry Revenue Share (%), by Technique 2025 & 2033
- Figure 24: Asia Pacific Non-Destructive Testing in Oil and Gas Industry Revenue (billion), by Country 2025 & 2033
- Figure 25: Asia Pacific Non-Destructive Testing in Oil and Gas Industry Revenue Share (%), by Country 2025 & 2033
- Figure 26: Rest of the World Non-Destructive Testing in Oil and Gas Industry Revenue (billion), by Type 2025 & 2033
- Figure 27: Rest of the World Non-Destructive Testing in Oil and Gas Industry Revenue Share (%), by Type 2025 & 2033
- Figure 28: Rest of the World Non-Destructive Testing in Oil and Gas Industry Revenue (billion), by Type 2025 & 2033
- Figure 29: Rest of the World Non-Destructive Testing in Oil and Gas Industry Revenue Share (%), by Type 2025 & 2033
- Figure 30: Rest of the World Non-Destructive Testing in Oil and Gas Industry Revenue (billion), by Technique 2025 & 2033
- Figure 31: Rest of the World Non-Destructive Testing in Oil and Gas Industry Revenue Share (%), by Technique 2025 & 2033
- Figure 32: Rest of the World Non-Destructive Testing in Oil and Gas Industry Revenue (billion), by Country 2025 & 2033
- Figure 33: Rest of the World Non-Destructive Testing in Oil and Gas Industry Revenue Share (%), by Country 2025 & 2033
List of Tables
- Table 1: Global Non-Destructive Testing in Oil and Gas Industry Revenue billion Forecast, by Type 2020 & 2033
- Table 2: Global Non-Destructive Testing in Oil and Gas Industry Revenue billion Forecast, by Type 2020 & 2033
- Table 3: Global Non-Destructive Testing in Oil and Gas Industry Revenue billion Forecast, by Technique 2020 & 2033
- Table 4: Global Non-Destructive Testing in Oil and Gas Industry Revenue billion Forecast, by Region 2020 & 2033
- Table 5: Global Non-Destructive Testing in Oil and Gas Industry Revenue billion Forecast, by Type 2020 & 2033
- Table 6: Global Non-Destructive Testing in Oil and Gas Industry Revenue billion Forecast, by Type 2020 & 2033
- Table 7: Global Non-Destructive Testing in Oil and Gas Industry Revenue billion Forecast, by Technique 2020 & 2033
- Table 8: Global Non-Destructive Testing in Oil and Gas Industry Revenue billion Forecast, by Country 2020 & 2033
- Table 9: Global Non-Destructive Testing in Oil and Gas Industry Revenue billion Forecast, by Type 2020 & 2033
- Table 10: Global Non-Destructive Testing in Oil and Gas Industry Revenue billion Forecast, by Type 2020 & 2033
- Table 11: Global Non-Destructive Testing in Oil and Gas Industry Revenue billion Forecast, by Technique 2020 & 2033
- Table 12: Global Non-Destructive Testing in Oil and Gas Industry Revenue billion Forecast, by Country 2020 & 2033
- Table 13: Global Non-Destructive Testing in Oil and Gas Industry Revenue billion Forecast, by Type 2020 & 2033
- Table 14: Global Non-Destructive Testing in Oil and Gas Industry Revenue billion Forecast, by Type 2020 & 2033
- Table 15: Global Non-Destructive Testing in Oil and Gas Industry Revenue billion Forecast, by Technique 2020 & 2033
- Table 16: Global Non-Destructive Testing in Oil and Gas Industry Revenue billion Forecast, by Country 2020 & 2033
- Table 17: Global Non-Destructive Testing in Oil and Gas Industry Revenue billion Forecast, by Type 2020 & 2033
- Table 18: Global Non-Destructive Testing in Oil and Gas Industry Revenue billion Forecast, by Type 2020 & 2033
- Table 19: Global Non-Destructive Testing in Oil and Gas Industry Revenue billion Forecast, by Technique 2020 & 2033
- Table 20: Global Non-Destructive Testing in Oil and Gas Industry Revenue billion Forecast, by Country 2020 & 2033
Frequently Asked Questions
1. What is the projected Compound Annual Growth Rate (CAGR) of the Non-Destructive Testing in Oil and Gas Industry?
The projected CAGR is approximately 8.8%.
2. Which companies are prominent players in the Non-Destructive Testing in Oil and Gas Industry?
Key companies in the market include Intertek Group PLC, Zetec In, Applus Services SA, YXLON International Gmbh (COMET Group), Fujifilm Corporation, GE Measurement and Control (Baker Hughes), Karl Storz Ndtec Gmbh, Bureau Veritas SA, Olympus Corporation, Magnaflux Corp, Magnetic Analysis Corporation.
3. What are the main segments of the Non-Destructive Testing in Oil and Gas Industry?
The market segments include Type, Type, Technique.
4. Can you provide details about the market size?
The market size is estimated to be USD 4.06 billion as of 2022.
5. What are some drivers contributing to market growth?
Rising need to run refinery assets at full cap; Upstream sector expected to gain momentum in key markets.
6. What are the notable trends driving market growth?
The Rising Usage of Drones in the Market.
7. Are there any restraints impacting market growth?
; High Initial Cost During First Time Setup is Challenging the Market Growth.
8. Can you provide examples of recent developments in the market?
September 2022 : Waygate Technologies introduced the Ruby|plate 240 calibration phantom for industrial computed tomography (CT). Features high-resolution insights and captures extremely accurate and effective calibration bodies to determine the exact voxel size and allows operators to detect any deviation quickly and non-destructively in geometry.
9. What pricing options are available for accessing the report?
Pricing options include single-user, multi-user, and enterprise licenses priced at USD 4750, USD 5250, and USD 8750 respectively.
10. Is the market size provided in terms of value or volume?
The market size is provided in terms of value, measured in billion.
11. Are there any specific market keywords associated with the report?
Yes, the market keyword associated with the report is "Non-Destructive Testing in Oil and Gas Industry," which aids in identifying and referencing the specific market segment covered.
12. How do I determine which pricing option suits my needs best?
The pricing options vary based on user requirements and access needs. Individual users may opt for single-user licenses, while businesses requiring broader access may choose multi-user or enterprise licenses for cost-effective access to the report.
13. Are there any additional resources or data provided in the Non-Destructive Testing in Oil and Gas Industry report?
While the report offers comprehensive insights, it's advisable to review the specific contents or supplementary materials provided to ascertain if additional resources or data are available.
14. How can I stay updated on further developments or reports in the Non-Destructive Testing in Oil and Gas Industry?
To stay informed about further developments, trends, and reports in the Non-Destructive Testing in Oil and Gas Industry, consider subscribing to industry newsletters, following relevant companies and organizations, or regularly checking reputable industry news sources and publications.
Methodology
Step 1 - Identification of Relevant Samples Size from Population Database


Step 2 - Approaches for Defining Global Market Size (Value, Volume* & Price*)

Note*: In applicable scenarios
Step 3 - Data Sources
Primary Research
- Web Analytics
- Survey Reports
- Research Institute
- Latest Research Reports
- Opinion Leaders
Secondary Research
- Annual Reports
- White Paper
- Latest Press Release
- Industry Association
- Paid Database
- Investor Presentations

Step 4 - Data Triangulation
Involves using different sources of information in order to increase the validity of a study
These sources are likely to be stakeholders in a program - participants, other researchers, program staff, other community members, and so on.
Then we put all data in single framework & apply various statistical tools to find out the dynamic on the market.
During the analysis stage, feedback from the stakeholder groups would be compared to determine areas of agreement as well as areas of divergence