

Key Insights
The global surface vision and inspection equipment market is poised for significant expansion, projected to achieve a Compound Annual Growth Rate (CAGR) of 11.20% from 2025 to 2033. This robust growth is propelled by escalating industrial automation, particularly in the automotive, electronics, and pharmaceutical sectors, demanding sophisticated inspection systems for enhanced product quality and operational efficiency. The imperative for high-precision manufacturing and adherence to stringent quality control standards are key market drivers. Technological advancements, including the integration of Artificial Intelligence (AI) and Machine Learning (ML) into vision systems, are augmenting inspection accuracy and speed. Furthermore, the widespread adoption of Industry 4.0 principles is stimulating the demand for smart factories equipped with advanced surface vision and inspection solutions. The market is segmented by components such as cameras, lighting, and optics, and by applications including automotive, electronics, medical, and food & beverage. The automotive and electronics sectors currently lead market share due to high production volumes and stringent quality requirements. While initial investment costs and the need for skilled personnel may present challenges, the market outlook remains highly favorable, offering substantial opportunities for industry stakeholders.
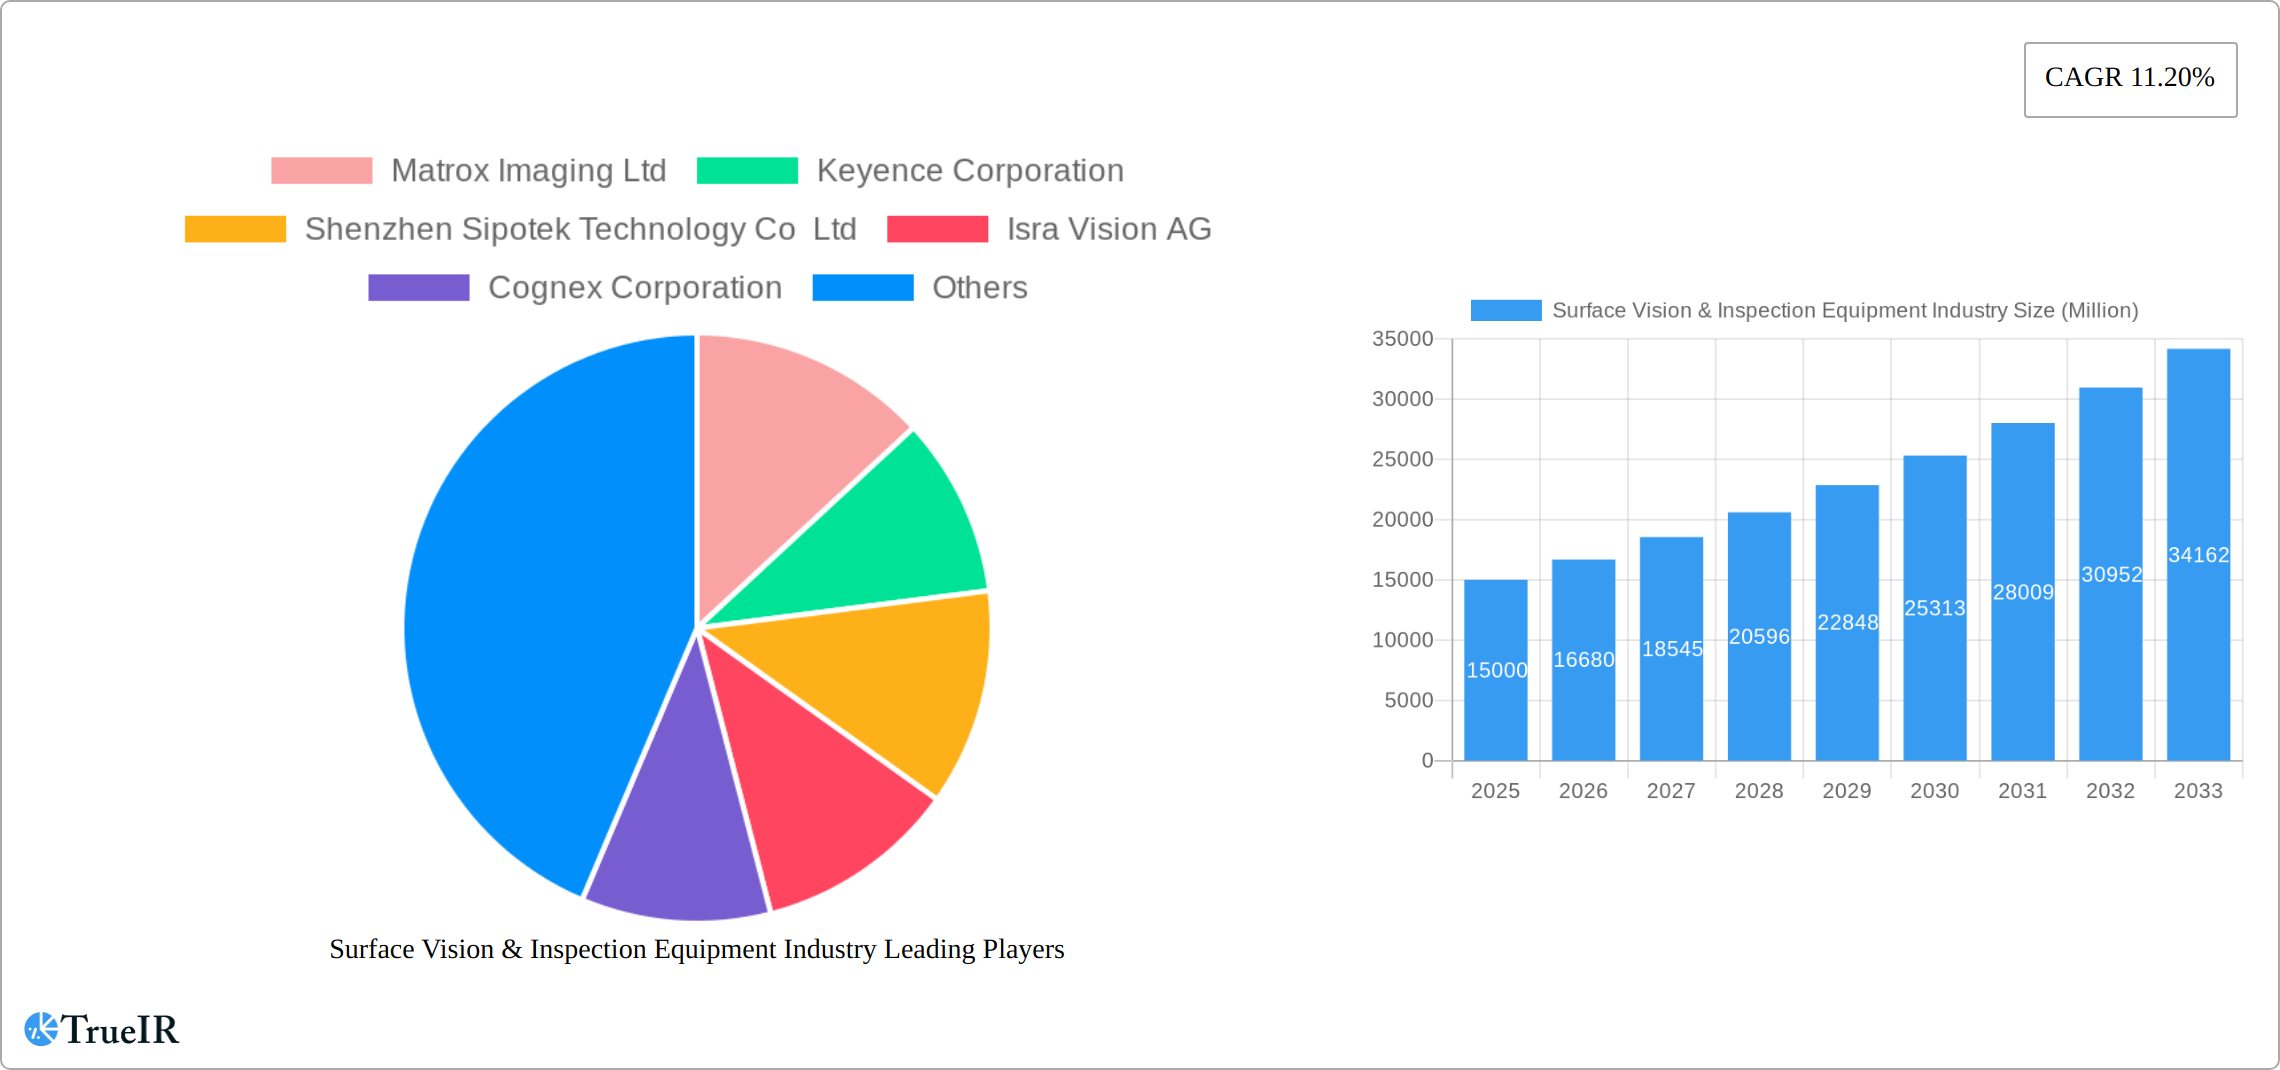
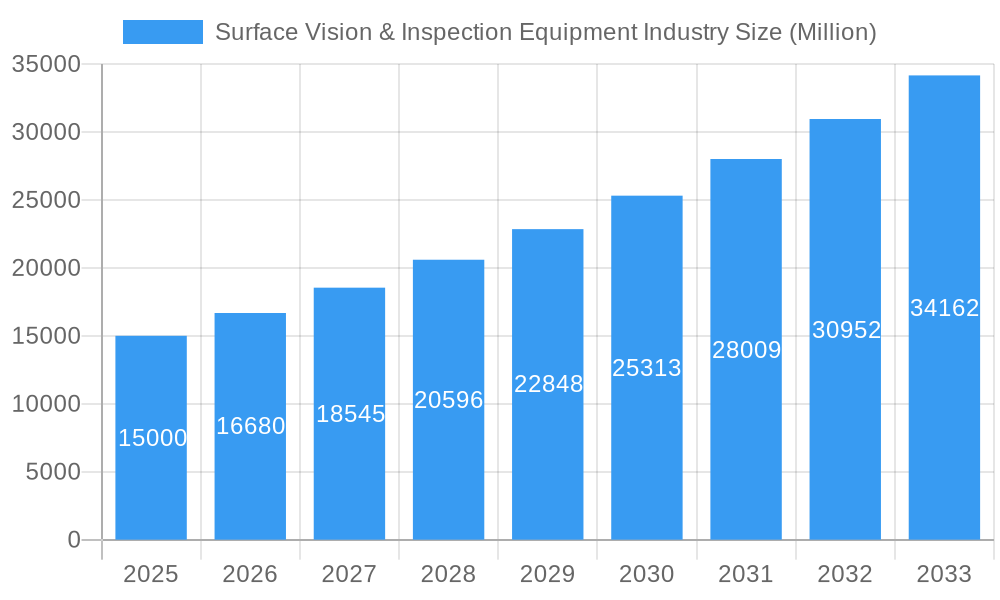
Surface Vision & Inspection Equipment Industry Market Size (In Billion)
The competitive environment features established global corporations and specialized technology providers. Prominent players like Cognex, Keyence, and Matrox Imaging leverage their extensive expertise and technological innovation to maintain a strong market position. Concurrently, new entrants are emerging with innovative and cost-effective solutions. Geographic expansion is anticipated globally, with the Asia-Pacific region expected to experience considerable growth driven by rapid industrialization and an expanding manufacturing base. North America and Europe, despite being mature markets, will continue to be significant contributors, fueled by ongoing technological upgrades and the adoption of advanced inspection techniques. In summary, the market presents a compelling investment proposition for companies offering cutting-edge and dependable surface vision and inspection solutions.
Surface Vision & Inspection Equipment Industry Company Market Share
Surface Vision & Inspection Equipment Market Report: 2019-2033
This comprehensive report delivers an in-depth analysis of the global Surface Vision & Inspection Equipment market, projecting robust growth and significant opportunities over the forecast period (2025-2033). The study covers market size, segmentation, competitive landscape, technological advancements, and key trends influencing this dynamic sector. With a detailed analysis spanning from 2019 to 2033, including a base year of 2025 and an estimated year of 2025, this report is an indispensable resource for industry professionals, investors, and strategic decision-makers.
Surface Vision & Inspection Equipment Industry Market Structure & Competitive Landscape
The global surface vision and inspection equipment market exhibits a moderately concentrated structure, with several key players commanding significant market share. The market concentration ratio (CR5) is estimated at xx% in 2025, indicating the presence of a few dominant players. However, the market also accommodates numerous smaller, specialized companies, fostering competition and innovation. Key innovation drivers include advancements in artificial intelligence (AI), machine learning (ML), and computer vision technologies, enabling more sophisticated and efficient inspection systems.
Regulatory compliance, particularly in industries like automotive and pharmaceuticals, significantly impacts market dynamics. Stringent quality control regulations drive demand for advanced inspection equipment. Product substitutes, such as manual inspection methods, are gradually being replaced due to the superior speed, accuracy, and cost-effectiveness of automated systems. End-user segmentation is diverse, encompassing automotive, electronics, medical, food & beverage, and logistics sectors.
Mergers and acquisitions (M&A) activity in the market has been relatively modest in recent years, with approximately xx M&A deals recorded between 2019 and 2024. However, strategic acquisitions are anticipated to increase as larger companies seek to expand their product portfolios and market reach. The market is characterized by ongoing competition based on factors such as technological superiority, pricing strategies, and customer support.
Surface Vision & Inspection Equipment Industry Market Trends & Opportunities
The global surface vision and inspection equipment market is experiencing robust growth, projected to achieve a Compound Annual Growth Rate (CAGR) of [Insert Projected CAGR]% during the forecast period (2025-2033). This expansion is fueled by several converging factors: the accelerating automation of manufacturing processes across diverse industries; the escalating demand for superior quality and precision in manufactured goods; and the widespread adoption of advanced imaging technologies, including high-resolution cameras, 3D imaging, hyperspectral imaging, and AI-powered vision systems. Emerging economies are witnessing significant market penetration as manufacturing activities expand. Cloud-based solutions are further revolutionizing the industry, enabling remote monitoring, predictive maintenance, and enhanced data analysis. The increasing consumer preference for high-quality, defect-free products is a key driver, alongside stricter regulatory compliance and quality assurance standards across various sectors. The competitive landscape is dynamic, featuring both established industry leaders and innovative newcomers, fostering continuous technological advancements and competitive pricing. The market size was valued at [Insert Market Size in $ Million] in 2025 and is anticipated to reach [Insert Projected Market Size in $ Million] by 2033.
Dominant Markets & Segments in Surface Vision & Inspection Equipment Industry
The automotive industry remains the leading application segment for surface vision and inspection equipment, capturing approximately [Insert Percentage]% of the market share in 2025. This dominance stems from the stringent quality control requirements in automotive manufacturing and the increasing complexity of modern vehicle designs. The electrical and electronics sector is another key market segment, driven by the growing demand for high-precision components and miniaturization trends. The medical and pharmaceutical industries are also significant contributors, due to rigorous regulatory compliance and the paramount importance of quality assurance. The food and beverage industry demonstrates substantial growth potential, fueled by the increasing consumer focus on food safety and quality control.
Key Growth Drivers by Industry:
- Automotive: Stringent quality standards, increasing automation in manufacturing, and the rise of electric and autonomous vehicles.
- Electrical & Electronics: High demand for precise components, miniaturization, and the increasing complexity of electronic devices.
- Medical & Pharmaceuticals: Stringent regulatory compliance (e.g., FDA, EMA), quality assurance needs, and the demand for sterile and precise medical devices.
- Food & Beverages: Growing demand for food safety, quality control, and traceability throughout the supply chain.
- Other Manufacturing Sectors: Increasing adoption of automation and quality control measures across diverse manufacturing processes.
By Component: The camera segment is projected to maintain its market leadership, driven by technological advancements resulting in higher resolution, faster processing speeds, and enhanced functionalities. The lighting equipment segment is experiencing parallel growth due to its crucial role in ensuring optimal illumination for accurate and reliable inspection results. Software and AI/ML algorithms also represent significant segments, driving advanced capabilities in defect detection and analysis.
Regional Dominance: North America and Asia-Pacific are anticipated to remain the leading regional markets, reflecting their high concentration of manufacturing facilities and technological innovation. Europe also holds a substantial market share, driven by strong industrial sectors and a focus on advanced manufacturing techniques.
Surface Vision & Inspection Equipment Industry Product Analysis
Recent innovations in surface vision and inspection equipment are characterized by the integration of artificial intelligence (AI) and machine learning (ML) for automated defect detection, sophisticated image processing algorithms for enhanced accuracy and speed, and the development of more compact, versatile, and user-friendly systems. These advancements empower manufacturers with superior quality control capabilities, significantly reduced inspection times, and improved overall operational efficiency. The competitive advantage increasingly lies in delivering high-speed, precise, adaptable, and user-friendly systems that seamlessly integrate into existing manufacturing workflows. Future product development will focus on enhanced ease-of-use, customizable solutions to meet specific industry needs, and the seamless integration of data analytics and cloud connectivity.
Key Drivers, Barriers & Challenges in Surface Vision & Inspection Equipment Industry
Key Drivers:
The market is driven by increasing automation in manufacturing, stringent quality control requirements across various industries, rising adoption of advanced imaging technologies, and the growth of e-commerce and its demand for efficient logistics and product quality checks.
Challenges & Restraints:
Significant challenges include high initial investment costs for advanced systems, the need for skilled personnel for system operation and maintenance, and potential supply chain disruptions impacting component availability. Furthermore, regulatory complexities and competitive pressures from both established and new entrants can hinder market growth. These factors, if unaddressed, could negatively impact the market's projected growth trajectory.
Growth Drivers in the Surface Vision & Inspection Equipment Industry Market
The market's sustained growth is driven by a confluence of factors. Rapid technological advancements, particularly in AI and machine learning, are continuously enhancing the speed, accuracy, and capabilities of inspection systems. The unwavering demand for high-quality products, coupled with stricter industry regulations and the widespread adoption of automated manufacturing processes, fuels the demand for sophisticated surface vision and inspection equipment. Government initiatives and incentives promoting industrial automation in various sectors are also providing significant impetus to market growth. Furthermore, the increasing focus on sustainability and reducing waste in manufacturing processes is creating additional opportunities for innovative inspection technologies.
Challenges Impacting Surface Vision & Inspection Equipment Industry Growth
High upfront investment costs can deter some businesses from adopting advanced systems. The need for specialized expertise to operate and maintain these complex technologies also presents a challenge. Supply chain vulnerabilities related to specific components and the increasing complexity of regulatory compliance add further barriers to growth.
Key Players Shaping the Surface Vision & Inspection Equipment Industry Market
- Matrox Imaging Ltd
- Keyence Corporation
- Shenzhen Sipotek Technology Co Ltd
- Isra Vision AG
- Cognex Corporation
- Stemmer Imaging AG
- AMETEK Surface Vision
- Omron Corporation
- Comvis AG
- Daitron Inc
- Flexfilm Ltd
- Edmund Scientific Corporation
- Panasonic Corporation
Significant Surface Vision & Inspection Equipment Industry Milestones
- 2020: Cognex Corporation launches its In-Sight 2800 vision system, featuring enhanced AI capabilities.
- 2021: Keyence Corporation introduces a new series of laser displacement sensors with improved accuracy and speed.
- 2022: Matrox Imaging Ltd releases its latest software platform with advanced image processing algorithms.
- 2023: Merger between two smaller players in the industry leads to expansion in market share. (Note: Further specific milestones require access to detailed industry news and announcements.)
Future Outlook for Surface Vision & Inspection Equipment Industry Market
The future of the surface vision and inspection equipment market looks bright. Continued technological innovation, driven by AI and machine learning, will lead to even more precise, efficient, and adaptable inspection systems. The growing demand for automation across various sectors will further propel market growth. Strategic partnerships and acquisitions among industry players will shape the competitive landscape, while emerging markets will offer significant opportunities for expansion. The market is poised for sustained growth, driven by technological advancements and a rising need for higher quality and productivity in manufacturing.
Surface Vision & Inspection Equipment Industry Segmentation
-
1. Component
- 1.1. Camera
- 1.2. Lighting Equipment
- 1.3. Optics
- 1.4. Other Components
-
2. Application
- 2.1. Automotive
- 2.2. Electrical & Electronics
- 2.3. Medical & Pharmaceuticals
- 2.4. Food & Beverages
- 2.5. Postal & Logistics
- 2.6. Other Applications
Surface Vision & Inspection Equipment Industry Segmentation By Geography
- 1. North America
- 2. Europe
- 3. Asia Pacific
- 4. Rest of the World
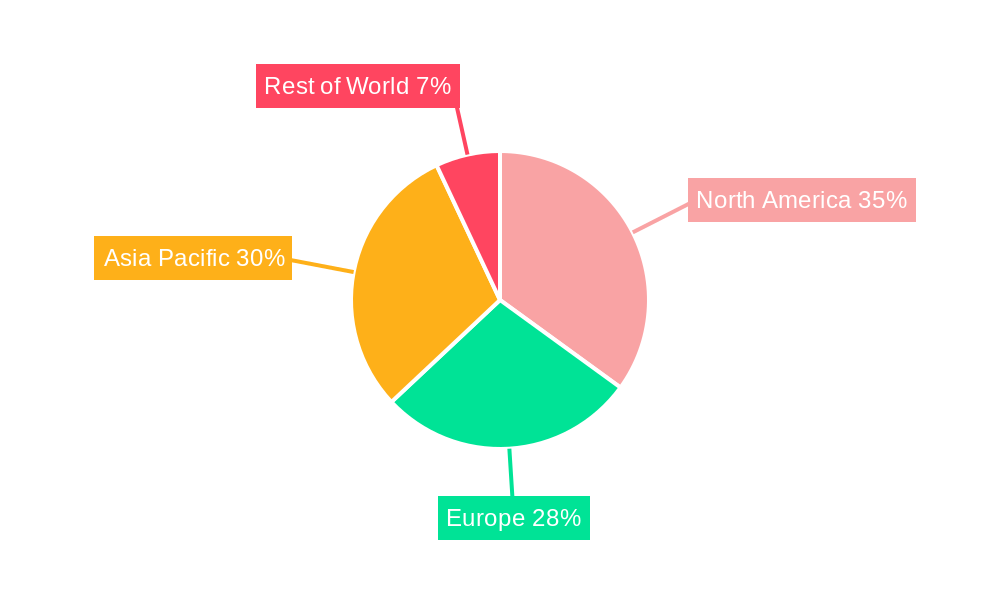
Surface Vision & Inspection Equipment Industry Regional Market Share
Geographic Coverage of Surface Vision & Inspection Equipment Industry
Surface Vision & Inspection Equipment Industry REPORT HIGHLIGHTS
| Aspects | Details |
|---|---|
| Study Period | 2020-2034 |
| Base Year | 2025 |
| Estimated Year | 2026 |
| Forecast Period | 2026-2034 |
| Historical Period | 2020-2025 |
| Growth Rate | CAGR of 14.56% from 2020-2034 |
| Segmentation |
|
Table of Contents
- 1. Introduction
- 1.1. Research Scope
- 1.2. Market Segmentation
- 1.3. Research Objective
- 1.4. Definitions and Assumptions
- 2. Executive Summary
- 2.1. Market Snapshot
- 3. Market Dynamics
- 3.1. Market Drivers
- 3.2. Market Restrains
- 3.3. Market Trends
- 3.4. Market Opportunities
- 4. Market Factor Analysis
- 4.1. Porters Five Forces
- 4.1.1. Bargaining Power of Suppliers
- 4.1.2. Bargaining Power of Buyers
- 4.1.3. Threat of New Entrants
- 4.1.4. Threat of Substitutes
- 4.1.5. Competitive Rivalry
- 4.2. PESTEL analysis
- 4.3. BCG Analysis
- 4.3.1. Stars (High Growth, High Market Share)
- 4.3.2. Cash Cows (Low Growth, High Market Share)
- 4.3.3. Question Mark (High Growth, Low Market Share)
- 4.3.4. Dogs (Low Growth, Low Market Share)
- 4.4. Ansoff Matrix Analysis
- 4.5. Supply Chain Analysis
- 4.6. Regulatory Landscape
- 4.7. Current Market Potential and Opportunity Assessment (TAM–SAM–SOM Framework)
- 4.8. TIR Analyst Note
- 4.1. Porters Five Forces
- 5. Market Analysis, Insights and Forecast 2021-2033
- 5.1. Market Analysis, Insights and Forecast - by Component
- 5.1.1. Camera
- 5.1.2. Lighting Equipment
- 5.1.3. Optics
- 5.1.4. Other Components
- 5.2. Market Analysis, Insights and Forecast - by Application
- 5.2.1. Automotive
- 5.2.2. Electrical & Electronics
- 5.2.3. Medical & Pharmaceuticals
- 5.2.4. Food & Beverages
- 5.2.5. Postal & Logistics
- 5.2.6. Other Applications
- 5.3. Market Analysis, Insights and Forecast - by Region
- 5.3.1. North America
- 5.3.2. Europe
- 5.3.3. Asia Pacific
- 5.3.4. Rest of the World
- 5.1. Market Analysis, Insights and Forecast - by Component
- 6. Global Surface Vision & Inspection Equipment Industry Analysis, Insights and Forecast, 2021-2033
- 6.1. Market Analysis, Insights and Forecast - by Component
- 6.1.1. Camera
- 6.1.2. Lighting Equipment
- 6.1.3. Optics
- 6.1.4. Other Components
- 6.2. Market Analysis, Insights and Forecast - by Application
- 6.2.1. Automotive
- 6.2.2. Electrical & Electronics
- 6.2.3. Medical & Pharmaceuticals
- 6.2.4. Food & Beverages
- 6.2.5. Postal & Logistics
- 6.2.6. Other Applications
- 6.1. Market Analysis, Insights and Forecast - by Component
- 7. North America Surface Vision & Inspection Equipment Industry Analysis, Insights and Forecast, 2020-2032
- 7.1. Market Analysis, Insights and Forecast - by Component
- 7.1.1. Camera
- 7.1.2. Lighting Equipment
- 7.1.3. Optics
- 7.1.4. Other Components
- 7.2. Market Analysis, Insights and Forecast - by Application
- 7.2.1. Automotive
- 7.2.2. Electrical & Electronics
- 7.2.3. Medical & Pharmaceuticals
- 7.2.4. Food & Beverages
- 7.2.5. Postal & Logistics
- 7.2.6. Other Applications
- 7.1. Market Analysis, Insights and Forecast - by Component
- 8. Europe Surface Vision & Inspection Equipment Industry Analysis, Insights and Forecast, 2020-2032
- 8.1. Market Analysis, Insights and Forecast - by Component
- 8.1.1. Camera
- 8.1.2. Lighting Equipment
- 8.1.3. Optics
- 8.1.4. Other Components
- 8.2. Market Analysis, Insights and Forecast - by Application
- 8.2.1. Automotive
- 8.2.2. Electrical & Electronics
- 8.2.3. Medical & Pharmaceuticals
- 8.2.4. Food & Beverages
- 8.2.5. Postal & Logistics
- 8.2.6. Other Applications
- 8.1. Market Analysis, Insights and Forecast - by Component
- 9. Asia Pacific Surface Vision & Inspection Equipment Industry Analysis, Insights and Forecast, 2020-2032
- 9.1. Market Analysis, Insights and Forecast - by Component
- 9.1.1. Camera
- 9.1.2. Lighting Equipment
- 9.1.3. Optics
- 9.1.4. Other Components
- 9.2. Market Analysis, Insights and Forecast - by Application
- 9.2.1. Automotive
- 9.2.2. Electrical & Electronics
- 9.2.3. Medical & Pharmaceuticals
- 9.2.4. Food & Beverages
- 9.2.5. Postal & Logistics
- 9.2.6. Other Applications
- 9.1. Market Analysis, Insights and Forecast - by Component
- 10. Rest of the World Surface Vision & Inspection Equipment Industry Analysis, Insights and Forecast, 2020-2032
- 10.1. Market Analysis, Insights and Forecast - by Component
- 10.1.1. Camera
- 10.1.2. Lighting Equipment
- 10.1.3. Optics
- 10.1.4. Other Components
- 10.2. Market Analysis, Insights and Forecast - by Application
- 10.2.1. Automotive
- 10.2.2. Electrical & Electronics
- 10.2.3. Medical & Pharmaceuticals
- 10.2.4. Food & Beverages
- 10.2.5. Postal & Logistics
- 10.2.6. Other Applications
- 10.1. Market Analysis, Insights and Forecast - by Component
- 11. Competitive Analysis
- 11.1. Company Profiles
- 11.1.1 Matrox Imaging Ltd
- 11.1.1.1. Company Overview
- 11.1.1.2. Products
- 11.1.1.3. Company Financials
- 11.1.1.4. SWOT Analysis
- 11.1.2 Keyence Corporation
- 11.1.2.1. Company Overview
- 11.1.2.2. Products
- 11.1.2.3. Company Financials
- 11.1.2.4. SWOT Analysis
- 11.1.3 Shenzhen Sipotek Technology Co Ltd
- 11.1.3.1. Company Overview
- 11.1.3.2. Products
- 11.1.3.3. Company Financials
- 11.1.3.4. SWOT Analysis
- 11.1.4 Isra Vision AG
- 11.1.4.1. Company Overview
- 11.1.4.2. Products
- 11.1.4.3. Company Financials
- 11.1.4.4. SWOT Analysis
- 11.1.5 Cognex Corporation
- 11.1.5.1. Company Overview
- 11.1.5.2. Products
- 11.1.5.3. Company Financials
- 11.1.5.4. SWOT Analysis
- 11.1.6 Stemmer Imaging AG
- 11.1.6.1. Company Overview
- 11.1.6.2. Products
- 11.1.6.3. Company Financials
- 11.1.6.4. SWOT Analysis
- 11.1.7 AMETEK Surface Vision
- 11.1.7.1. Company Overview
- 11.1.7.2. Products
- 11.1.7.3. Company Financials
- 11.1.7.4. SWOT Analysis
- 11.1.8 Omron Corporation
- 11.1.8.1. Company Overview
- 11.1.8.2. Products
- 11.1.8.3. Company Financials
- 11.1.8.4. SWOT Analysis
- 11.1.9 Comvis AG*List Not Exhaustive
- 11.1.9.1. Company Overview
- 11.1.9.2. Products
- 11.1.9.3. Company Financials
- 11.1.9.4. SWOT Analysis
- 11.1.10 Daitron Inc
- 11.1.10.1. Company Overview
- 11.1.10.2. Products
- 11.1.10.3. Company Financials
- 11.1.10.4. SWOT Analysis
- 11.1.11 Flexfilm Ltd
- 11.1.11.1. Company Overview
- 11.1.11.2. Products
- 11.1.11.3. Company Financials
- 11.1.11.4. SWOT Analysis
- 11.1.12 Edmund Scientific Corporation
- 11.1.12.1. Company Overview
- 11.1.12.2. Products
- 11.1.12.3. Company Financials
- 11.1.12.4. SWOT Analysis
- 11.1.13 Panasonic Corporation
- 11.1.13.1. Company Overview
- 11.1.13.2. Products
- 11.1.13.3. Company Financials
- 11.1.13.4. SWOT Analysis
- 11.1.1 Matrox Imaging Ltd
- 11.2. Market Entropy
- 11.2.1 Company's Key Areas Served
- 11.2.2 Recent Developments
- 11.3. Company Market Share Analysis 2025
- 11.3.1 Top 5 Companies Market Share Analysis
- 11.3.2 Top 3 Companies Market Share Analysis
- 11.4. List of Potential Customers
- 12. Research Methodology
List of Figures
- Figure 1: Global Surface Vision & Inspection Equipment Industry Revenue Breakdown (billion, %) by Region 2025 & 2033
- Figure 2: North America Surface Vision & Inspection Equipment Industry Revenue (billion), by Component 2025 & 2033
- Figure 3: North America Surface Vision & Inspection Equipment Industry Revenue Share (%), by Component 2025 & 2033
- Figure 4: North America Surface Vision & Inspection Equipment Industry Revenue (billion), by Application 2025 & 2033
- Figure 5: North America Surface Vision & Inspection Equipment Industry Revenue Share (%), by Application 2025 & 2033
- Figure 6: North America Surface Vision & Inspection Equipment Industry Revenue (billion), by Country 2025 & 2033
- Figure 7: North America Surface Vision & Inspection Equipment Industry Revenue Share (%), by Country 2025 & 2033
- Figure 8: Europe Surface Vision & Inspection Equipment Industry Revenue (billion), by Component 2025 & 2033
- Figure 9: Europe Surface Vision & Inspection Equipment Industry Revenue Share (%), by Component 2025 & 2033
- Figure 10: Europe Surface Vision & Inspection Equipment Industry Revenue (billion), by Application 2025 & 2033
- Figure 11: Europe Surface Vision & Inspection Equipment Industry Revenue Share (%), by Application 2025 & 2033
- Figure 12: Europe Surface Vision & Inspection Equipment Industry Revenue (billion), by Country 2025 & 2033
- Figure 13: Europe Surface Vision & Inspection Equipment Industry Revenue Share (%), by Country 2025 & 2033
- Figure 14: Asia Pacific Surface Vision & Inspection Equipment Industry Revenue (billion), by Component 2025 & 2033
- Figure 15: Asia Pacific Surface Vision & Inspection Equipment Industry Revenue Share (%), by Component 2025 & 2033
- Figure 16: Asia Pacific Surface Vision & Inspection Equipment Industry Revenue (billion), by Application 2025 & 2033
- Figure 17: Asia Pacific Surface Vision & Inspection Equipment Industry Revenue Share (%), by Application 2025 & 2033
- Figure 18: Asia Pacific Surface Vision & Inspection Equipment Industry Revenue (billion), by Country 2025 & 2033
- Figure 19: Asia Pacific Surface Vision & Inspection Equipment Industry Revenue Share (%), by Country 2025 & 2033
- Figure 20: Rest of the World Surface Vision & Inspection Equipment Industry Revenue (billion), by Component 2025 & 2033
- Figure 21: Rest of the World Surface Vision & Inspection Equipment Industry Revenue Share (%), by Component 2025 & 2033
- Figure 22: Rest of the World Surface Vision & Inspection Equipment Industry Revenue (billion), by Application 2025 & 2033
- Figure 23: Rest of the World Surface Vision & Inspection Equipment Industry Revenue Share (%), by Application 2025 & 2033
- Figure 24: Rest of the World Surface Vision & Inspection Equipment Industry Revenue (billion), by Country 2025 & 2033
- Figure 25: Rest of the World Surface Vision & Inspection Equipment Industry Revenue Share (%), by Country 2025 & 2033
List of Tables
- Table 1: Global Surface Vision & Inspection Equipment Industry Revenue billion Forecast, by Component 2020 & 2033
- Table 2: Global Surface Vision & Inspection Equipment Industry Revenue billion Forecast, by Application 2020 & 2033
- Table 3: Global Surface Vision & Inspection Equipment Industry Revenue billion Forecast, by Region 2020 & 2033
- Table 4: Global Surface Vision & Inspection Equipment Industry Revenue billion Forecast, by Component 2020 & 2033
- Table 5: Global Surface Vision & Inspection Equipment Industry Revenue billion Forecast, by Application 2020 & 2033
- Table 6: Global Surface Vision & Inspection Equipment Industry Revenue billion Forecast, by Country 2020 & 2033
- Table 7: Global Surface Vision & Inspection Equipment Industry Revenue billion Forecast, by Component 2020 & 2033
- Table 8: Global Surface Vision & Inspection Equipment Industry Revenue billion Forecast, by Application 2020 & 2033
- Table 9: Global Surface Vision & Inspection Equipment Industry Revenue billion Forecast, by Country 2020 & 2033
- Table 10: Global Surface Vision & Inspection Equipment Industry Revenue billion Forecast, by Component 2020 & 2033
- Table 11: Global Surface Vision & Inspection Equipment Industry Revenue billion Forecast, by Application 2020 & 2033
- Table 12: Global Surface Vision & Inspection Equipment Industry Revenue billion Forecast, by Country 2020 & 2033
- Table 13: Global Surface Vision & Inspection Equipment Industry Revenue billion Forecast, by Component 2020 & 2033
- Table 14: Global Surface Vision & Inspection Equipment Industry Revenue billion Forecast, by Application 2020 & 2033
- Table 15: Global Surface Vision & Inspection Equipment Industry Revenue billion Forecast, by Country 2020 & 2033
Frequently Asked Questions
1. What is the projected Compound Annual Growth Rate (CAGR) of the Surface Vision & Inspection Equipment Industry?
The projected CAGR is approximately 14.56%.
2. Which companies are prominent players in the Surface Vision & Inspection Equipment Industry?
Key companies in the market include Matrox Imaging Ltd, Keyence Corporation, Shenzhen Sipotek Technology Co Ltd, Isra Vision AG, Cognex Corporation, Stemmer Imaging AG, AMETEK Surface Vision, Omron Corporation, Comvis AG*List Not Exhaustive, Daitron Inc, Flexfilm Ltd, Edmund Scientific Corporation, Panasonic Corporation.
3. What are the main segments of the Surface Vision & Inspection Equipment Industry?
The market segments include Component, Application.
4. Can you provide details about the market size?
The market size is estimated to be USD 14.86 billion as of 2022.
5. What are some drivers contributing to market growth?
; Increasing Need for Better Manufacturing Production Capacity at Reduced Cost; Growing Demand for Qualitative Products; Increasing Adoption of Industrial 4.0 and IoT.
6. What are the notable trends driving market growth?
Camera Segment is expected to Hold the Largest Market Size during the Forecast Period.
7. Are there any restraints impacting market growth?
; Lack of Skilled Labor.
8. Can you provide examples of recent developments in the market?
N/A
9. What pricing options are available for accessing the report?
Pricing options include single-user, multi-user, and enterprise licenses priced at USD 4750, USD 5250, and USD 8750 respectively.
10. Is the market size provided in terms of value or volume?
The market size is provided in terms of value, measured in billion.
11. Are there any specific market keywords associated with the report?
Yes, the market keyword associated with the report is "Surface Vision & Inspection Equipment Industry," which aids in identifying and referencing the specific market segment covered.
12. How do I determine which pricing option suits my needs best?
The pricing options vary based on user requirements and access needs. Individual users may opt for single-user licenses, while businesses requiring broader access may choose multi-user or enterprise licenses for cost-effective access to the report.
13. Are there any additional resources or data provided in the Surface Vision & Inspection Equipment Industry report?
While the report offers comprehensive insights, it's advisable to review the specific contents or supplementary materials provided to ascertain if additional resources or data are available.
14. How can I stay updated on further developments or reports in the Surface Vision & Inspection Equipment Industry?
To stay informed about further developments, trends, and reports in the Surface Vision & Inspection Equipment Industry, consider subscribing to industry newsletters, following relevant companies and organizations, or regularly checking reputable industry news sources and publications.
Methodology
Step 1 - Identification of Relevant Samples Size from Population Database


Step 2 - Approaches for Defining Global Market Size (Value, Volume* & Price*)

Note*: In applicable scenarios
Step 3 - Data Sources
Primary Research
- Web Analytics
- Survey Reports
- Research Institute
- Latest Research Reports
- Opinion Leaders
Secondary Research
- Annual Reports
- White Paper
- Latest Press Release
- Industry Association
- Paid Database
- Investor Presentations

Step 4 - Data Triangulation
Involves using different sources of information in order to increase the validity of a study
These sources are likely to be stakeholders in a program - participants, other researchers, program staff, other community members, and so on.
Then we put all data in single framework & apply various statistical tools to find out the dynamic on the market.
During the analysis stage, feedback from the stakeholder groups would be compared to determine areas of agreement as well as areas of divergence