

Key Insights
The Asia-Pacific (APAC) blister packaging market is experiencing substantial growth, propelled by the expanding pharmaceutical and consumer goods sectors, particularly in China and India. With a projected Compound Annual Growth Rate (CAGR) of 5.2% from a 2024 base year, the market is forecast to reach a size of approximately $23.57 billion. Thermoforming remains the predominant manufacturing process, utilizing plastic films as the leading material due to their cost-effectiveness and adaptability. However, increasing environmental consciousness is driving innovation towards sustainable alternatives, such as paper and paperboard, which may reshape material segment dominance. The escalating demand for tamper-evident and child-resistant packaging further stimulates market expansion. A growing middle class across APAC nations is also a key contributor, boosting demand for consumer goods that utilize blister packaging. Challenges include fluctuating raw material costs and stringent regulatory compliance for pharmaceutical applications, which may present growth constraints. Leading companies like Uflex Limited and Amcor are investing in advanced technologies and sustainable solutions to maintain market competitiveness and meet evolving industry requirements.
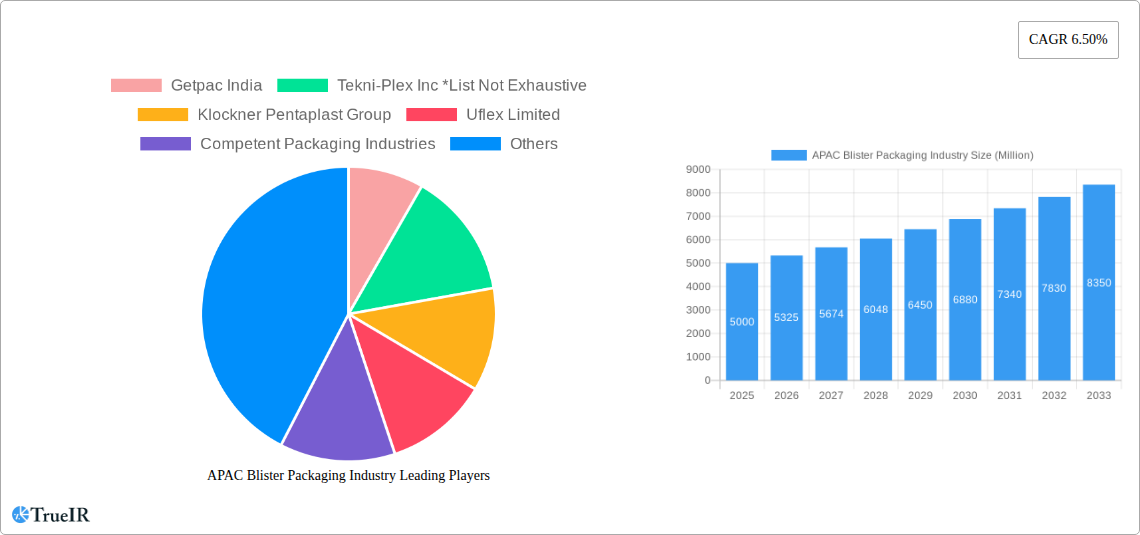
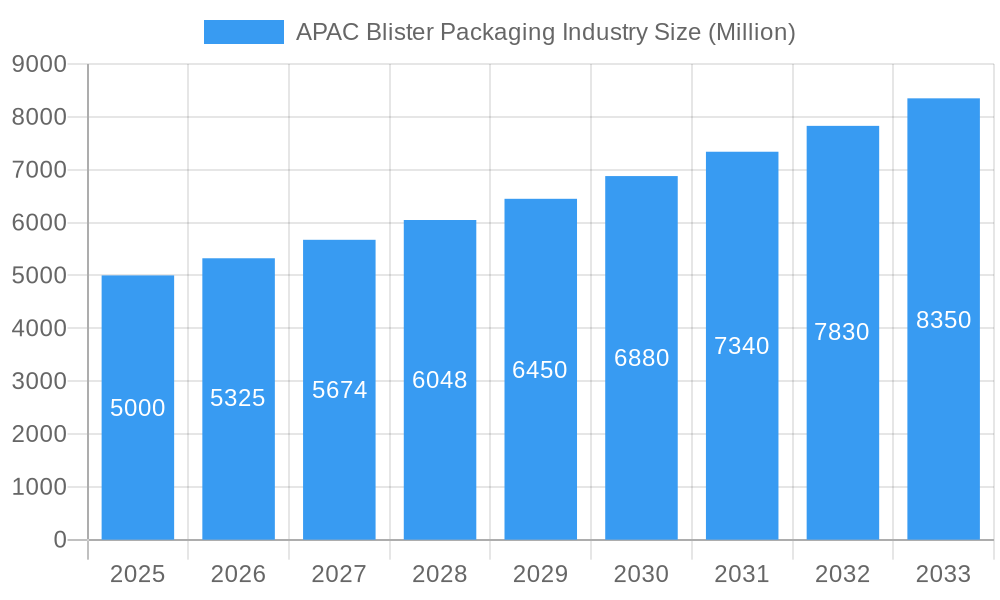
APAC Blister Packaging Industry Market Size (In Billion)
Significant regional dynamics characterize the APAC market. China and India are primary growth engines due to their large populations and robust manufacturing capabilities. Japan, while having a smaller population, boasts a sophisticated and technologically advanced packaging industry. The broader "Rest of Asia-Pacific" region also shows promising growth potential. The ongoing expansion of e-commerce and the proliferation of personalized healthcare products are further accelerating market growth across various end-user industries within APAC. The competitive arena features a blend of global corporations and local manufacturers, fostering both innovative product development and competitive pricing strategies.
APAC Blister Packaging Industry Company Market Share
APAC Blister Packaging Industry Report: 2019-2033 Forecast
This comprehensive report provides a detailed analysis of the Asia-Pacific (APAC) blister packaging industry, offering invaluable insights for businesses, investors, and stakeholders. Covering the period 2019-2033, with a base year of 2025, this study unravels market dynamics, growth drivers, challenges, and future opportunities within this rapidly evolving sector. The report leverages extensive data analysis and expert insights to provide a clear picture of the APAC blister packaging market, valued at $XX Million in 2025 and projected to reach $XX Million by 2033, exhibiting a CAGR of XX%.
APAC Blister Packaging Industry Market Structure & Competitive Landscape
The APAC blister packaging market is characterized by a moderately concentrated structure, with a few major players holding significant market share. The Herfindahl-Hirschman Index (HHI) for the market is estimated at XX in 2025, indicating a moderately competitive landscape. Innovation is a key driver, with companies constantly developing new materials and technologies to improve product performance and sustainability. Stringent regulatory frameworks, particularly concerning material safety and environmental impact, significantly influence market operations. The industry witnesses ongoing M&A activity, with several significant deals recorded in the historical period (2019-2024), totaling approximately $XX Million in value. Product substitution is a notable factor, with alternatives like clamshell packaging and modified atmosphere packaging emerging as competitors. End-user segmentation is critical, with significant demand from the pharmaceutical, consumer goods, and industrial sectors.
- Market Concentration: Moderately concentrated, HHI of XX in 2025.
- Innovation Drivers: Sustainable materials, advanced automation, improved barrier properties.
- Regulatory Impacts: Stringent regulations on material safety and environmental compliance.
- Product Substitutes: Clamshell packaging, modified atmosphere packaging.
- End-User Segmentation: Pharmaceutical, Consumer Goods, Industrial, Others.
- M&A Trends: Significant activity in 2019-2024, totaling approximately $XX Million in value.
APAC Blister Packaging Industry Market Trends & Opportunities
The APAC blister packaging market is experiencing robust growth, fueled by increasing demand across diverse end-user industries. The market size is projected to expand significantly over the forecast period (2025-2033), driven by factors such as rising disposable incomes, increasing consumption of packaged goods, and the growth of e-commerce. Technological advancements, including the adoption of automated packaging lines and sustainable materials, are reshaping the industry. Consumer preferences are shifting towards eco-friendly packaging options, creating opportunities for biodegradable and recyclable blister packaging. Competitive dynamics are intense, with companies focusing on product differentiation, cost optimization, and expanding their geographical reach. The market penetration rate for blister packaging in key segments is steadily increasing, reflecting its growing popularity.
Dominant Markets & Segments in APAC Blister Packaging Industry
The APAC blister packaging market is dominated by China and India, accounting for a significant portion of the overall market volume. These countries benefit from large populations, expanding middle classes, and robust manufacturing sectors. Japan holds a substantial market share, driven by its advanced manufacturing capabilities and high demand for high-quality packaging solutions. The thermoforming process holds the largest share in the processing segment, while plastic films remain the most widely used material. The pharmaceutical and consumer goods industries are the leading end-users.
By Country: China, India, and Japan are the leading markets.
- Growth Drivers (China): Booming e-commerce, expanding pharmaceutical sector, government initiatives to improve packaging standards.
- Growth Drivers (India): Rising disposable incomes, growing FMCG sector, increasing adoption of modern packaging technologies.
- Growth Drivers (Japan): Advanced manufacturing capabilities, stringent quality standards, high demand for sophisticated packaging solutions.
By Process: Thermoforming is the dominant process.
By Material: Plastic films are the most commonly used material.
By End-User Industry: Pharmaceutical and Consumer Goods dominate.
APAC Blister Packaging Industry Product Analysis
Recent innovations in blister packaging focus on improved barrier properties, enhanced sustainability, and greater automation capabilities. New materials are emerging, including biodegradable plastics and recycled content options. These advancements cater to evolving consumer demands and regulatory requirements. Competitive advantages are achieved through superior product design, cost-effective manufacturing, and efficient supply chain management. The market increasingly favors customized solutions tailored to specific end-user needs.
Key Drivers, Barriers & Challenges in APAC Blister Packaging Industry
Key Drivers: Rising demand for packaged goods, increasing disposable incomes across the region, advancements in automation and materials science, and favorable government policies promoting industrial growth.
Challenges: Fluctuating raw material prices, intense competition, environmental concerns around plastic waste, and complex regulatory landscapes in some countries. Supply chain disruptions can cause significant delays and cost increases, impacting overall market growth.
Growth Drivers in the APAC Blister Packaging Industry Market
The APAC blister packaging market growth is primarily driven by increasing demand from the pharmaceutical, consumer goods, and electronics industries. Technological advancements in materials science are creating lighter, more sustainable, and tamper-evident packaging. Moreover, supportive government regulations and infrastructure development are facilitating market expansion.
Challenges Impacting APAP Blister Packaging Industry Growth
The industry faces challenges such as fluctuating raw material costs, environmental concerns regarding plastic waste, and intense competition from alternative packaging solutions. Stricter regulations on material safety and sustainability present hurdles for manufacturers. Supply chain disruptions can lead to production delays and increased costs.
Key Players Shaping the APAC Blister Packaging Industry Market
- Getpac India
- Tekni-Plex Inc
- Klockner Pentaplast Group
- Uflex Limited
- Competent Packaging Industries
- Amcor Flexible India Pvt Ltd
- Constantia Flexibles
Significant APAC Blister Packaging Industry Industry Milestones
- 2021: Introduction of a new biodegradable blister packaging material by [Company Name].
- 2022: Merger of two leading blister packaging manufacturers in China.
- 2023: Launch of a fully automated blister packaging line by [Company Name].
- 2024: Implementation of new environmental regulations impacting blister packaging materials in India.
Future Outlook for APAC Blister Packaging Industry Market
The APAC blister packaging market is poised for continued growth, driven by the factors mentioned above. Strategic investments in automation, sustainable materials, and customized solutions will be crucial for success. The market presents significant opportunities for companies that can effectively adapt to changing consumer demands and regulatory environments. Focus on innovation and sustainability will be key to capturing market share and achieving long-term growth in this dynamic industry.
APAC Blister Packaging Industry Segmentation
-
1. Process
- 1.1. Thermoforming
- 1.2. Coldforming
-
2. Material
- 2.1. Plastic Films
- 2.2. Paper & Paperboard
- 2.3. Aluminum
- 2.4. Other Materials
-
3. End-User Industry
- 3.1. Consumer Goods
- 3.2. Pharmaceutical
- 3.3. Industrial
- 3.4. Other End-user Industries
APAC Blister Packaging Industry Segmentation By Geography
-
1. North America
- 1.1. United States
- 1.2. Canada
- 1.3. Mexico
-
2. South America
- 2.1. Brazil
- 2.2. Argentina
- 2.3. Rest of South America
-
3. Europe
- 3.1. United Kingdom
- 3.2. Germany
- 3.3. France
- 3.4. Italy
- 3.5. Spain
- 3.6. Russia
- 3.7. Benelux
- 3.8. Nordics
- 3.9. Rest of Europe
-
4. Middle East & Africa
- 4.1. Turkey
- 4.2. Israel
- 4.3. GCC
- 4.4. North Africa
- 4.5. South Africa
- 4.6. Rest of Middle East & Africa
-
5. Asia Pacific
- 5.1. China
- 5.2. India
- 5.3. Japan
- 5.4. South Korea
- 5.5. ASEAN
- 5.6. Oceania
- 5.7. Rest of Asia Pacific
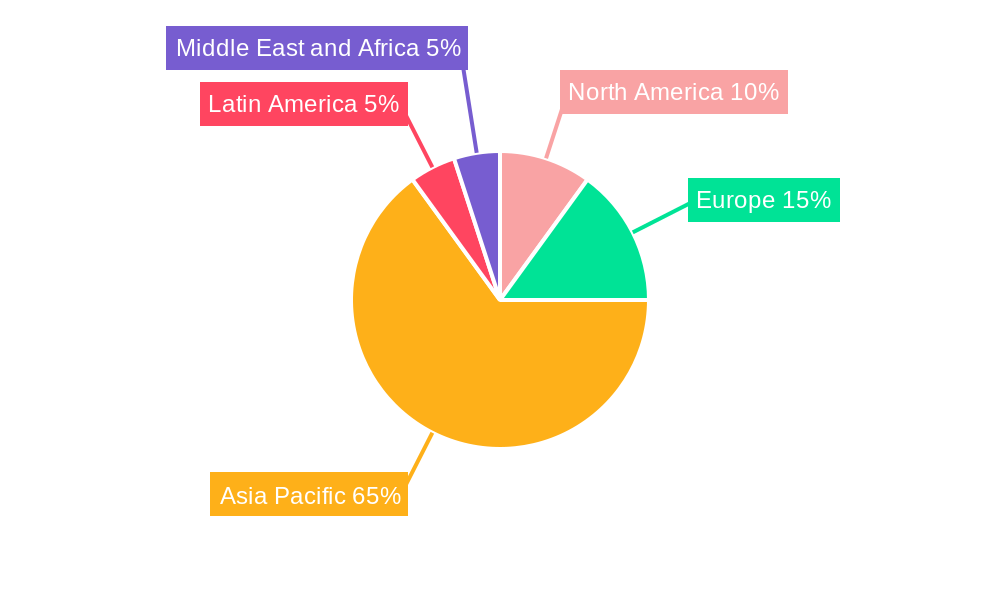
APAC Blister Packaging Industry Regional Market Share
Geographic Coverage of APAC Blister Packaging Industry
APAC Blister Packaging Industry REPORT HIGHLIGHTS
| Aspects | Details |
|---|---|
| Study Period | 2020-2034 |
| Base Year | 2025 |
| Estimated Year | 2026 |
| Forecast Period | 2026-2034 |
| Historical Period | 2020-2025 |
| Growth Rate | CAGR of 5.2% from 2020-2034 |
| Segmentation |
|
Table of Contents
- 1. Introduction
- 1.1. Research Scope
- 1.2. Market Segmentation
- 1.3. Research Objective
- 1.4. Definitions and Assumptions
- 2. Executive Summary
- 2.1. Market Snapshot
- 3. Market Dynamics
- 3.1. Market Drivers
- 3.2. Market Restrains
- 3.3. Market Trends
- 3.4. Market Opportunities
- 4. Market Factor Analysis
- 4.1. Porters Five Forces
- 4.1.1. Bargaining Power of Suppliers
- 4.1.2. Bargaining Power of Buyers
- 4.1.3. Threat of New Entrants
- 4.1.4. Threat of Substitutes
- 4.1.5. Competitive Rivalry
- 4.2. PESTEL analysis
- 4.3. BCG Analysis
- 4.3.1. Stars (High Growth, High Market Share)
- 4.3.2. Cash Cows (Low Growth, High Market Share)
- 4.3.3. Question Mark (High Growth, Low Market Share)
- 4.3.4. Dogs (Low Growth, Low Market Share)
- 4.4. Ansoff Matrix Analysis
- 4.5. Supply Chain Analysis
- 4.6. Regulatory Landscape
- 4.7. Current Market Potential and Opportunity Assessment (TAM–SAM–SOM Framework)
- 4.8. TIR Analyst Note
- 4.1. Porters Five Forces
- 5. Market Analysis, Insights and Forecast 2021-2033
- 5.1. Market Analysis, Insights and Forecast - by Process
- 5.1.1. Thermoforming
- 5.1.2. Coldforming
- 5.2. Market Analysis, Insights and Forecast - by Material
- 5.2.1. Plastic Films
- 5.2.2. Paper & Paperboard
- 5.2.3. Aluminum
- 5.2.4. Other Materials
- 5.3. Market Analysis, Insights and Forecast - by End-User Industry
- 5.3.1. Consumer Goods
- 5.3.2. Pharmaceutical
- 5.3.3. Industrial
- 5.3.4. Other End-user Industries
- 5.4. Market Analysis, Insights and Forecast - by Region
- 5.4.1. North America
- 5.4.2. South America
- 5.4.3. Europe
- 5.4.4. Middle East & Africa
- 5.4.5. Asia Pacific
- 5.1. Market Analysis, Insights and Forecast - by Process
- 6. Global APAC Blister Packaging Industry Analysis, Insights and Forecast, 2021-2033
- 6.1. Market Analysis, Insights and Forecast - by Process
- 6.1.1. Thermoforming
- 6.1.2. Coldforming
- 6.2. Market Analysis, Insights and Forecast - by Material
- 6.2.1. Plastic Films
- 6.2.2. Paper & Paperboard
- 6.2.3. Aluminum
- 6.2.4. Other Materials
- 6.3. Market Analysis, Insights and Forecast - by End-User Industry
- 6.3.1. Consumer Goods
- 6.3.2. Pharmaceutical
- 6.3.3. Industrial
- 6.3.4. Other End-user Industries
- 6.1. Market Analysis, Insights and Forecast - by Process
- 7. North America APAC Blister Packaging Industry Analysis, Insights and Forecast, 2020-2032
- 7.1. Market Analysis, Insights and Forecast - by Process
- 7.1.1. Thermoforming
- 7.1.2. Coldforming
- 7.2. Market Analysis, Insights and Forecast - by Material
- 7.2.1. Plastic Films
- 7.2.2. Paper & Paperboard
- 7.2.3. Aluminum
- 7.2.4. Other Materials
- 7.3. Market Analysis, Insights and Forecast - by End-User Industry
- 7.3.1. Consumer Goods
- 7.3.2. Pharmaceutical
- 7.3.3. Industrial
- 7.3.4. Other End-user Industries
- 7.1. Market Analysis, Insights and Forecast - by Process
- 8. South America APAC Blister Packaging Industry Analysis, Insights and Forecast, 2020-2032
- 8.1. Market Analysis, Insights and Forecast - by Process
- 8.1.1. Thermoforming
- 8.1.2. Coldforming
- 8.2. Market Analysis, Insights and Forecast - by Material
- 8.2.1. Plastic Films
- 8.2.2. Paper & Paperboard
- 8.2.3. Aluminum
- 8.2.4. Other Materials
- 8.3. Market Analysis, Insights and Forecast - by End-User Industry
- 8.3.1. Consumer Goods
- 8.3.2. Pharmaceutical
- 8.3.3. Industrial
- 8.3.4. Other End-user Industries
- 8.1. Market Analysis, Insights and Forecast - by Process
- 9. Europe APAC Blister Packaging Industry Analysis, Insights and Forecast, 2020-2032
- 9.1. Market Analysis, Insights and Forecast - by Process
- 9.1.1. Thermoforming
- 9.1.2. Coldforming
- 9.2. Market Analysis, Insights and Forecast - by Material
- 9.2.1. Plastic Films
- 9.2.2. Paper & Paperboard
- 9.2.3. Aluminum
- 9.2.4. Other Materials
- 9.3. Market Analysis, Insights and Forecast - by End-User Industry
- 9.3.1. Consumer Goods
- 9.3.2. Pharmaceutical
- 9.3.3. Industrial
- 9.3.4. Other End-user Industries
- 9.1. Market Analysis, Insights and Forecast - by Process
- 10. Middle East & Africa APAC Blister Packaging Industry Analysis, Insights and Forecast, 2020-2032
- 10.1. Market Analysis, Insights and Forecast - by Process
- 10.1.1. Thermoforming
- 10.1.2. Coldforming
- 10.2. Market Analysis, Insights and Forecast - by Material
- 10.2.1. Plastic Films
- 10.2.2. Paper & Paperboard
- 10.2.3. Aluminum
- 10.2.4. Other Materials
- 10.3. Market Analysis, Insights and Forecast - by End-User Industry
- 10.3.1. Consumer Goods
- 10.3.2. Pharmaceutical
- 10.3.3. Industrial
- 10.3.4. Other End-user Industries
- 10.1. Market Analysis, Insights and Forecast - by Process
- 11. Asia Pacific APAC Blister Packaging Industry Analysis, Insights and Forecast, 2020-2032
- 11.1. Market Analysis, Insights and Forecast - by Process
- 11.1.1. Thermoforming
- 11.1.2. Coldforming
- 11.2. Market Analysis, Insights and Forecast - by Material
- 11.2.1. Plastic Films
- 11.2.2. Paper & Paperboard
- 11.2.3. Aluminum
- 11.2.4. Other Materials
- 11.3. Market Analysis, Insights and Forecast - by End-User Industry
- 11.3.1. Consumer Goods
- 11.3.2. Pharmaceutical
- 11.3.3. Industrial
- 11.3.4. Other End-user Industries
- 11.1. Market Analysis, Insights and Forecast - by Process
- 12. Competitive Analysis
- 12.1. Company Profiles
- 12.1.1 Getpac India
- 12.1.1.1. Company Overview
- 12.1.1.2. Products
- 12.1.1.3. Company Financials
- 12.1.1.4. SWOT Analysis
- 12.1.2 Tekni-Plex Inc *List Not Exhaustive
- 12.1.2.1. Company Overview
- 12.1.2.2. Products
- 12.1.2.3. Company Financials
- 12.1.2.4. SWOT Analysis
- 12.1.3 Klockner Pentaplast Group
- 12.1.3.1. Company Overview
- 12.1.3.2. Products
- 12.1.3.3. Company Financials
- 12.1.3.4. SWOT Analysis
- 12.1.4 Uflex Limited
- 12.1.4.1. Company Overview
- 12.1.4.2. Products
- 12.1.4.3. Company Financials
- 12.1.4.4. SWOT Analysis
- 12.1.5 Competent Packaging Industries
- 12.1.5.1. Company Overview
- 12.1.5.2. Products
- 12.1.5.3. Company Financials
- 12.1.5.4. SWOT Analysis
- 12.1.6 Amcor Flexible India Pvt Ltd
- 12.1.6.1. Company Overview
- 12.1.6.2. Products
- 12.1.6.3. Company Financials
- 12.1.6.4. SWOT Analysis
- 12.1.7 Constantia Flexibles
- 12.1.7.1. Company Overview
- 12.1.7.2. Products
- 12.1.7.3. Company Financials
- 12.1.7.4. SWOT Analysis
- 12.1.1 Getpac India
- 12.2. Market Entropy
- 12.2.1 Company's Key Areas Served
- 12.2.2 Recent Developments
- 12.3. Company Market Share Analysis 2025
- 12.3.1 Top 5 Companies Market Share Analysis
- 12.3.2 Top 3 Companies Market Share Analysis
- 12.4. List of Potential Customers
- 13. Research Methodology
List of Figures
- Figure 1: Global APAC Blister Packaging Industry Revenue Breakdown (billion, %) by Region 2025 & 2033
- Figure 2: North America APAC Blister Packaging Industry Revenue (billion), by Process 2025 & 2033
- Figure 3: North America APAC Blister Packaging Industry Revenue Share (%), by Process 2025 & 2033
- Figure 4: North America APAC Blister Packaging Industry Revenue (billion), by Material 2025 & 2033
- Figure 5: North America APAC Blister Packaging Industry Revenue Share (%), by Material 2025 & 2033
- Figure 6: North America APAC Blister Packaging Industry Revenue (billion), by End-User Industry 2025 & 2033
- Figure 7: North America APAC Blister Packaging Industry Revenue Share (%), by End-User Industry 2025 & 2033
- Figure 8: North America APAC Blister Packaging Industry Revenue (billion), by Country 2025 & 2033
- Figure 9: North America APAC Blister Packaging Industry Revenue Share (%), by Country 2025 & 2033
- Figure 10: South America APAC Blister Packaging Industry Revenue (billion), by Process 2025 & 2033
- Figure 11: South America APAC Blister Packaging Industry Revenue Share (%), by Process 2025 & 2033
- Figure 12: South America APAC Blister Packaging Industry Revenue (billion), by Material 2025 & 2033
- Figure 13: South America APAC Blister Packaging Industry Revenue Share (%), by Material 2025 & 2033
- Figure 14: South America APAC Blister Packaging Industry Revenue (billion), by End-User Industry 2025 & 2033
- Figure 15: South America APAC Blister Packaging Industry Revenue Share (%), by End-User Industry 2025 & 2033
- Figure 16: South America APAC Blister Packaging Industry Revenue (billion), by Country 2025 & 2033
- Figure 17: South America APAC Blister Packaging Industry Revenue Share (%), by Country 2025 & 2033
- Figure 18: Europe APAC Blister Packaging Industry Revenue (billion), by Process 2025 & 2033
- Figure 19: Europe APAC Blister Packaging Industry Revenue Share (%), by Process 2025 & 2033
- Figure 20: Europe APAC Blister Packaging Industry Revenue (billion), by Material 2025 & 2033
- Figure 21: Europe APAC Blister Packaging Industry Revenue Share (%), by Material 2025 & 2033
- Figure 22: Europe APAC Blister Packaging Industry Revenue (billion), by End-User Industry 2025 & 2033
- Figure 23: Europe APAC Blister Packaging Industry Revenue Share (%), by End-User Industry 2025 & 2033
- Figure 24: Europe APAC Blister Packaging Industry Revenue (billion), by Country 2025 & 2033
- Figure 25: Europe APAC Blister Packaging Industry Revenue Share (%), by Country 2025 & 2033
- Figure 26: Middle East & Africa APAC Blister Packaging Industry Revenue (billion), by Process 2025 & 2033
- Figure 27: Middle East & Africa APAC Blister Packaging Industry Revenue Share (%), by Process 2025 & 2033
- Figure 28: Middle East & Africa APAC Blister Packaging Industry Revenue (billion), by Material 2025 & 2033
- Figure 29: Middle East & Africa APAC Blister Packaging Industry Revenue Share (%), by Material 2025 & 2033
- Figure 30: Middle East & Africa APAC Blister Packaging Industry Revenue (billion), by End-User Industry 2025 & 2033
- Figure 31: Middle East & Africa APAC Blister Packaging Industry Revenue Share (%), by End-User Industry 2025 & 2033
- Figure 32: Middle East & Africa APAC Blister Packaging Industry Revenue (billion), by Country 2025 & 2033
- Figure 33: Middle East & Africa APAC Blister Packaging Industry Revenue Share (%), by Country 2025 & 2033
- Figure 34: Asia Pacific APAC Blister Packaging Industry Revenue (billion), by Process 2025 & 2033
- Figure 35: Asia Pacific APAC Blister Packaging Industry Revenue Share (%), by Process 2025 & 2033
- Figure 36: Asia Pacific APAC Blister Packaging Industry Revenue (billion), by Material 2025 & 2033
- Figure 37: Asia Pacific APAC Blister Packaging Industry Revenue Share (%), by Material 2025 & 2033
- Figure 38: Asia Pacific APAC Blister Packaging Industry Revenue (billion), by End-User Industry 2025 & 2033
- Figure 39: Asia Pacific APAC Blister Packaging Industry Revenue Share (%), by End-User Industry 2025 & 2033
- Figure 40: Asia Pacific APAC Blister Packaging Industry Revenue (billion), by Country 2025 & 2033
- Figure 41: Asia Pacific APAC Blister Packaging Industry Revenue Share (%), by Country 2025 & 2033
List of Tables
- Table 1: Global APAC Blister Packaging Industry Revenue billion Forecast, by Process 2020 & 2033
- Table 2: Global APAC Blister Packaging Industry Revenue billion Forecast, by Material 2020 & 2033
- Table 3: Global APAC Blister Packaging Industry Revenue billion Forecast, by End-User Industry 2020 & 2033
- Table 4: Global APAC Blister Packaging Industry Revenue billion Forecast, by Region 2020 & 2033
- Table 5: Global APAC Blister Packaging Industry Revenue billion Forecast, by Process 2020 & 2033
- Table 6: Global APAC Blister Packaging Industry Revenue billion Forecast, by Material 2020 & 2033
- Table 7: Global APAC Blister Packaging Industry Revenue billion Forecast, by End-User Industry 2020 & 2033
- Table 8: Global APAC Blister Packaging Industry Revenue billion Forecast, by Country 2020 & 2033
- Table 9: United States APAC Blister Packaging Industry Revenue (billion) Forecast, by Application 2020 & 2033
- Table 10: Canada APAC Blister Packaging Industry Revenue (billion) Forecast, by Application 2020 & 2033
- Table 11: Mexico APAC Blister Packaging Industry Revenue (billion) Forecast, by Application 2020 & 2033
- Table 12: Global APAC Blister Packaging Industry Revenue billion Forecast, by Process 2020 & 2033
- Table 13: Global APAC Blister Packaging Industry Revenue billion Forecast, by Material 2020 & 2033
- Table 14: Global APAC Blister Packaging Industry Revenue billion Forecast, by End-User Industry 2020 & 2033
- Table 15: Global APAC Blister Packaging Industry Revenue billion Forecast, by Country 2020 & 2033
- Table 16: Brazil APAC Blister Packaging Industry Revenue (billion) Forecast, by Application 2020 & 2033
- Table 17: Argentina APAC Blister Packaging Industry Revenue (billion) Forecast, by Application 2020 & 2033
- Table 18: Rest of South America APAC Blister Packaging Industry Revenue (billion) Forecast, by Application 2020 & 2033
- Table 19: Global APAC Blister Packaging Industry Revenue billion Forecast, by Process 2020 & 2033
- Table 20: Global APAC Blister Packaging Industry Revenue billion Forecast, by Material 2020 & 2033
- Table 21: Global APAC Blister Packaging Industry Revenue billion Forecast, by End-User Industry 2020 & 2033
- Table 22: Global APAC Blister Packaging Industry Revenue billion Forecast, by Country 2020 & 2033
- Table 23: United Kingdom APAC Blister Packaging Industry Revenue (billion) Forecast, by Application 2020 & 2033
- Table 24: Germany APAC Blister Packaging Industry Revenue (billion) Forecast, by Application 2020 & 2033
- Table 25: France APAC Blister Packaging Industry Revenue (billion) Forecast, by Application 2020 & 2033
- Table 26: Italy APAC Blister Packaging Industry Revenue (billion) Forecast, by Application 2020 & 2033
- Table 27: Spain APAC Blister Packaging Industry Revenue (billion) Forecast, by Application 2020 & 2033
- Table 28: Russia APAC Blister Packaging Industry Revenue (billion) Forecast, by Application 2020 & 2033
- Table 29: Benelux APAC Blister Packaging Industry Revenue (billion) Forecast, by Application 2020 & 2033
- Table 30: Nordics APAC Blister Packaging Industry Revenue (billion) Forecast, by Application 2020 & 2033
- Table 31: Rest of Europe APAC Blister Packaging Industry Revenue (billion) Forecast, by Application 2020 & 2033
- Table 32: Global APAC Blister Packaging Industry Revenue billion Forecast, by Process 2020 & 2033
- Table 33: Global APAC Blister Packaging Industry Revenue billion Forecast, by Material 2020 & 2033
- Table 34: Global APAC Blister Packaging Industry Revenue billion Forecast, by End-User Industry 2020 & 2033
- Table 35: Global APAC Blister Packaging Industry Revenue billion Forecast, by Country 2020 & 2033
- Table 36: Turkey APAC Blister Packaging Industry Revenue (billion) Forecast, by Application 2020 & 2033
- Table 37: Israel APAC Blister Packaging Industry Revenue (billion) Forecast, by Application 2020 & 2033
- Table 38: GCC APAC Blister Packaging Industry Revenue (billion) Forecast, by Application 2020 & 2033
- Table 39: North Africa APAC Blister Packaging Industry Revenue (billion) Forecast, by Application 2020 & 2033
- Table 40: South Africa APAC Blister Packaging Industry Revenue (billion) Forecast, by Application 2020 & 2033
- Table 41: Rest of Middle East & Africa APAC Blister Packaging Industry Revenue (billion) Forecast, by Application 2020 & 2033
- Table 42: Global APAC Blister Packaging Industry Revenue billion Forecast, by Process 2020 & 2033
- Table 43: Global APAC Blister Packaging Industry Revenue billion Forecast, by Material 2020 & 2033
- Table 44: Global APAC Blister Packaging Industry Revenue billion Forecast, by End-User Industry 2020 & 2033
- Table 45: Global APAC Blister Packaging Industry Revenue billion Forecast, by Country 2020 & 2033
- Table 46: China APAC Blister Packaging Industry Revenue (billion) Forecast, by Application 2020 & 2033
- Table 47: India APAC Blister Packaging Industry Revenue (billion) Forecast, by Application 2020 & 2033
- Table 48: Japan APAC Blister Packaging Industry Revenue (billion) Forecast, by Application 2020 & 2033
- Table 49: South Korea APAC Blister Packaging Industry Revenue (billion) Forecast, by Application 2020 & 2033
- Table 50: ASEAN APAC Blister Packaging Industry Revenue (billion) Forecast, by Application 2020 & 2033
- Table 51: Oceania APAC Blister Packaging Industry Revenue (billion) Forecast, by Application 2020 & 2033
- Table 52: Rest of Asia Pacific APAC Blister Packaging Industry Revenue (billion) Forecast, by Application 2020 & 2033
Frequently Asked Questions
1. What is the projected Compound Annual Growth Rate (CAGR) of the APAC Blister Packaging Industry?
The projected CAGR is approximately 5.2%.
2. Which companies are prominent players in the APAC Blister Packaging Industry?
Key companies in the market include Getpac India, Tekni-Plex Inc *List Not Exhaustive, Klockner Pentaplast Group, Uflex Limited, Competent Packaging Industries, Amcor Flexible India Pvt Ltd, Constantia Flexibles.
3. What are the main segments of the APAC Blister Packaging Industry?
The market segments include Process, Material, End-User Industry.
4. Can you provide details about the market size?
The market size is estimated to be USD 23.57 billion as of 2022.
5. What are some drivers contributing to market growth?
; Rising Geriatric Population and Prevalence of Diseases; Tamper-evident Design for Product Protection.
6. What are the notable trends driving market growth?
Pharmaceutical and Healthcare Sector to Account for a Major Share.
7. Are there any restraints impacting market growth?
Competition from In-house packaging.
8. Can you provide examples of recent developments in the market?
N/A
9. What pricing options are available for accessing the report?
Pricing options include single-user, multi-user, and enterprise licenses priced at USD 4750, USD 4950, and USD 6800 respectively.
10. Is the market size provided in terms of value or volume?
The market size is provided in terms of value, measured in billion.
11. Are there any specific market keywords associated with the report?
Yes, the market keyword associated with the report is "APAC Blister Packaging Industry," which aids in identifying and referencing the specific market segment covered.
12. How do I determine which pricing option suits my needs best?
The pricing options vary based on user requirements and access needs. Individual users may opt for single-user licenses, while businesses requiring broader access may choose multi-user or enterprise licenses for cost-effective access to the report.
13. Are there any additional resources or data provided in the APAC Blister Packaging Industry report?
While the report offers comprehensive insights, it's advisable to review the specific contents or supplementary materials provided to ascertain if additional resources or data are available.
14. How can I stay updated on further developments or reports in the APAC Blister Packaging Industry?
To stay informed about further developments, trends, and reports in the APAC Blister Packaging Industry, consider subscribing to industry newsletters, following relevant companies and organizations, or regularly checking reputable industry news sources and publications.
Methodology
Step 1 - Identification of Relevant Samples Size from Population Database


Step 2 - Approaches for Defining Global Market Size (Value, Volume* & Price*)

Note*: In applicable scenarios
Step 3 - Data Sources
Primary Research
- Web Analytics
- Survey Reports
- Research Institute
- Latest Research Reports
- Opinion Leaders
Secondary Research
- Annual Reports
- White Paper
- Latest Press Release
- Industry Association
- Paid Database
- Investor Presentations

Step 4 - Data Triangulation
Involves using different sources of information in order to increase the validity of a study
These sources are likely to be stakeholders in a program - participants, other researchers, program staff, other community members, and so on.
Then we put all data in single framework & apply various statistical tools to find out the dynamic on the market.
During the analysis stage, feedback from the stakeholder groups would be compared to determine areas of agreement as well as areas of divergence