

Key Insights
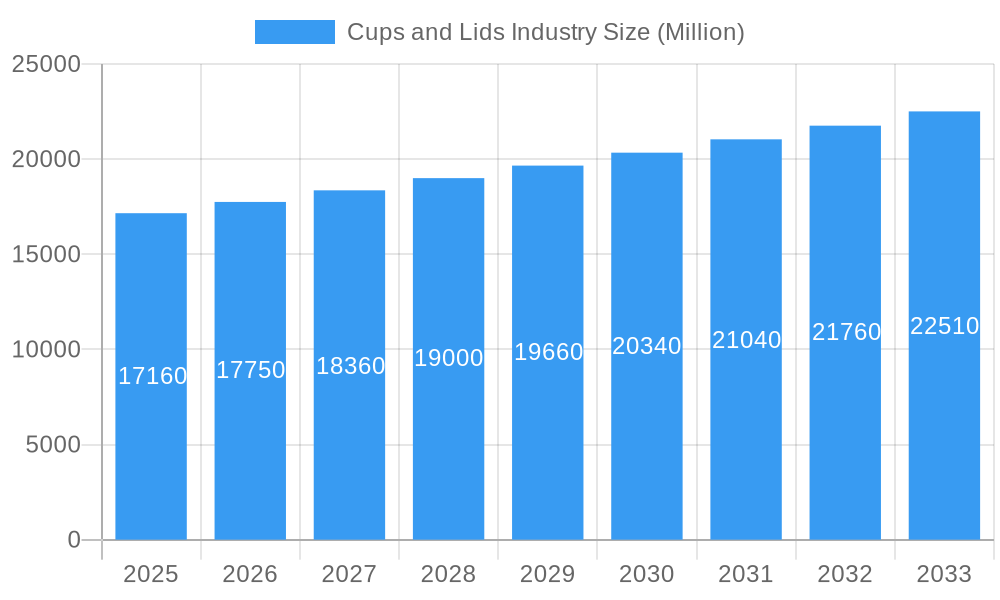
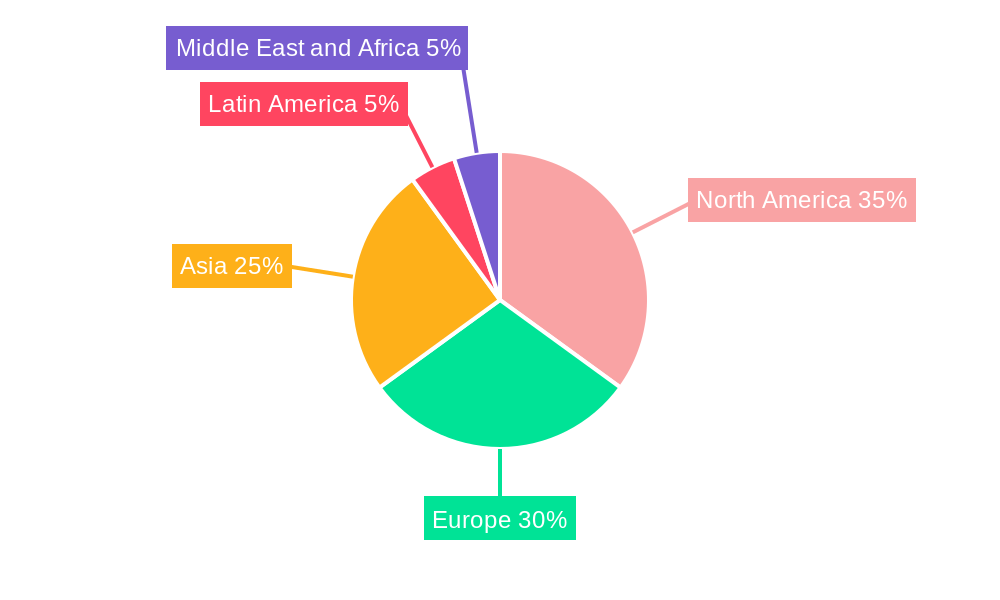
The global cups and lids market, valued at $17.16 billion in 2025, is projected to experience steady growth, driven by the expanding food and beverage industry, increasing consumer demand for convenient packaging, and the rising popularity of takeaway and delivery services. The market's 3.40% CAGR from 2025 to 2033 indicates a consistent upward trajectory, influenced by several key factors. Growth in the foodservice sector, particularly quick-service restaurants (QSRs) and cafes, significantly fuels demand for disposable cups and lids. Furthermore, the increasing emphasis on sustainability is leading to a rise in eco-friendly options like biodegradable and compostable cups and lids made from plant-based materials. While plastic remains dominant due to its cost-effectiveness, the market is witnessing a notable shift towards sustainable alternatives, driven by consumer preference and environmental regulations. Segmentation analysis reveals that drinking cups constitute a major share, followed by packaging cups and lids. Regional analysis shows North America and Europe currently hold significant market share, attributed to established foodservice industries and high per capita consumption. However, Asia-Pacific is expected to witness substantial growth in the forecast period due to rapid urbanization and increasing disposable incomes. Challenges include fluctuating raw material prices and concerns about plastic waste, compelling manufacturers to invest in innovative and sustainable solutions.
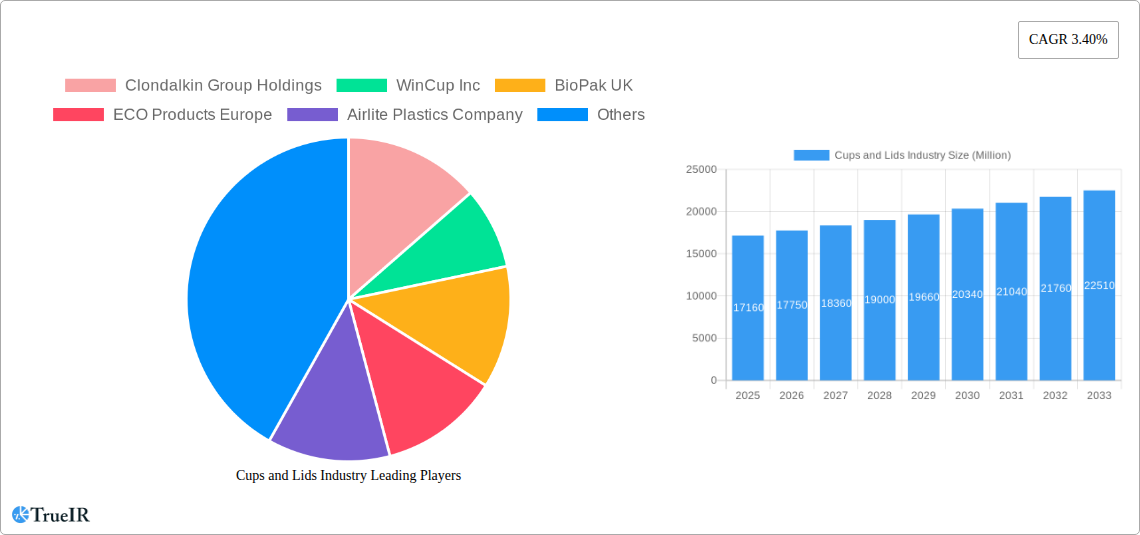
Cups and Lids Industry Market Size (In Billion)
The competitive landscape is characterized by a mix of large multinational corporations and smaller regional players. Key players are focusing on product diversification, strategic partnerships, and acquisitions to enhance their market presence and expand their product portfolios. Technological advancements, such as improved manufacturing processes and the development of advanced materials, are also shaping the market's future. The ongoing trend towards personalized and customized cups and lids offers further opportunities for growth, as businesses seek to differentiate their offerings and cater to specific consumer needs. The market is poised for continued expansion, albeit at a moderate pace, driven by the aforementioned factors and the resilience of the food and beverage sector. Ongoing research into sustainable packaging materials and efficient manufacturing processes will play a significant role in determining the long-term success of market players.
Cups and Lids Industry Company Market Share
This comprehensive report provides a detailed analysis of the global Cups and Lids industry, offering invaluable insights for businesses, investors, and stakeholders. With a focus on market trends, competitive dynamics, and future growth prospects, this report covers the period from 2019 to 2033, with a base year of 2025 and a forecast period from 2025 to 2033. The report's data is meticulously gathered and analyzed to offer a clear, concise, and actionable understanding of this dynamic market. The total market size is predicted to reach xx Million by 2033.
Cups and Lids Industry Market Structure & Competitive Landscape
The Cups and Lids industry is characterized by a dynamic and evolving market structure. While moderately consolidated, it features a robust ecosystem of both large, established multinational corporations and agile, specialized manufacturers. In 2025, market concentration is estimated at [Insert Specific Percentage Here], underscoring the significant influence of key players. Innovation remains a paramount driver, with a relentless focus on developing sustainable materials, optimizing production processes, and creating value-added features. Regulatory mandates, particularly concerning environmental stewardship, circular economy principles, and recyclability, are actively shaping corporate strategies and investment decisions. Furthermore, the industry faces competitive pressures from viable product substitutes, including the growing adoption of reusable cup programs and the emergence of alternative, eco-conscious packaging solutions, necessitating continuous adaptation and forward-thinking approaches.
The industry's segmentation spans across diverse material types (including plastics, paper, foam, and emerging bioplastics), product categories (such as hot and cold beverage cups, packaging cups for various applications, and a wide array of lid designs), and end-user verticals (predominantly food and beverage, foodservice operations, and retail environments). Mergers and acquisitions (M&A) activity has demonstrated a steady, albeit moderate, pace over recent periods, with an estimated M&A volume of [Insert Specific M&A Volume Here] Million during the historical period. This trend reflects a strategic pursuit of market consolidation, vertical integration, and expansion into novel geographic and product segments.
- Key Market Players: Clondalkin Group Holdings, WinCup Inc, BioPak UK, ECO Products Europe, Airlite Plastics Company, Brendos Ltd, Dart Container, Paper Cup Company, Solo Cup Operating Corporation, Mondi Group, Georgia-Pacific LLC, Greiner Holding AG, Greiner AG, Graphic Packaging International LLC, Berry Global, Printpack Inc, Reynolds Consumer Products, Huhtamaki Oyj, Michael Procos SA. [Note: This list represents prominent entities and may not be exhaustive.]
- Competitive Dynamics: The competitive arena is characterized by intense rivalry, with success being determined by a synergistic blend of competitive pricing, unwavering product quality, demonstrable sustainability credentials, and a consistent pipeline of innovative solutions.
- Regulatory Impact: The escalating global emphasis on sustainable packaging, extended producer responsibility, and enhanced recyclability is a pivotal force, driving significant shifts in material selection, product design, and manufacturing methodologies across the industry.
- Innovation Drivers: Key catalysts for innovation include the research and development of advanced bio-based and biodegradable materials, the refinement of cutting-edge manufacturing technologies for greater efficiency and precision, and the creation of intuitively designed products that elevate both functionality and environmental performance.
Cups and Lids Industry Market Trends & Opportunities
The global Cups and Lids market is experiencing substantial growth, driven by several key factors. The market size is projected to witness a Compound Annual Growth Rate (CAGR) of xx% during the forecast period (2025-2033), expanding from xx Million in 2025 to xx Million by 2033. This growth is fueled by a rise in disposable income, increasing consumer demand, rapid urbanization, and expansion of the food and beverage industry. Technological advancements in materials science and manufacturing are also significantly contributing to market expansion. Consumer preferences are shifting towards sustainable and eco-friendly options, which presents significant opportunities for businesses offering biodegradable and recyclable products.
The market penetration rate for eco-friendly cups and lids is increasing rapidly, with an estimated xx% in 2025. Competitive dynamics are characterized by increased focus on sustainability, innovation, and brand differentiation. The industry is witnessing increased adoption of automated manufacturing technologies leading to enhanced efficiency and decreased production costs.
Dominant Markets & Segments in Cups and Lids Industry
The North American region currently dominates the Cups and Lids market, driven by high consumer spending, robust food service industry, and strong retail sector. Within this region, the United States stands as the largest market.
- By Material: Plastic continues to hold the largest market share due to its cost-effectiveness and versatility, but the paper segment is experiencing significant growth, driven by increased demand for sustainable alternatives. The foam segment is relatively smaller and is facing declining demand due to environmental concerns.
- By Product: Drinking cups remain the dominant product segment, followed by packaging cups. The lids segment is experiencing steady growth in parallel with the growth of other cup segments.
- By End-User Vertical: The food and beverage industry, particularly the fast-food and coffee shop segments, is the largest end-user of cups and lids. The food service industry is a significant consumer, while retail and other end-user verticals contribute to overall market demand.
Key Growth Drivers:
- Strong economic growth in emerging markets.
- Increasing disposable incomes and changing consumer lifestyles.
- Expansion of the food and beverage and foodservice industries.
- Growing demand for convenient and disposable packaging.
- Favorable government regulations supporting sustainable packaging.
Cups and Lids Industry Product Analysis
Contemporary product development within the Cups and Lids industry is significantly driven by a commitment to sustainability, enhanced recyclability, and superior functionality. Manufacturers are actively pioneering the use of innovative materials, including fully biodegradable and compostable alternatives such as Polylactic Acid (PLA) and bagasse. Concurrent technological advancements in precision injection molding, thermoforming, and other sophisticated manufacturing processes are yielding substantial improvements in product consistency, cost efficiencies, and overall production throughput. The primary determinants of competitive advantage in this sector are now firmly rooted in offering demonstrably sustainable solutions, achieving optimal cost-effectiveness, achieving strong product differentiation through unique features or designs, and ensuring superior end-of-life recyclability.
Key Drivers, Barriers & Challenges in Cups and Lids Industry
Key Drivers:
- Increasing demand from the food and beverage and food service industries.
- Growing consumer preference for convenience and on-the-go consumption.
- Technological advancements in materials science and manufacturing.
- Government regulations promoting sustainable packaging.
Challenges & Restraints:
- Fluctuations in raw material prices, particularly for petroleum-based plastics, can impact production costs.
- Stringent environmental regulations and increasing focus on sustainability are forcing manufacturers to adopt eco-friendly alternatives and incur higher costs.
- Intense competition from existing players and new entrants limits profitability.
- Supply chain disruptions and logistical challenges can affect production and distribution.
Growth Drivers in the Cups and Lids Industry Market
The Cups and Lids industry is driven by increased consumer demand for convenient packaging, growth in the foodservice sector, and technological innovations leading to more sustainable and efficient production processes. Government regulations promoting environmentally friendly packaging also contribute to market expansion. The rising disposable income in developing countries further fuels the market demand.
Challenges Impacting Cups and Lids Industry Growth
The industry faces a confluence of significant challenges that impact its growth trajectory. These include the inherent volatility in raw material pricing, which can affect profitability and pricing strategies. A potent and growing pressure exists to transition towards more eco-friendly and circular packaging solutions, often requiring substantial capital investment and R&D efforts. Stringent and evolving environmental regulations, both domestically and internationally, necessitate continuous adaptation and compliance. Furthermore, disruptions within global supply chains can lead to material shortages and increased lead times. Intense competition from established market incumbents, coupled with the disruptive potential of agile new entrants, further complicates the operating landscape.
Key Players Shaping the Cups and Lids Industry Market
- Clondalkin Group Holdings
- WinCup Inc
- BioPak UK
- ECO Products Europe
- Airlite Plastics Company
- Brendos Ltd
- Dart Container
- Paper Cup Company
- Solo Cup Operating Corporation
- Mondi Group
- Georgia-Pacific LLC
- Greiner Holding AG
- Greiner AG
- Graphic Packaging International LLC
- Berry Global
- Printpack Inc
- Reynolds Consumer Products
- Huhtamaki Oyj
- Michael Procos SA
Significant Cups and Lids Industry Milestones
- April 2023: Greiner Packaging, Engel, and Brink jointly developed a thin-walled rPET cup using injection molding, reducing CO2e emissions. This signifies a significant step towards more sustainable packaging.
- April 2022: PulPac and HSMG collaborated on water and oil barriers for PulPac Dry Molded Fiber technology, enhancing the recyclability of molded fiber packaging for coffee cups and lids. This development addresses a major challenge in the industry by improving the recyclability of fiber-based cups and lids.
Future Outlook for Cups and Lids Industry Market
The Cups and Lids market is projected to experience sustained and robust growth in the coming years. This expansion will be propelled by the ever-increasing demand from the burgeoning food service and retail sectors, particularly in developing economies with expanding middle classes and a growing appetite for convenience. Concurrently, ongoing and accelerated innovations in sustainable materials, advanced manufacturing processes, and smart packaging solutions will unlock new market opportunities. Strategic avenues for growth lie in the development and aggressive marketing of cutting-edge, eco-friendly products that not only meet increasingly stringent environmental regulations but also resonate deeply with evolving consumer preferences for responsible consumption. The market presents substantial potential for companies that can effectively navigate these trends and offer compelling, sustainable solutions.
Cups and Lids Industry Segmentation
-
1. Material
- 1.1. Plastic
- 1.2. Paper
- 1.3. Foam
- 1.4. Other Materials
-
2. Product
- 2.1. Drinking Cups
- 2.2. Packagin
- 2.3. Lids
-
3. End-User Vertical
- 3.1. Food and Beverage
- 3.2. Foodservices
- 3.3. Retail and Other End User Verticals
Cups and Lids Industry Segmentation By Geography
-
1. North America
- 1.1. United States
- 1.2. Canada
-
2. Europe
- 2.1. United kingdom
- 2.2. France
- 2.3. Germany
-
3. Asia
- 3.1. China
- 3.2. Japan
- 3.3. India
- 3.4. Australia and New Zealand
-
4. Latin America
- 4.1. Brazil
- 4.2. Mexico
-
5. Middle East and Africa
- 5.1. United Arab Emirates
- 5.2. South Africa
- 5.3. Saudi Arabia
Cups and Lids Industry Regional Market Share
Geographic Coverage of Cups and Lids Industry
Cups and Lids Industry REPORT HIGHLIGHTS
| Aspects | Details |
|---|---|
| Study Period | 2020-2034 |
| Base Year | 2025 |
| Estimated Year | 2026 |
| Forecast Period | 2026-2034 |
| Historical Period | 2020-2025 |
| Growth Rate | CAGR of 3.40% from 2020-2034 |
| Segmentation |
|
Table of Contents
- 1. Introduction
- 1.1. Research Scope
- 1.2. Market Segmentation
- 1.3. Research Objective
- 1.4. Definitions and Assumptions
- 2. Executive Summary
- 2.1. Market Snapshot
- 3. Market Dynamics
- 3.1. Market Drivers
- 3.2. Market Restrains
- 3.3. Market Trends
- 3.4. Market Opportunities
- 4. Market Factor Analysis
- 4.1. Porters Five Forces
- 4.1.1. Bargaining Power of Suppliers
- 4.1.2. Bargaining Power of Buyers
- 4.1.3. Threat of New Entrants
- 4.1.4. Threat of Substitutes
- 4.1.5. Competitive Rivalry
- 4.2. PESTEL analysis
- 4.3. BCG Analysis
- 4.3.1. Stars (High Growth, High Market Share)
- 4.3.2. Cash Cows (Low Growth, High Market Share)
- 4.3.3. Question Mark (High Growth, Low Market Share)
- 4.3.4. Dogs (Low Growth, Low Market Share)
- 4.4. Ansoff Matrix Analysis
- 4.5. Supply Chain Analysis
- 4.6. Regulatory Landscape
- 4.7. Current Market Potential and Opportunity Assessment (TAM–SAM–SOM Framework)
- 4.8. TIR Analyst Note
- 4.1. Porters Five Forces
- 5. Market Analysis, Insights and Forecast 2021-2033
- 5.1. Market Analysis, Insights and Forecast - by Material
- 5.1.1. Plastic
- 5.1.2. Paper
- 5.1.3. Foam
- 5.1.4. Other Materials
- 5.2. Market Analysis, Insights and Forecast - by Product
- 5.2.1. Drinking Cups
- 5.2.2. Packagin
- 5.2.3. Lids
- 5.3. Market Analysis, Insights and Forecast - by End-User Vertical
- 5.3.1. Food and Beverage
- 5.3.2. Foodservices
- 5.3.3. Retail and Other End User Verticals
- 5.4. Market Analysis, Insights and Forecast - by Region
- 5.4.1. North America
- 5.4.2. Europe
- 5.4.3. Asia
- 5.4.4. Latin America
- 5.4.5. Middle East and Africa
- 5.1. Market Analysis, Insights and Forecast - by Material
- 6. Global Cups and Lids Industry Analysis, Insights and Forecast, 2021-2033
- 6.1. Market Analysis, Insights and Forecast - by Material
- 6.1.1. Plastic
- 6.1.2. Paper
- 6.1.3. Foam
- 6.1.4. Other Materials
- 6.2. Market Analysis, Insights and Forecast - by Product
- 6.2.1. Drinking Cups
- 6.2.2. Packagin
- 6.2.3. Lids
- 6.3. Market Analysis, Insights and Forecast - by End-User Vertical
- 6.3.1. Food and Beverage
- 6.3.2. Foodservices
- 6.3.3. Retail and Other End User Verticals
- 6.1. Market Analysis, Insights and Forecast - by Material
- 7. North America Cups and Lids Industry Analysis, Insights and Forecast, 2020-2032
- 7.1. Market Analysis, Insights and Forecast - by Material
- 7.1.1. Plastic
- 7.1.2. Paper
- 7.1.3. Foam
- 7.1.4. Other Materials
- 7.2. Market Analysis, Insights and Forecast - by Product
- 7.2.1. Drinking Cups
- 7.2.2. Packagin
- 7.2.3. Lids
- 7.3. Market Analysis, Insights and Forecast - by End-User Vertical
- 7.3.1. Food and Beverage
- 7.3.2. Foodservices
- 7.3.3. Retail and Other End User Verticals
- 7.1. Market Analysis, Insights and Forecast - by Material
- 8. Europe Cups and Lids Industry Analysis, Insights and Forecast, 2020-2032
- 8.1. Market Analysis, Insights and Forecast - by Material
- 8.1.1. Plastic
- 8.1.2. Paper
- 8.1.3. Foam
- 8.1.4. Other Materials
- 8.2. Market Analysis, Insights and Forecast - by Product
- 8.2.1. Drinking Cups
- 8.2.2. Packagin
- 8.2.3. Lids
- 8.3. Market Analysis, Insights and Forecast - by End-User Vertical
- 8.3.1. Food and Beverage
- 8.3.2. Foodservices
- 8.3.3. Retail and Other End User Verticals
- 8.1. Market Analysis, Insights and Forecast - by Material
- 9. Asia Cups and Lids Industry Analysis, Insights and Forecast, 2020-2032
- 9.1. Market Analysis, Insights and Forecast - by Material
- 9.1.1. Plastic
- 9.1.2. Paper
- 9.1.3. Foam
- 9.1.4. Other Materials
- 9.2. Market Analysis, Insights and Forecast - by Product
- 9.2.1. Drinking Cups
- 9.2.2. Packagin
- 9.2.3. Lids
- 9.3. Market Analysis, Insights and Forecast - by End-User Vertical
- 9.3.1. Food and Beverage
- 9.3.2. Foodservices
- 9.3.3. Retail and Other End User Verticals
- 9.1. Market Analysis, Insights and Forecast - by Material
- 10. Latin America Cups and Lids Industry Analysis, Insights and Forecast, 2020-2032
- 10.1. Market Analysis, Insights and Forecast - by Material
- 10.1.1. Plastic
- 10.1.2. Paper
- 10.1.3. Foam
- 10.1.4. Other Materials
- 10.2. Market Analysis, Insights and Forecast - by Product
- 10.2.1. Drinking Cups
- 10.2.2. Packagin
- 10.2.3. Lids
- 10.3. Market Analysis, Insights and Forecast - by End-User Vertical
- 10.3.1. Food and Beverage
- 10.3.2. Foodservices
- 10.3.3. Retail and Other End User Verticals
- 10.1. Market Analysis, Insights and Forecast - by Material
- 11. Middle East and Africa Cups and Lids Industry Analysis, Insights and Forecast, 2020-2032
- 11.1. Market Analysis, Insights and Forecast - by Material
- 11.1.1. Plastic
- 11.1.2. Paper
- 11.1.3. Foam
- 11.1.4. Other Materials
- 11.2. Market Analysis, Insights and Forecast - by Product
- 11.2.1. Drinking Cups
- 11.2.2. Packagin
- 11.2.3. Lids
- 11.3. Market Analysis, Insights and Forecast - by End-User Vertical
- 11.3.1. Food and Beverage
- 11.3.2. Foodservices
- 11.3.3. Retail and Other End User Verticals
- 11.1. Market Analysis, Insights and Forecast - by Material
- 12. Competitive Analysis
- 12.1. Company Profiles
- 12.1.1 Clondalkin Group Holdings
- 12.1.1.1. Company Overview
- 12.1.1.2. Products
- 12.1.1.3. Company Financials
- 12.1.1.4. SWOT Analysis
- 12.1.2 WinCup Inc
- 12.1.2.1. Company Overview
- 12.1.2.2. Products
- 12.1.2.3. Company Financials
- 12.1.2.4. SWOT Analysis
- 12.1.3 BioPak UK
- 12.1.3.1. Company Overview
- 12.1.3.2. Products
- 12.1.3.3. Company Financials
- 12.1.3.4. SWOT Analysis
- 12.1.4 ECO Products Europe
- 12.1.4.1. Company Overview
- 12.1.4.2. Products
- 12.1.4.3. Company Financials
- 12.1.4.4. SWOT Analysis
- 12.1.5 Airlite Plastics Company
- 12.1.5.1. Company Overview
- 12.1.5.2. Products
- 12.1.5.3. Company Financials
- 12.1.5.4. SWOT Analysis
- 12.1.6 Brendos Ltd
- 12.1.6.1. Company Overview
- 12.1.6.2. Products
- 12.1.6.3. Company Financials
- 12.1.6.4. SWOT Analysis
- 12.1.7 Dart Containe
- 12.1.7.1. Company Overview
- 12.1.7.2. Products
- 12.1.7.3. Company Financials
- 12.1.7.4. SWOT Analysis
- 12.1.8 Paper Cup Company
- 12.1.8.1. Company Overview
- 12.1.8.2. Products
- 12.1.8.3. Company Financials
- 12.1.8.4. SWOT Analysis
- 12.1.9 Solo Cup Operating Corporation
- 12.1.9.1. Company Overview
- 12.1.9.2. Products
- 12.1.9.3. Company Financials
- 12.1.9.4. SWOT Analysis
- 12.1.10 Mondi Group
- 12.1.10.1. Company Overview
- 12.1.10.2. Products
- 12.1.10.3. Company Financials
- 12.1.10.4. SWOT Analysis
- 12.1.11 Georgia-Pacific LLC
- 12.1.11.1. Company Overview
- 12.1.11.2. Products
- 12.1.11.3. Company Financials
- 12.1.11.4. SWOT Analysis
- 12.1.12 Greiner Holding AG
- 12.1.12.1. Company Overview
- 12.1.12.2. Products
- 12.1.12.3. Company Financials
- 12.1.12.4. SWOT Analysis
- 12.1.13 Greiner AG
- 12.1.13.1. Company Overview
- 12.1.13.2. Products
- 12.1.13.3. Company Financials
- 12.1.13.4. SWOT Analysis
- 12.1.14 Graphic Packaging International LLC
- 12.1.14.1. Company Overview
- 12.1.14.2. Products
- 12.1.14.3. Company Financials
- 12.1.14.4. SWOT Analysis
- 12.1.15 Berry Global
- 12.1.15.1. Company Overview
- 12.1.15.2. Products
- 12.1.15.3. Company Financials
- 12.1.15.4. SWOT Analysis
- 12.1.16 Printpack Inc
- 12.1.16.1. Company Overview
- 12.1.16.2. Products
- 12.1.16.3. Company Financials
- 12.1.16.4. SWOT Analysis
- 12.1.17 Reynolds Consumer Products
- 12.1.17.1. Company Overview
- 12.1.17.2. Products
- 12.1.17.3. Company Financials
- 12.1.17.4. SWOT Analysis
- 12.1.18 Huhtamaki Oyj
- 12.1.18.1. Company Overview
- 12.1.18.2. Products
- 12.1.18.3. Company Financials
- 12.1.18.4. SWOT Analysis
- 12.1.19 Michael Procos SA
- 12.1.19.1. Company Overview
- 12.1.19.2. Products
- 12.1.19.3. Company Financials
- 12.1.19.4. SWOT Analysis
- 12.1.1 Clondalkin Group Holdings
- 12.2. Market Entropy
- 12.2.1 Company's Key Areas Served
- 12.2.2 Recent Developments
- 12.3. Company Market Share Analysis 2025
- 12.3.1 Top 5 Companies Market Share Analysis
- 12.3.2 Top 3 Companies Market Share Analysis
- 12.4. List of Potential Customers
- 13. Research Methodology
List of Figures
- Figure 1: Global Cups and Lids Industry Revenue Breakdown (Million, %) by Region 2025 & 2033
- Figure 2: North America Cups and Lids Industry Revenue (Million), by Material 2025 & 2033
- Figure 3: North America Cups and Lids Industry Revenue Share (%), by Material 2025 & 2033
- Figure 4: North America Cups and Lids Industry Revenue (Million), by Product 2025 & 2033
- Figure 5: North America Cups and Lids Industry Revenue Share (%), by Product 2025 & 2033
- Figure 6: North America Cups and Lids Industry Revenue (Million), by End-User Vertical 2025 & 2033
- Figure 7: North America Cups and Lids Industry Revenue Share (%), by End-User Vertical 2025 & 2033
- Figure 8: North America Cups and Lids Industry Revenue (Million), by Country 2025 & 2033
- Figure 9: North America Cups and Lids Industry Revenue Share (%), by Country 2025 & 2033
- Figure 10: Europe Cups and Lids Industry Revenue (Million), by Material 2025 & 2033
- Figure 11: Europe Cups and Lids Industry Revenue Share (%), by Material 2025 & 2033
- Figure 12: Europe Cups and Lids Industry Revenue (Million), by Product 2025 & 2033
- Figure 13: Europe Cups and Lids Industry Revenue Share (%), by Product 2025 & 2033
- Figure 14: Europe Cups and Lids Industry Revenue (Million), by End-User Vertical 2025 & 2033
- Figure 15: Europe Cups and Lids Industry Revenue Share (%), by End-User Vertical 2025 & 2033
- Figure 16: Europe Cups and Lids Industry Revenue (Million), by Country 2025 & 2033
- Figure 17: Europe Cups and Lids Industry Revenue Share (%), by Country 2025 & 2033
- Figure 18: Asia Cups and Lids Industry Revenue (Million), by Material 2025 & 2033
- Figure 19: Asia Cups and Lids Industry Revenue Share (%), by Material 2025 & 2033
- Figure 20: Asia Cups and Lids Industry Revenue (Million), by Product 2025 & 2033
- Figure 21: Asia Cups and Lids Industry Revenue Share (%), by Product 2025 & 2033
- Figure 22: Asia Cups and Lids Industry Revenue (Million), by End-User Vertical 2025 & 2033
- Figure 23: Asia Cups and Lids Industry Revenue Share (%), by End-User Vertical 2025 & 2033
- Figure 24: Asia Cups and Lids Industry Revenue (Million), by Country 2025 & 2033
- Figure 25: Asia Cups and Lids Industry Revenue Share (%), by Country 2025 & 2033
- Figure 26: Latin America Cups and Lids Industry Revenue (Million), by Material 2025 & 2033
- Figure 27: Latin America Cups and Lids Industry Revenue Share (%), by Material 2025 & 2033
- Figure 28: Latin America Cups and Lids Industry Revenue (Million), by Product 2025 & 2033
- Figure 29: Latin America Cups and Lids Industry Revenue Share (%), by Product 2025 & 2033
- Figure 30: Latin America Cups and Lids Industry Revenue (Million), by End-User Vertical 2025 & 2033
- Figure 31: Latin America Cups and Lids Industry Revenue Share (%), by End-User Vertical 2025 & 2033
- Figure 32: Latin America Cups and Lids Industry Revenue (Million), by Country 2025 & 2033
- Figure 33: Latin America Cups and Lids Industry Revenue Share (%), by Country 2025 & 2033
- Figure 34: Middle East and Africa Cups and Lids Industry Revenue (Million), by Material 2025 & 2033
- Figure 35: Middle East and Africa Cups and Lids Industry Revenue Share (%), by Material 2025 & 2033
- Figure 36: Middle East and Africa Cups and Lids Industry Revenue (Million), by Product 2025 & 2033
- Figure 37: Middle East and Africa Cups and Lids Industry Revenue Share (%), by Product 2025 & 2033
- Figure 38: Middle East and Africa Cups and Lids Industry Revenue (Million), by End-User Vertical 2025 & 2033
- Figure 39: Middle East and Africa Cups and Lids Industry Revenue Share (%), by End-User Vertical 2025 & 2033
- Figure 40: Middle East and Africa Cups and Lids Industry Revenue (Million), by Country 2025 & 2033
- Figure 41: Middle East and Africa Cups and Lids Industry Revenue Share (%), by Country 2025 & 2033
List of Tables
- Table 1: Global Cups and Lids Industry Revenue Million Forecast, by Material 2020 & 2033
- Table 2: Global Cups and Lids Industry Revenue Million Forecast, by Product 2020 & 2033
- Table 3: Global Cups and Lids Industry Revenue Million Forecast, by End-User Vertical 2020 & 2033
- Table 4: Global Cups and Lids Industry Revenue Million Forecast, by Region 2020 & 2033
- Table 5: Global Cups and Lids Industry Revenue Million Forecast, by Material 2020 & 2033
- Table 6: Global Cups and Lids Industry Revenue Million Forecast, by Product 2020 & 2033
- Table 7: Global Cups and Lids Industry Revenue Million Forecast, by End-User Vertical 2020 & 2033
- Table 8: Global Cups and Lids Industry Revenue Million Forecast, by Country 2020 & 2033
- Table 9: United States Cups and Lids Industry Revenue (Million) Forecast, by Application 2020 & 2033
- Table 10: Canada Cups and Lids Industry Revenue (Million) Forecast, by Application 2020 & 2033
- Table 11: Global Cups and Lids Industry Revenue Million Forecast, by Material 2020 & 2033
- Table 12: Global Cups and Lids Industry Revenue Million Forecast, by Product 2020 & 2033
- Table 13: Global Cups and Lids Industry Revenue Million Forecast, by End-User Vertical 2020 & 2033
- Table 14: Global Cups and Lids Industry Revenue Million Forecast, by Country 2020 & 2033
- Table 15: United kingdom Cups and Lids Industry Revenue (Million) Forecast, by Application 2020 & 2033
- Table 16: France Cups and Lids Industry Revenue (Million) Forecast, by Application 2020 & 2033
- Table 17: Germany Cups and Lids Industry Revenue (Million) Forecast, by Application 2020 & 2033
- Table 18: Global Cups and Lids Industry Revenue Million Forecast, by Material 2020 & 2033
- Table 19: Global Cups and Lids Industry Revenue Million Forecast, by Product 2020 & 2033
- Table 20: Global Cups and Lids Industry Revenue Million Forecast, by End-User Vertical 2020 & 2033
- Table 21: Global Cups and Lids Industry Revenue Million Forecast, by Country 2020 & 2033
- Table 22: China Cups and Lids Industry Revenue (Million) Forecast, by Application 2020 & 2033
- Table 23: Japan Cups and Lids Industry Revenue (Million) Forecast, by Application 2020 & 2033
- Table 24: India Cups and Lids Industry Revenue (Million) Forecast, by Application 2020 & 2033
- Table 25: Australia and New Zealand Cups and Lids Industry Revenue (Million) Forecast, by Application 2020 & 2033
- Table 26: Global Cups and Lids Industry Revenue Million Forecast, by Material 2020 & 2033
- Table 27: Global Cups and Lids Industry Revenue Million Forecast, by Product 2020 & 2033
- Table 28: Global Cups and Lids Industry Revenue Million Forecast, by End-User Vertical 2020 & 2033
- Table 29: Global Cups and Lids Industry Revenue Million Forecast, by Country 2020 & 2033
- Table 30: Brazil Cups and Lids Industry Revenue (Million) Forecast, by Application 2020 & 2033
- Table 31: Mexico Cups and Lids Industry Revenue (Million) Forecast, by Application 2020 & 2033
- Table 32: Global Cups and Lids Industry Revenue Million Forecast, by Material 2020 & 2033
- Table 33: Global Cups and Lids Industry Revenue Million Forecast, by Product 2020 & 2033
- Table 34: Global Cups and Lids Industry Revenue Million Forecast, by End-User Vertical 2020 & 2033
- Table 35: Global Cups and Lids Industry Revenue Million Forecast, by Country 2020 & 2033
- Table 36: United Arab Emirates Cups and Lids Industry Revenue (Million) Forecast, by Application 2020 & 2033
- Table 37: South Africa Cups and Lids Industry Revenue (Million) Forecast, by Application 2020 & 2033
- Table 38: Saudi Arabia Cups and Lids Industry Revenue (Million) Forecast, by Application 2020 & 2033
Frequently Asked Questions
1. What is the projected Compound Annual Growth Rate (CAGR) of the Cups and Lids Industry?
The projected CAGR is approximately 3.40%.
2. Which companies are prominent players in the Cups and Lids Industry?
Key companies in the market include Clondalkin Group Holdings, WinCup Inc, BioPak UK, ECO Products Europe, Airlite Plastics Company, Brendos Ltd, Dart Containe, Paper Cup Company, Solo Cup Operating Corporation, Mondi Group, Georgia-Pacific LLC, Greiner Holding AG, Greiner AG, Graphic Packaging International LLC, Berry Global, Printpack Inc, Reynolds Consumer Products, Huhtamaki Oyj, Michael Procos SA.
3. What are the main segments of the Cups and Lids Industry?
The market segments include Material, Product, End-User Vertical.
4. Can you provide details about the market size?
The market size is estimated to be USD 17.16 Million as of 2022.
5. What are some drivers contributing to market growth?
Food and Beverage Segment to Witness Significant Growth; Growing Number of QSR Aids to Market Growth.
6. What are the notable trends driving market growth?
Food and Beverage Segment to Witness Significant Growth.
7. Are there any restraints impacting market growth?
Various Regulations Pertaining to Plastic Usage.
8. Can you provide examples of recent developments in the market?
April 2023 - Greiner Packaging, Engel, and Brink have jointly developed a thin-walled cup of rPET that can be produced using injection molding technology and claims to reduce CO2 equivalent CO2e emissions.
9. What pricing options are available for accessing the report?
Pricing options include single-user, multi-user, and enterprise licenses priced at USD 4750, USD 5250, and USD 8750 respectively.
10. Is the market size provided in terms of value or volume?
The market size is provided in terms of value, measured in Million.
11. Are there any specific market keywords associated with the report?
Yes, the market keyword associated with the report is "Cups and Lids Industry," which aids in identifying and referencing the specific market segment covered.
12. How do I determine which pricing option suits my needs best?
The pricing options vary based on user requirements and access needs. Individual users may opt for single-user licenses, while businesses requiring broader access may choose multi-user or enterprise licenses for cost-effective access to the report.
13. Are there any additional resources or data provided in the Cups and Lids Industry report?
While the report offers comprehensive insights, it's advisable to review the specific contents or supplementary materials provided to ascertain if additional resources or data are available.
14. How can I stay updated on further developments or reports in the Cups and Lids Industry?
To stay informed about further developments, trends, and reports in the Cups and Lids Industry, consider subscribing to industry newsletters, following relevant companies and organizations, or regularly checking reputable industry news sources and publications.
Methodology
Step 1 - Identification of Relevant Samples Size from Population Database


Step 2 - Approaches for Defining Global Market Size (Value, Volume* & Price*)

Note*: In applicable scenarios
Step 3 - Data Sources
Primary Research
- Web Analytics
- Survey Reports
- Research Institute
- Latest Research Reports
- Opinion Leaders
Secondary Research
- Annual Reports
- White Paper
- Latest Press Release
- Industry Association
- Paid Database
- Investor Presentations

Step 4 - Data Triangulation
Involves using different sources of information in order to increase the validity of a study
These sources are likely to be stakeholders in a program - participants, other researchers, program staff, other community members, and so on.
Then we put all data in single framework & apply various statistical tools to find out the dynamic on the market.
During the analysis stage, feedback from the stakeholder groups would be compared to determine areas of agreement as well as areas of divergence