

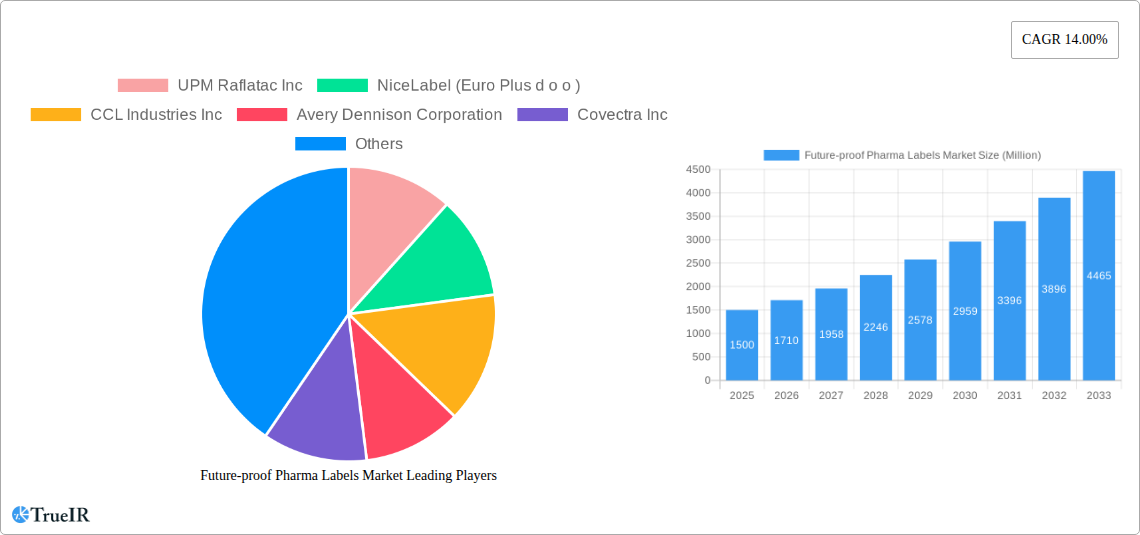
Key Insights
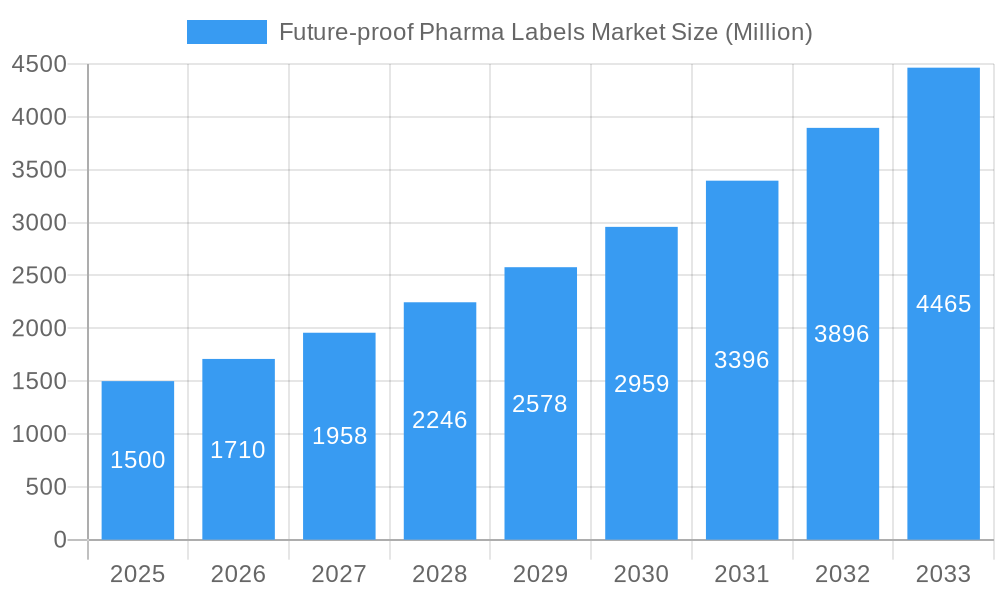
The future-proof pharma labels market is experiencing robust growth, driven by increasing demand for enhanced security features, stringent regulatory compliance, and the need for improved supply chain traceability within the pharmaceutical industry. The market's Compound Annual Growth Rate (CAGR) of 14% from 2019 to 2024 suggests a significant expansion, projected to continue through 2033. This growth is fueled by several key factors. The adoption of advanced technologies like RFID (Radio-Frequency Identification), NFC (Near Field Communication), and sensing labels offers superior product authentication, anti-counterfeiting measures, and real-time monitoring capabilities. This is crucial for pharmaceutical companies to protect their brand reputation, ensure patient safety, and comply with increasingly stringent regulations regarding drug traceability and supply chain integrity. Furthermore, the rising prevalence of counterfeit drugs globally is a major driver, pushing pharmaceutical companies to adopt innovative labeling solutions to combat this issue. Geographical segmentation shows strong growth across North America and Europe, driven by high regulatory standards and technological advancements. However, the Asia-Pacific region also presents significant growth potential given its expanding pharmaceutical market and rising adoption of advanced technologies. While the market faces restraints such as high initial investment costs associated with new technologies, the long-term benefits in terms of reduced counterfeiting, improved brand protection, and enhanced patient safety are expected to outweigh these challenges, ensuring sustained market expansion. Key players such as UPM Raflatac, CCL Industries, and Avery Dennison are actively investing in R&D and strategic partnerships to capitalize on this growing market opportunity.
Future-proof Pharma Labels Market Market Size (In Billion)
The market segmentation by technology highlights the prominence of RFID and NFC labels as they offer superior tracking and authentication capabilities compared to traditional methods. However, the "Other Technologies" segment is also showing strong growth potential as innovations in smart labels and connected packaging continue to emerge. The competitive landscape is characterized by both large multinational corporations and specialized label manufacturers, leading to intense competition focused on technological innovation, cost-effectiveness, and customization options. The overall market is anticipated to witness consolidation and strategic mergers and acquisitions as companies strive to gain market share and expand their product portfolios in this rapidly evolving sector. The forecast period from 2025 to 2033 is likely to be characterized by further technology advancements, increased regulatory scrutiny, and heightened demand for enhanced security features within the pharmaceutical supply chain.
Future-proof Pharma Labels Market Company Market Share
Future-Proof Pharma Labels Market: A Comprehensive Report (2019-2033)
This dynamic report provides a detailed analysis of the Future-proof Pharma Labels Market, offering invaluable insights for stakeholders across the pharmaceutical and labeling industries. Leveraging extensive market research and data analysis spanning the period 2019-2033 (historical period: 2019-2024, base year: 2025, forecast period: 2025-2033, estimated year: 2025), this report unveils key trends, growth drivers, and challenges shaping this rapidly evolving market. The report's projections indicate a market valued at xx Million in 2025, with a substantial Compound Annual Growth Rate (CAGR) of xx% expected through 2033. This comprehensive study is essential for businesses seeking to navigate the complexities of this dynamic market and capitalize on emerging opportunities.
Future-proof Pharma Labels Market Market Structure & Competitive Landscape
The Future-proof Pharma Labels Market is characterized by a moderately concentrated structure in 2025, with the leading five players collectively holding an estimated xx% of the market share. This concentration highlights the importance of established players with advanced technological capabilities and broad market reach. Innovation stands as a pivotal growth engine, with companies actively investing in and developing cutting-edge solutions. The integration of technologies such as Radio-Frequency Identification (RFID) and Near Field Communication (NFC) labels is paramount for bolstering security, enhancing traceability, and ensuring supply chain integrity. Stringent global regulatory frameworks, particularly those focused on drug safety, authentication, and the prevention of counterfeiting, exert a profound influence on market dynamics and product development. While direct product substitution for specialized pharmaceutical labels is inherently limited due to specific performance and compliance requirements, the market continuously sees the emergence of cost-effective alternatives and integrated solutions that offer competitive value propositions. The market is predominantly segmented by end-user industries, including pharmaceutical manufacturers, wholesale distributors, and healthcare providers (hospitals and pharmacies), as well as by the underlying technology employed, such as RFID, NFC, sensing labels, and other advanced labeling solutions. Geographically, market presence and growth vary significantly across regions based on regulatory environments and adoption rates of advanced technologies. Merger and acquisition (M&A) activity has been a notable feature in recent years, with approximately xx major transactions recorded between 2019 and 2024. This trend suggests a strategic inclination among companies to consolidate their market positions, expand their technological portfolios, and achieve greater economies of scale, indicating a potential for further consolidation in the foreseeable future.
- Market Concentration: Top 5 players command an estimated xx% market share as of 2025.
- Key Innovation Drivers: Advancements in RFID, NFC, and sensing label technologies are propelling market growth and product development.
- Regulatory Influence: Strict regulations pertaining to drug safety, track-and-trace, and anti-counterfeiting are shaping market strategies and product offerings.
- Product Substitution Landscape: Limited direct substitution exists for specialized pharma labels, though innovative and cost-effective integrated solutions are continuously emerging.
- Primary End-User Segments: Pharmaceutical manufacturers, distributors, and hospitals represent the core end-user base.
- M&A Activity: Approximately xx significant mergers and acquisitions were completed between 2019 and 2024, indicating strategic consolidation.
Future-proof Pharma Labels Market Market Trends & Opportunities
The Future-proof Pharma Labels Market is currently experiencing a phase of robust and sustained growth, driven by an escalating demand for sophisticated and secure labeling solutions within the global pharmaceutical industry. Projections indicate that the market size is poised to reach an impressive xx Million by 2033, demonstrating a significant Compound Annual Growth Rate (CAGR) of xx%. This upward trajectory is underpinned by a confluence of powerful market forces. The increasing adoption of advanced technologies such as RFID and NFC is instrumental in enhancing product traceability throughout the supply chain, thereby bolstering security and combating diversion. Furthermore, growing consumer awareness and demand for tamper-evident packaging are pushing pharmaceutical companies to implement more advanced security features. The persistent and alarming global prevalence of counterfeit drugs necessitates the deployment of more robust and verifiable labeling solutions, further fueling market expansion. Market penetration rates for intelligent labeling technologies are steadily rising, particularly within developed economies, where pharmaceutical companies are prioritizing supply chain integrity and patient safety. However, the competitive landscape remains dynamic and intense, with established players and agile new entrants consistently vying for market share. This necessitates a continuous commitment to innovation, strategic alliances, and the development of integrated solutions to maintain a competitive edge. The broader trend towards the digitalization of pharmaceutical supply chains is also a significant contributor to the heightened demand for intelligent and data-rich labels.
Dominant Markets & Segments in Future-proof Pharma Labels Market
North America currently holds the largest market share in the Future-proof Pharma Labels Market, driven by stringent regulations and the high adoption rate of advanced technologies. Within the technology segments, RFID technology is leading the market due to its superior capabilities in tracking and authentication, followed by NFC and sensing labels.
- Key Growth Drivers in North America:
- Stringent regulatory environment emphasizing product traceability and security.
- High adoption rate of advanced labeling technologies.
- Robust pharmaceutical industry with significant investments in supply chain optimization.
- RFID Technology Dominance: Superior tracking, authentication and security features.
- Europe and Asia-Pacific showing significant growth potential due to rising demand for pharmaceutical products and increasing government initiatives supporting advanced labeling technologies.
Future-proof Pharma Labels Market Product Analysis
The Future-proof Pharma Labels Market is characterized by a constant stream of product innovations, focusing on enhanced security features, improved traceability, and integration with digital supply chain systems. These innovations include tamper-evident labels, RFID-enabled labels for real-time tracking, and sensing labels for monitoring temperature and humidity during storage and transportation. The competitive advantage lies in offering highly secure, reliable, and cost-effective solutions that meet the specific needs of pharmaceutical companies, while complying with regulatory requirements. These solutions often integrate seamlessly with existing supply chain management systems.
Key Drivers, Barriers & Challenges in Future-proof Pharma Labels Market
Key Drivers: The primary impetus for growth in the Future-proof Pharma Labels Market stems from the escalating imperative for enhanced product security to effectively combat the pervasive issue of drug counterfeiting. Complementing this is the increasing stringency of regulatory compliance requirements worldwide, which mandate robust drug traceability systems from manufacturing to patient. The burgeoning adoption of advanced technologies, notably RFID and NFC, is a critical driver, offering unprecedented levels of supply chain visibility and authentication. Furthermore, the ongoing integration of digital technologies across the pharmaceutical supply chain is significantly augmenting the demand for intelligent labels capable of capturing and transmitting vital data.
Challenges & Restraints: A significant barrier to market growth is the substantial initial investment required for the implementation of advanced labeling technologies, which can be particularly challenging for smaller and medium-sized pharmaceutical enterprises. Supply chain complexities, encompassing the procurement of specialized materials, components, and the integration of disparate systems, can lead to operational bottlenecks. Moreover, the intricate and often fragmented regulatory landscape, which varies considerably across different geographical regions, presents considerable compliance hurdles for global manufacturers. The intensely competitive market environment necessitates continuous innovation, which in turn can exert pressure on profit margins. Collectively, these factors can impact the pace of market growth and influence strategic decision-making within the industry.
Growth Drivers in the Future-proof Pharma Labels Market Market
Technological advancements, stringent regulations promoting product traceability, and the rising prevalence of pharmaceutical counterfeiting are key growth drivers. The increasing adoption of digital technologies in supply chain management further fuels market expansion. Government initiatives supporting the adoption of advanced labeling technologies also contribute to market growth.
Challenges Impacting Future-proof Pharma Labels Market Growth
High initial investment costs, complex regulatory landscapes, and supply chain disruptions present major challenges. Intense competition necessitates continuous innovation, impacting profit margins. The need for specialized materials and expertise in implementing advanced labeling technologies also pose significant hurdles.
Key Players Shaping the Future-proof Pharma Labels Market Market
Significant Future-proof Pharma Labels Market Industry Milestones
- January 2022: Avery Dennison introduced an innovative new line of tamper-evident labels specifically designed for pharmaceutical packaging, enhancing product security and brand protection.
- June 2023: UPM Raflatac announced a significant strategic partnership with a leading global pharmaceutical company to co-develop and implement advanced RFID labeling solutions, aiming to improve supply chain visibility and efficiency.
- October 2024: CCL Industries completed the strategic acquisition of a smaller, specialized label manufacturer, thereby expanding its market share and broadening its product and service offerings in the pharmaceutical labeling sector. (Further significant milestones will be detailed in the comprehensive final report).
Future Outlook for Future-proof Pharma Labels Market Market
The Future-proof Pharma Labels Market is poised for continued growth, driven by technological advancements, stringent regulations, and the persistent threat of pharmaceutical counterfeiting. Strategic opportunities lie in developing innovative labeling solutions that meet the evolving needs of the pharmaceutical industry, including enhanced security features, real-time tracking capabilities, and seamless integration with digital supply chain systems. The market potential is significant, with substantial growth projected over the forecast period.
Future-proof Pharma Labels Market Segmentation
-
1. Technology
- 1.1. RFID
- 1.2. NFC
- 1.3. Sensing Labels
- 1.4. Other Technologies
Future-proof Pharma Labels Market Segmentation By Geography
-
1. North America
- 1.1. United States
- 1.2. Canada
-
2. Europe
- 2.1. United Kingdom
- 2.2. Germany
- 2.3. France
- 2.4. Rest of Europe
-
3. Asia Pacific
- 3.1. China
- 3.2. India
- 3.3. Japan
- 3.4. South Korea
- 3.5. Rest of Asia Pacific
-
4. Rest of the World
- 4.1. Latin America
- 4.2. Middle East and Africa

Future-proof Pharma Labels Market Regional Market Share
Geographic Coverage of Future-proof Pharma Labels Market
Future-proof Pharma Labels Market REPORT HIGHLIGHTS
| Aspects | Details |
|---|---|
| Study Period | 2020-2034 |
| Base Year | 2025 |
| Estimated Year | 2026 |
| Forecast Period | 2026-2034 |
| Historical Period | 2020-2025 |
| Growth Rate | CAGR of 6.8% from 2020-2034 |
| Segmentation |
|
Table of Contents
- 1. Introduction
- 1.1. Research Scope
- 1.2. Market Segmentation
- 1.3. Research Objective
- 1.4. Definitions and Assumptions
- 2. Executive Summary
- 2.1. Market Snapshot
- 3. Market Dynamics
- 3.1. Market Drivers
- 3.2. Market Restrains
- 3.3. Market Trends
- 3.4. Market Opportunities
- 4. Market Factor Analysis
- 4.1. Porters Five Forces
- 4.1.1. Bargaining Power of Suppliers
- 4.1.2. Bargaining Power of Buyers
- 4.1.3. Threat of New Entrants
- 4.1.4. Threat of Substitutes
- 4.1.5. Competitive Rivalry
- 4.2. PESTEL analysis
- 4.3. BCG Analysis
- 4.3.1. Stars (High Growth, High Market Share)
- 4.3.2. Cash Cows (Low Growth, High Market Share)
- 4.3.3. Question Mark (High Growth, Low Market Share)
- 4.3.4. Dogs (Low Growth, Low Market Share)
- 4.4. Ansoff Matrix Analysis
- 4.5. Supply Chain Analysis
- 4.6. Regulatory Landscape
- 4.7. Current Market Potential and Opportunity Assessment (TAM–SAM–SOM Framework)
- 4.8. TIR Analyst Note
- 4.1. Porters Five Forces
- 5. Market Analysis, Insights and Forecast 2021-2033
- 5.1. Market Analysis, Insights and Forecast - by Technology
- 5.1.1. RFID
- 5.1.2. NFC
- 5.1.3. Sensing Labels
- 5.1.4. Other Technologies
- 5.2. Market Analysis, Insights and Forecast - by Region
- 5.2.1. North America
- 5.2.2. Europe
- 5.2.3. Asia Pacific
- 5.2.4. Rest of the World
- 5.1. Market Analysis, Insights and Forecast - by Technology
- 6. Global Future-proof Pharma Labels Market Analysis, Insights and Forecast, 2021-2033
- 6.1. Market Analysis, Insights and Forecast - by Technology
- 6.1.1. RFID
- 6.1.2. NFC
- 6.1.3. Sensing Labels
- 6.1.4. Other Technologies
- 6.1. Market Analysis, Insights and Forecast - by Technology
- 7. North America Future-proof Pharma Labels Market Analysis, Insights and Forecast, 2020-2032
- 7.1. Market Analysis, Insights and Forecast - by Technology
- 7.1.1. RFID
- 7.1.2. NFC
- 7.1.3. Sensing Labels
- 7.1.4. Other Technologies
- 7.1. Market Analysis, Insights and Forecast - by Technology
- 8. Europe Future-proof Pharma Labels Market Analysis, Insights and Forecast, 2020-2032
- 8.1. Market Analysis, Insights and Forecast - by Technology
- 8.1.1. RFID
- 8.1.2. NFC
- 8.1.3. Sensing Labels
- 8.1.4. Other Technologies
- 8.1. Market Analysis, Insights and Forecast - by Technology
- 9. Asia Pacific Future-proof Pharma Labels Market Analysis, Insights and Forecast, 2020-2032
- 9.1. Market Analysis, Insights and Forecast - by Technology
- 9.1.1. RFID
- 9.1.2. NFC
- 9.1.3. Sensing Labels
- 9.1.4. Other Technologies
- 9.1. Market Analysis, Insights and Forecast - by Technology
- 10. Rest of the World Future-proof Pharma Labels Market Analysis, Insights and Forecast, 2020-2032
- 10.1. Market Analysis, Insights and Forecast - by Technology
- 10.1.1. RFID
- 10.1.2. NFC
- 10.1.3. Sensing Labels
- 10.1.4. Other Technologies
- 10.1. Market Analysis, Insights and Forecast - by Technology
- 11. Competitive Analysis
- 11.1. Company Profiles
- 11.1.1 UPM Raflatac Inc
- 11.1.1.1. Company Overview
- 11.1.1.2. Products
- 11.1.1.3. Company Financials
- 11.1.1.4. SWOT Analysis
- 11.1.2 NiceLabel (Euro Plus d o o )
- 11.1.2.1. Company Overview
- 11.1.2.2. Products
- 11.1.2.3. Company Financials
- 11.1.2.4. SWOT Analysis
- 11.1.3 CCL Industries Inc
- 11.1.3.1. Company Overview
- 11.1.3.2. Products
- 11.1.3.3. Company Financials
- 11.1.3.4. SWOT Analysis
- 11.1.4 Avery Dennison Corporation
- 11.1.4.1. Company Overview
- 11.1.4.2. Products
- 11.1.4.3. Company Financials
- 11.1.4.4. SWOT Analysis
- 11.1.5 Covectra Inc
- 11.1.5.1. Company Overview
- 11.1.5.2. Products
- 11.1.5.3. Company Financials
- 11.1.5.4. SWOT Analysis
- 11.1.6 Loftware Inc *List Not Exhaustive
- 11.1.6.1. Company Overview
- 11.1.6.2. Products
- 11.1.6.3. Company Financials
- 11.1.6.4. SWOT Analysis
- 11.1.7 Schreiner Group
- 11.1.7.1. Company Overview
- 11.1.7.2. Products
- 11.1.7.3. Company Financials
- 11.1.7.4. SWOT Analysis
- 11.1.1 UPM Raflatac Inc
- 11.2. Market Entropy
- 11.2.1 Company's Key Areas Served
- 11.2.2 Recent Developments
- 11.3. Company Market Share Analysis 2025
- 11.3.1 Top 5 Companies Market Share Analysis
- 11.3.2 Top 3 Companies Market Share Analysis
- 11.4. List of Potential Customers
- 12. Research Methodology
List of Figures
- Figure 1: Global Future-proof Pharma Labels Market Revenue Breakdown (billion, %) by Region 2025 & 2033
- Figure 2: North America Future-proof Pharma Labels Market Revenue (billion), by Technology 2025 & 2033
- Figure 3: North America Future-proof Pharma Labels Market Revenue Share (%), by Technology 2025 & 2033
- Figure 4: North America Future-proof Pharma Labels Market Revenue (billion), by Country 2025 & 2033
- Figure 5: North America Future-proof Pharma Labels Market Revenue Share (%), by Country 2025 & 2033
- Figure 6: Europe Future-proof Pharma Labels Market Revenue (billion), by Technology 2025 & 2033
- Figure 7: Europe Future-proof Pharma Labels Market Revenue Share (%), by Technology 2025 & 2033
- Figure 8: Europe Future-proof Pharma Labels Market Revenue (billion), by Country 2025 & 2033
- Figure 9: Europe Future-proof Pharma Labels Market Revenue Share (%), by Country 2025 & 2033
- Figure 10: Asia Pacific Future-proof Pharma Labels Market Revenue (billion), by Technology 2025 & 2033
- Figure 11: Asia Pacific Future-proof Pharma Labels Market Revenue Share (%), by Technology 2025 & 2033
- Figure 12: Asia Pacific Future-proof Pharma Labels Market Revenue (billion), by Country 2025 & 2033
- Figure 13: Asia Pacific Future-proof Pharma Labels Market Revenue Share (%), by Country 2025 & 2033
- Figure 14: Rest of the World Future-proof Pharma Labels Market Revenue (billion), by Technology 2025 & 2033
- Figure 15: Rest of the World Future-proof Pharma Labels Market Revenue Share (%), by Technology 2025 & 2033
- Figure 16: Rest of the World Future-proof Pharma Labels Market Revenue (billion), by Country 2025 & 2033
- Figure 17: Rest of the World Future-proof Pharma Labels Market Revenue Share (%), by Country 2025 & 2033
List of Tables
- Table 1: Global Future-proof Pharma Labels Market Revenue billion Forecast, by Technology 2020 & 2033
- Table 2: Global Future-proof Pharma Labels Market Revenue billion Forecast, by Region 2020 & 2033
- Table 3: Global Future-proof Pharma Labels Market Revenue billion Forecast, by Technology 2020 & 2033
- Table 4: Global Future-proof Pharma Labels Market Revenue billion Forecast, by Country 2020 & 2033
- Table 5: United States Future-proof Pharma Labels Market Revenue (billion) Forecast, by Application 2020 & 2033
- Table 6: Canada Future-proof Pharma Labels Market Revenue (billion) Forecast, by Application 2020 & 2033
- Table 7: Global Future-proof Pharma Labels Market Revenue billion Forecast, by Technology 2020 & 2033
- Table 8: Global Future-proof Pharma Labels Market Revenue billion Forecast, by Country 2020 & 2033
- Table 9: United Kingdom Future-proof Pharma Labels Market Revenue (billion) Forecast, by Application 2020 & 2033
- Table 10: Germany Future-proof Pharma Labels Market Revenue (billion) Forecast, by Application 2020 & 2033
- Table 11: France Future-proof Pharma Labels Market Revenue (billion) Forecast, by Application 2020 & 2033
- Table 12: Rest of Europe Future-proof Pharma Labels Market Revenue (billion) Forecast, by Application 2020 & 2033
- Table 13: Global Future-proof Pharma Labels Market Revenue billion Forecast, by Technology 2020 & 2033
- Table 14: Global Future-proof Pharma Labels Market Revenue billion Forecast, by Country 2020 & 2033
- Table 15: China Future-proof Pharma Labels Market Revenue (billion) Forecast, by Application 2020 & 2033
- Table 16: India Future-proof Pharma Labels Market Revenue (billion) Forecast, by Application 2020 & 2033
- Table 17: Japan Future-proof Pharma Labels Market Revenue (billion) Forecast, by Application 2020 & 2033
- Table 18: South Korea Future-proof Pharma Labels Market Revenue (billion) Forecast, by Application 2020 & 2033
- Table 19: Rest of Asia Pacific Future-proof Pharma Labels Market Revenue (billion) Forecast, by Application 2020 & 2033
- Table 20: Global Future-proof Pharma Labels Market Revenue billion Forecast, by Technology 2020 & 2033
- Table 21: Global Future-proof Pharma Labels Market Revenue billion Forecast, by Country 2020 & 2033
- Table 22: Latin America Future-proof Pharma Labels Market Revenue (billion) Forecast, by Application 2020 & 2033
- Table 23: Middle East and Africa Future-proof Pharma Labels Market Revenue (billion) Forecast, by Application 2020 & 2033
Frequently Asked Questions
1. What is the projected Compound Annual Growth Rate (CAGR) of the Future-proof Pharma Labels Market?
The projected CAGR is approximately 6.8%.
2. Which companies are prominent players in the Future-proof Pharma Labels Market?
Key companies in the market include UPM Raflatac Inc, NiceLabel (Euro Plus d o o ), CCL Industries Inc, Avery Dennison Corporation, Covectra Inc, Loftware Inc *List Not Exhaustive, Schreiner Group.
3. What are the main segments of the Future-proof Pharma Labels Market?
The market segments include Technology.
4. Can you provide details about the market size?
The market size is estimated to be USD 4.2 billion as of 2022.
5. What are some drivers contributing to market growth?
; Increasing Counterfeiting Cases; Mitigation of Non-adherence.
6. What are the notable trends driving market growth?
RFID Technology is Expected to Witness Significant Growth.
7. Are there any restraints impacting market growth?
; Lack of Standards and Additional Cost.
8. Can you provide examples of recent developments in the market?
N/A
9. What pricing options are available for accessing the report?
Pricing options include single-user, multi-user, and enterprise licenses priced at USD 4750, USD 5250, and USD 8750 respectively.
10. Is the market size provided in terms of value or volume?
The market size is provided in terms of value, measured in billion.
11. Are there any specific market keywords associated with the report?
Yes, the market keyword associated with the report is "Future-proof Pharma Labels Market," which aids in identifying and referencing the specific market segment covered.
12. How do I determine which pricing option suits my needs best?
The pricing options vary based on user requirements and access needs. Individual users may opt for single-user licenses, while businesses requiring broader access may choose multi-user or enterprise licenses for cost-effective access to the report.
13. Are there any additional resources or data provided in the Future-proof Pharma Labels Market report?
While the report offers comprehensive insights, it's advisable to review the specific contents or supplementary materials provided to ascertain if additional resources or data are available.
14. How can I stay updated on further developments or reports in the Future-proof Pharma Labels Market?
To stay informed about further developments, trends, and reports in the Future-proof Pharma Labels Market, consider subscribing to industry newsletters, following relevant companies and organizations, or regularly checking reputable industry news sources and publications.
Methodology
Step 1 - Identification of Relevant Samples Size from Population Database


Step 2 - Approaches for Defining Global Market Size (Value, Volume* & Price*)

Note*: In applicable scenarios
Step 3 - Data Sources
Primary Research
- Web Analytics
- Survey Reports
- Research Institute
- Latest Research Reports
- Opinion Leaders
Secondary Research
- Annual Reports
- White Paper
- Latest Press Release
- Industry Association
- Paid Database
- Investor Presentations

Step 4 - Data Triangulation
Involves using different sources of information in order to increase the validity of a study
These sources are likely to be stakeholders in a program - participants, other researchers, program staff, other community members, and so on.
Then we put all data in single framework & apply various statistical tools to find out the dynamic on the market.
During the analysis stage, feedback from the stakeholder groups would be compared to determine areas of agreement as well as areas of divergence