

Key Insights
The Latin American soft drinks packaging market is poised for significant expansion, fueled by increasing beverage consumption, particularly in urban centers with growing disposable incomes. The market is projected to grow at a Compound Annual Growth Rate (CAGR) of 6.8% from a base year of 2024, reaching an estimated market size of 6791 million by 2033. Key growth drivers include the rising popularity of convenient single-serve formats (bottles, cans) and a growing consumer demand for healthier beverages packaged in sustainable materials. The market is segmented by material (plastic, metal, glass, paperboard), product type (bottles, cans, cartons), beverage type (water, carbonated, juices, RTD, sports drinks), and country (Brazil, Mexico, Argentina, Rest of Latin America). Brazil, Mexico, and Argentina lead national markets due to substantial populations and established beverage industries. While plastic packaging dominates due to its cost-effectiveness, increasing environmental consciousness is driving the adoption of sustainable alternatives like paperboard. Regulatory initiatives to reduce plastic waste further influence this shift, creating both opportunities and challenges for manufacturers. Intense competition is characterized by innovation in design, materials, and sustainability from major players like CAN-PACK SA, Ball Corporation, and Amcor PLC.
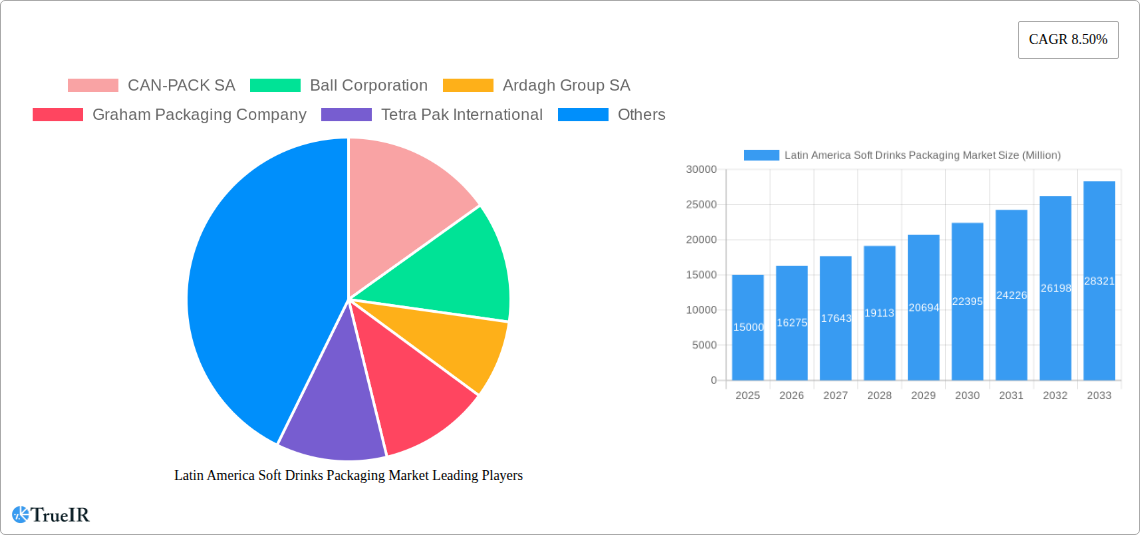
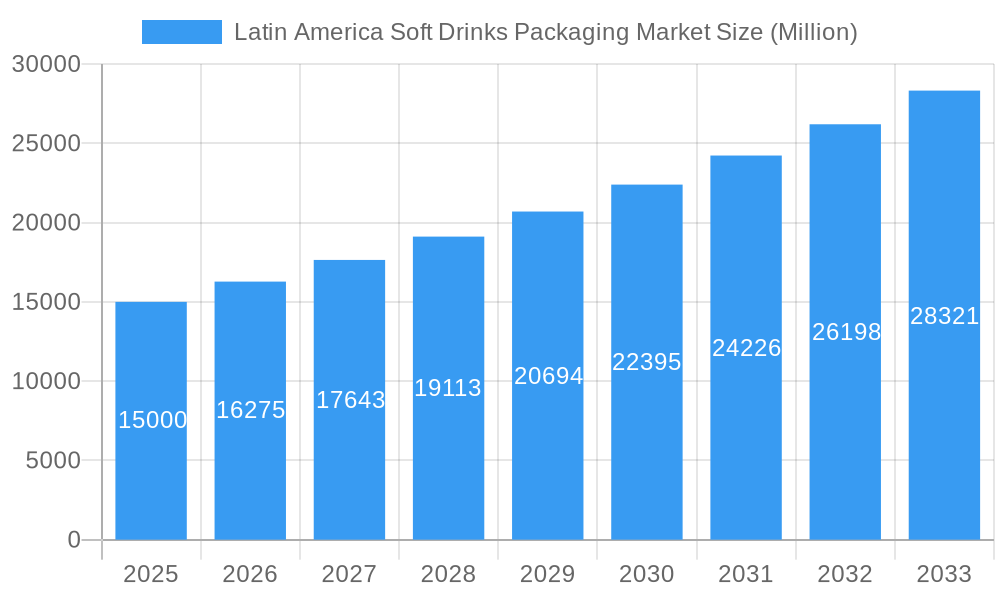
Latin America Soft Drinks Packaging Market Market Size (In Billion)
Future market dynamics will be shaped by raw material price fluctuations, evolving consumer preferences for healthier and sustainable options, and supportive government policies promoting recyclability. The growth of e-commerce and home delivery necessitates robust packaging solutions for transit. Companies will prioritize R&D to develop innovative, sustainable, and cost-effective packaging. The continued growth of the soft drinks sector, coupled with demand for convenience and sustainability, ensures sustained expansion. However, regional economic instability and potential supply chain disruptions represent potential risks.
Latin America Soft Drinks Packaging Market Company Market Share
Latin America Soft Drinks Packaging Market: A Comprehensive Report (2019-2033)
This dynamic report provides a detailed analysis of the Latin America soft drinks packaging market, offering invaluable insights for industry stakeholders. Leveraging extensive market research and data analysis from 2019-2024 (historical period), with a base year of 2025 and a forecast period extending to 2033, this report unveils the market's structure, competitive landscape, key trends, and future growth trajectory. The market is segmented by material (plastic, metal, glass, paper and paperboard), product type (bottles, cans, boxes, cartons), beverage type (bottled water, carbonated drinks, juices, RTD beverages, sports drinks), and country (Brazil, Mexico, Argentina, and Rest of Latin America). The projected market value in 2025 is estimated at xx Million, with a robust CAGR forecast for the period 2025-2033.
Latin America Soft Drinks Packaging Market Structure & Competitive Landscape
The Latin American soft drinks packaging market exhibits a moderately consolidated structure. Key players like Ball Corporation, Amcor PLC, Crown Holdings Incorporated, CAN-PACK SA, Ardagh Group SA, Graham Packaging Company, Tetra Pak International, Victory Packaging, Trivium Packaging, and Refresco Group NV compete intensely, driving innovation and influencing market dynamics. The Herfindahl-Hirschman Index (HHI) is estimated at xx, suggesting a moderately concentrated market.
- Innovation Drivers: Sustainability concerns are driving the adoption of eco-friendly materials like plant-based plastics (PEF) and recyclable alternatives. Technological advancements in packaging design and manufacturing processes are also contributing to market growth.
- Regulatory Impacts: Government regulations regarding plastic waste and sustainable packaging are impacting material choices and production methods. Compliance costs and the need for sustainable packaging solutions are shaping the market.
- Product Substitutes: While traditional packaging materials dominate, the market is witnessing the emergence of substitutes like biodegradable and compostable packaging options. These substitutes are gradually gaining traction but face challenges in terms of cost and scalability.
- End-User Segmentation: The market caters to diverse end-users, including major soft drink manufacturers, independent bottlers, and distributors. The preferences and demands of these end-users significantly influence market trends.
- M&A Trends: The market has witnessed several mergers and acquisitions in recent years, driven by companies' strategies to expand their market share, diversify their product portfolios, and enhance their technological capabilities. The total M&A volume in the past five years is estimated at xx Million.
Latin America Soft Drinks Packaging Market Trends & Opportunities
The Latin America soft drinks packaging market is experiencing significant growth, driven by factors such as rising disposable incomes, changing consumer preferences, and the increasing popularity of ready-to-drink (RTD) beverages. The market size is projected to expand at a CAGR of xx% during the forecast period (2025-2033). Technological advancements, like the use of lightweight materials and improved printing techniques, are enhancing packaging efficiency and appeal. Consumer preferences for convenient, sustainable, and aesthetically pleasing packaging are shaping the market. The increasing adoption of e-commerce and online grocery shopping further fuels the demand for robust and tamper-evident packaging. Furthermore, the growing demand for functional beverages and healthier options is expected to open new avenues for innovative packaging solutions. The market penetration rate for sustainable packaging is projected to reach xx% by 2033. Competitive dynamics are characterized by product differentiation, branding, and pricing strategies.
Dominant Markets & Segments in Latin America Soft Drinks Packaging Market
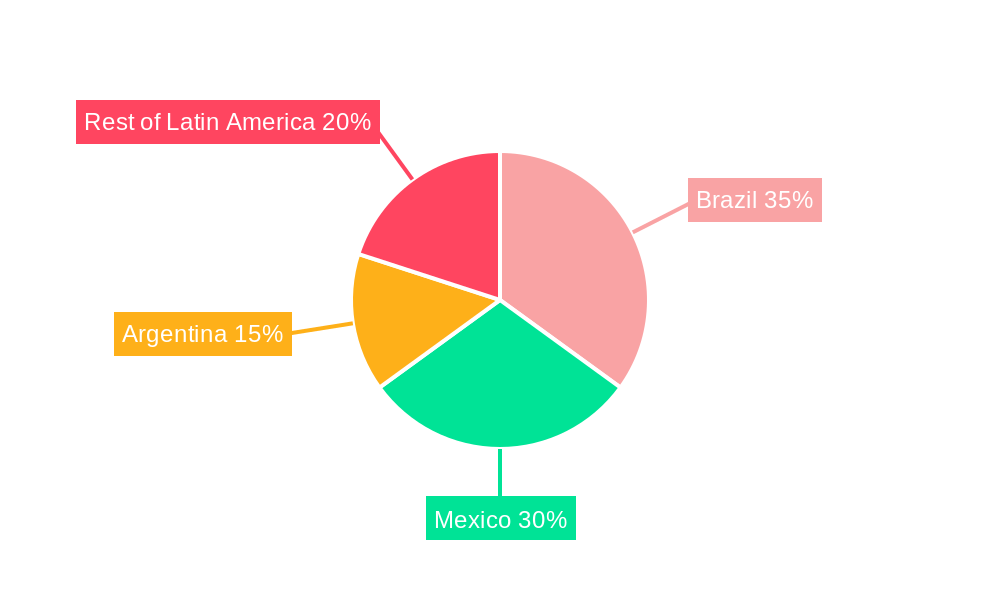
Brazil and Mexico represent the largest markets within Latin America, accounting for approximately xx% and xx% of the total market value in 2025, respectively. Argentina and the Rest of Latin America contribute significantly. The Plastic segment holds the largest market share among materials (approximately xx%), driven by cost-effectiveness and versatility. Bottles are the dominant product type, followed by cans. Carbonated drinks and bottled water constitute major beverage segments, and the demand for RTD beverages and sports drinks continues to rise.
- Key Growth Drivers for Brazil: Strong economic growth, large consumer base, and advanced infrastructure contribute to its market leadership.
- Key Growth Drivers for Mexico: Similar factors as Brazil plus the proximity to the U.S. market and significant investments in the beverage industry.
- Key Growth Drivers for Argentina: Growing middle class, increasing consumption of soft drinks.
- Key Growth Drivers for Rest of Latin America: Increasing urbanization and rising disposable incomes across several developing countries.
Latin America Soft Drinks Packaging Market Product Analysis
Product innovations focus on enhancing sustainability, convenience, and aesthetics. Lightweighting materials reduces transportation costs and environmental impact. Improved printing technologies enhance branding and shelf appeal. The adoption of innovative closures and tamper-evident features enhances product safety and security. Companies are increasingly adopting sustainable materials like PEF and recycled content to meet consumer demand for eco-friendly products. The market fit is strong for products that balance cost-effectiveness with sustainability features and innovative designs.
Key Drivers, Barriers & Challenges in Latin America Soft Drinks Packaging Market
Key Drivers:
- Growing demand for convenient and portable packaging.
- Increasing disposable incomes and rising consumption of soft drinks.
- Technological advancements in packaging materials and manufacturing processes.
- Government initiatives promoting sustainable packaging solutions.
Challenges:
- Fluctuations in raw material prices. (e.g., xx% increase in plastic resin prices in 2022 impacted production costs.)
- Stringent regulations related to packaging waste management.
- Intense competition among packaging manufacturers.
- Supply chain disruptions affecting timely delivery of packaging materials.
Growth Drivers in the Latin America Soft Drinks Packaging Market
The market is driven by increased consumption of packaged soft drinks, fuelled by rising disposable incomes and population growth. Technological innovations, such as lightweighting and sustainable material options, enhance efficiency and appeal. Stringent environmental regulations stimulate the demand for recyclable and eco-friendly packaging. Government incentives and initiatives supporting sustainable packaging further bolster growth.
Challenges Impacting Latin America Soft Drinks Packaging Market Growth
Significant challenges include fluctuating raw material costs impacting profitability. Complex regulations on waste management and sustainable packaging create compliance burdens. Intense competition among established players makes it challenging for new entrants. Supply chain disruptions occasionally create packaging shortages.
Key Players Shaping the Latin America Soft Drinks Packaging Market
- CAN-PACK SA
- Ball Corporation
- Ardagh Group SA
- Graham Packaging Company
- Tetra Pak International
- Amcor PLC
- Victory Packaging
- Crown Holdings Incorporated
- Trivium Packaging
- Refresco Group NV
Significant Latin America Soft Drinks Packaging Market Industry Milestones
- February 2022: The Coca-Cola company announced a goal to boost the use of reusable packaging by 25% globally by 2030, signaling a shift towards sustainable practices.
- August 2022: Avantium N.V.'s agreement with AmBev for supplying PEF bottles highlights the growing adoption of plant-based alternatives in the soft drinks industry.
Future Outlook for Latin America Soft Drinks Packaging Market
The Latin America soft drinks packaging market is poised for continued growth, driven by increasing consumption, technological advancements, and a focus on sustainability. Strategic opportunities exist for companies investing in innovative, eco-friendly packaging solutions. The market's future potential is substantial, particularly in countries experiencing rapid economic growth and rising disposable incomes.
Latin America Soft Drinks Packaging Market Segmentation
-
1. Material
- 1.1. Plastic
- 1.2. Metal
- 1.3. Glass
- 1.4. Paper and Paperboard
-
2. Product Type
- 2.1. Bottles
- 2.2. Cans
- 2.3. Boxes
- 2.4. Cartons
-
3. Type
- 3.1. Bottled Water
- 3.2. Carbonated Drinks
- 3.3. Juices
- 3.4. RTD Beverages
- 3.5. Sport Drinks
Latin America Soft Drinks Packaging Market Segmentation By Geography
-
1. Latin America
- 1.1. Brazil
- 1.2. Argentina
- 1.3. Chile
- 1.4. Colombia
- 1.5. Mexico
- 1.6. Peru
- 1.7. Venezuela
- 1.8. Ecuador
- 1.9. Bolivia
- 1.10. Paraguay
Latin America Soft Drinks Packaging Market Regional Market Share
Geographic Coverage of Latin America Soft Drinks Packaging Market
Latin America Soft Drinks Packaging Market REPORT HIGHLIGHTS
| Aspects | Details |
|---|---|
| Study Period | 2020-2034 |
| Base Year | 2025 |
| Estimated Year | 2026 |
| Forecast Period | 2026-2034 |
| Historical Period | 2020-2025 |
| Growth Rate | CAGR of 6.8% from 2020-2034 |
| Segmentation |
|
Table of Contents
- 1. Introduction
- 1.1. Research Scope
- 1.2. Market Segmentation
- 1.3. Research Objective
- 1.4. Definitions and Assumptions
- 2. Executive Summary
- 2.1. Market Snapshot
- 3. Market Dynamics
- 3.1. Market Drivers
- 3.2. Market Restrains
- 3.3. Market Trends
- 3.4. Market Opportunities
- 4. Market Factor Analysis
- 4.1. Porters Five Forces
- 4.1.1. Bargaining Power of Suppliers
- 4.1.2. Bargaining Power of Buyers
- 4.1.3. Threat of New Entrants
- 4.1.4. Threat of Substitutes
- 4.1.5. Competitive Rivalry
- 4.2. PESTEL analysis
- 4.3. BCG Analysis
- 4.3.1. Stars (High Growth, High Market Share)
- 4.3.2. Cash Cows (Low Growth, High Market Share)
- 4.3.3. Question Mark (High Growth, Low Market Share)
- 4.3.4. Dogs (Low Growth, Low Market Share)
- 4.4. Ansoff Matrix Analysis
- 4.5. Supply Chain Analysis
- 4.6. Regulatory Landscape
- 4.7. Current Market Potential and Opportunity Assessment (TAM–SAM–SOM Framework)
- 4.8. TIR Analyst Note
- 4.1. Porters Five Forces
- 5. Market Analysis, Insights and Forecast 2021-2033
- 5.1. Market Analysis, Insights and Forecast - by Material
- 5.1.1. Plastic
- 5.1.2. Metal
- 5.1.3. Glass
- 5.1.4. Paper and Paperboard
- 5.2. Market Analysis, Insights and Forecast - by Product Type
- 5.2.1. Bottles
- 5.2.2. Cans
- 5.2.3. Boxes
- 5.2.4. Cartons
- 5.3. Market Analysis, Insights and Forecast - by Type
- 5.3.1. Bottled Water
- 5.3.2. Carbonated Drinks
- 5.3.3. Juices
- 5.3.4. RTD Beverages
- 5.3.5. Sport Drinks
- 5.4. Market Analysis, Insights and Forecast - by Region
- 5.4.1. Latin America
- 5.1. Market Analysis, Insights and Forecast - by Material
- 6. Latin America Soft Drinks Packaging Market Analysis, Insights and Forecast, 2021-2033
- 6.1. Market Analysis, Insights and Forecast - by Material
- 6.1.1. Plastic
- 6.1.2. Metal
- 6.1.3. Glass
- 6.1.4. Paper and Paperboard
- 6.2. Market Analysis, Insights and Forecast - by Product Type
- 6.2.1. Bottles
- 6.2.2. Cans
- 6.2.3. Boxes
- 6.2.4. Cartons
- 6.3. Market Analysis, Insights and Forecast - by Type
- 6.3.1. Bottled Water
- 6.3.2. Carbonated Drinks
- 6.3.3. Juices
- 6.3.4. RTD Beverages
- 6.3.5. Sport Drinks
- 6.1. Market Analysis, Insights and Forecast - by Material
- 7. Competitive Analysis
- 7.1. Company Profiles
- 7.1.1 CAN-PACK SA
- 7.1.1.1. Company Overview
- 7.1.1.2. Products
- 7.1.1.3. Company Financials
- 7.1.1.4. SWOT Analysis
- 7.1.2 Ball Corporation
- 7.1.2.1. Company Overview
- 7.1.2.2. Products
- 7.1.2.3. Company Financials
- 7.1.2.4. SWOT Analysis
- 7.1.3 Ardagh Group SA
- 7.1.3.1. Company Overview
- 7.1.3.2. Products
- 7.1.3.3. Company Financials
- 7.1.3.4. SWOT Analysis
- 7.1.4 Graham Packaging Company
- 7.1.4.1. Company Overview
- 7.1.4.2. Products
- 7.1.4.3. Company Financials
- 7.1.4.4. SWOT Analysis
- 7.1.5 Tetra Pak International
- 7.1.5.1. Company Overview
- 7.1.5.2. Products
- 7.1.5.3. Company Financials
- 7.1.5.4. SWOT Analysis
- 7.1.6 Amcor PLC
- 7.1.6.1. Company Overview
- 7.1.6.2. Products
- 7.1.6.3. Company Financials
- 7.1.6.4. SWOT Analysis
- 7.1.7 Victory Packaging
- 7.1.7.1. Company Overview
- 7.1.7.2. Products
- 7.1.7.3. Company Financials
- 7.1.7.4. SWOT Analysis
- 7.1.8 Crown Holdings Incorporated
- 7.1.8.1. Company Overview
- 7.1.8.2. Products
- 7.1.8.3. Company Financials
- 7.1.8.4. SWOT Analysis
- 7.1.9 Trivium Packaging*List Not Exhaustive
- 7.1.9.1. Company Overview
- 7.1.9.2. Products
- 7.1.9.3. Company Financials
- 7.1.9.4. SWOT Analysis
- 7.1.10 Refresco Group NV
- 7.1.10.1. Company Overview
- 7.1.10.2. Products
- 7.1.10.3. Company Financials
- 7.1.10.4. SWOT Analysis
- 7.1.1 CAN-PACK SA
- 7.2. Market Entropy
- 7.2.1 Company's Key Areas Served
- 7.2.2 Recent Developments
- 7.3. Company Market Share Analysis 2025
- 7.3.1 Top 5 Companies Market Share Analysis
- 7.3.2 Top 3 Companies Market Share Analysis
- 7.4. List of Potential Customers
- 8. Research Methodology
List of Figures
- Figure 1: Latin America Soft Drinks Packaging Market Revenue Breakdown (million, %) by Product 2025 & 2033
- Figure 2: Latin America Soft Drinks Packaging Market Share (%) by Company 2025
List of Tables
- Table 1: Latin America Soft Drinks Packaging Market Revenue million Forecast, by Material 2020 & 2033
- Table 2: Latin America Soft Drinks Packaging Market Revenue million Forecast, by Product Type 2020 & 2033
- Table 3: Latin America Soft Drinks Packaging Market Revenue million Forecast, by Type 2020 & 2033
- Table 4: Latin America Soft Drinks Packaging Market Revenue million Forecast, by Region 2020 & 2033
- Table 5: Latin America Soft Drinks Packaging Market Revenue million Forecast, by Material 2020 & 2033
- Table 6: Latin America Soft Drinks Packaging Market Revenue million Forecast, by Product Type 2020 & 2033
- Table 7: Latin America Soft Drinks Packaging Market Revenue million Forecast, by Type 2020 & 2033
- Table 8: Latin America Soft Drinks Packaging Market Revenue million Forecast, by Country 2020 & 2033
- Table 9: Brazil Latin America Soft Drinks Packaging Market Revenue (million) Forecast, by Application 2020 & 2033
- Table 10: Argentina Latin America Soft Drinks Packaging Market Revenue (million) Forecast, by Application 2020 & 2033
- Table 11: Chile Latin America Soft Drinks Packaging Market Revenue (million) Forecast, by Application 2020 & 2033
- Table 12: Colombia Latin America Soft Drinks Packaging Market Revenue (million) Forecast, by Application 2020 & 2033
- Table 13: Mexico Latin America Soft Drinks Packaging Market Revenue (million) Forecast, by Application 2020 & 2033
- Table 14: Peru Latin America Soft Drinks Packaging Market Revenue (million) Forecast, by Application 2020 & 2033
- Table 15: Venezuela Latin America Soft Drinks Packaging Market Revenue (million) Forecast, by Application 2020 & 2033
- Table 16: Ecuador Latin America Soft Drinks Packaging Market Revenue (million) Forecast, by Application 2020 & 2033
- Table 17: Bolivia Latin America Soft Drinks Packaging Market Revenue (million) Forecast, by Application 2020 & 2033
- Table 18: Paraguay Latin America Soft Drinks Packaging Market Revenue (million) Forecast, by Application 2020 & 2033
Frequently Asked Questions
1. What is the projected Compound Annual Growth Rate (CAGR) of the Latin America Soft Drinks Packaging Market?
The projected CAGR is approximately 6.8%.
2. Which companies are prominent players in the Latin America Soft Drinks Packaging Market?
Key companies in the market include CAN-PACK SA, Ball Corporation, Ardagh Group SA, Graham Packaging Company, Tetra Pak International, Amcor PLC, Victory Packaging, Crown Holdings Incorporated, Trivium Packaging*List Not Exhaustive, Refresco Group NV.
3. What are the main segments of the Latin America Soft Drinks Packaging Market?
The market segments include Material, Product Type, Type.
4. Can you provide details about the market size?
The market size is estimated to be USD 6791 million as of 2022.
5. What are some drivers contributing to market growth?
Increasing Disposable Income and Growing Economies; Growing Demand for Ready-to-use Drinks.
6. What are the notable trends driving market growth?
Plastic is Expected to Hold the Significant Share.
7. Are there any restraints impacting market growth?
Stringent Government Regulations Against Non-biodegradable Products.
8. Can you provide examples of recent developments in the market?
August 2022 : Avantium N.V., one of the leading technology companies in renewable chemistry, signed an offtake agreement with the Brazilian brewing company AmBev. Through this agreement, AmBev will purchase PEF (polyethylene furanoate), a 100% plant-based and recyclable alternative to plastic from Avantium's Flagship Plant, and will use it to make bottles for its soft drinks portfolio.
9. What pricing options are available for accessing the report?
Pricing options include single-user, multi-user, and enterprise licenses priced at USD 4750, USD 4950, and USD 6800 respectively.
10. Is the market size provided in terms of value or volume?
The market size is provided in terms of value, measured in million.
11. Are there any specific market keywords associated with the report?
Yes, the market keyword associated with the report is "Latin America Soft Drinks Packaging Market," which aids in identifying and referencing the specific market segment covered.
12. How do I determine which pricing option suits my needs best?
The pricing options vary based on user requirements and access needs. Individual users may opt for single-user licenses, while businesses requiring broader access may choose multi-user or enterprise licenses for cost-effective access to the report.
13. Are there any additional resources or data provided in the Latin America Soft Drinks Packaging Market report?
While the report offers comprehensive insights, it's advisable to review the specific contents or supplementary materials provided to ascertain if additional resources or data are available.
14. How can I stay updated on further developments or reports in the Latin America Soft Drinks Packaging Market?
To stay informed about further developments, trends, and reports in the Latin America Soft Drinks Packaging Market, consider subscribing to industry newsletters, following relevant companies and organizations, or regularly checking reputable industry news sources and publications.
Methodology
Step 1 - Identification of Relevant Samples Size from Population Database


Step 2 - Approaches for Defining Global Market Size (Value, Volume* & Price*)

Note*: In applicable scenarios
Step 3 - Data Sources
Primary Research
- Web Analytics
- Survey Reports
- Research Institute
- Latest Research Reports
- Opinion Leaders
Secondary Research
- Annual Reports
- White Paper
- Latest Press Release
- Industry Association
- Paid Database
- Investor Presentations

Step 4 - Data Triangulation
Involves using different sources of information in order to increase the validity of a study
These sources are likely to be stakeholders in a program - participants, other researchers, program staff, other community members, and so on.
Then we put all data in single framework & apply various statistical tools to find out the dynamic on the market.
During the analysis stage, feedback from the stakeholder groups would be compared to determine areas of agreement as well as areas of divergence