

Key Insights
The Middle East and Africa (MEA) cosmetic packaging market is experiencing significant growth, propelled by the region's expanding cosmetics industry and increasing consumer demand for premium and sustainable packaging solutions. The market is valued at $2.1 billion in the base year 2025 and is projected to achieve a Compound Annual Growth Rate (CAGR) of 5.05% from 2025 to 2033. Key growth drivers include rising disposable incomes, a growing youth demographic actively engaging with beauty trends, and the expansion of e-commerce platforms accelerating cosmetic sales. Dominant segments include plastic and glass bottles and containers, while demand for sustainable materials like paper and biodegradable plastics is escalating due to heightened environmental awareness. Growth is particularly strong in hair care, skin care, and color cosmetics, with men's grooming and deodorants showing considerable potential. The UAE and Saudi Arabia lead market expansion, with South Africa and other MEA nations emerging as significant contributors. Challenges encompass raw material price volatility and adherence to stringent regulatory standards. Leading players are strategically focusing on innovation and sustainable solutions to leverage market dynamics.
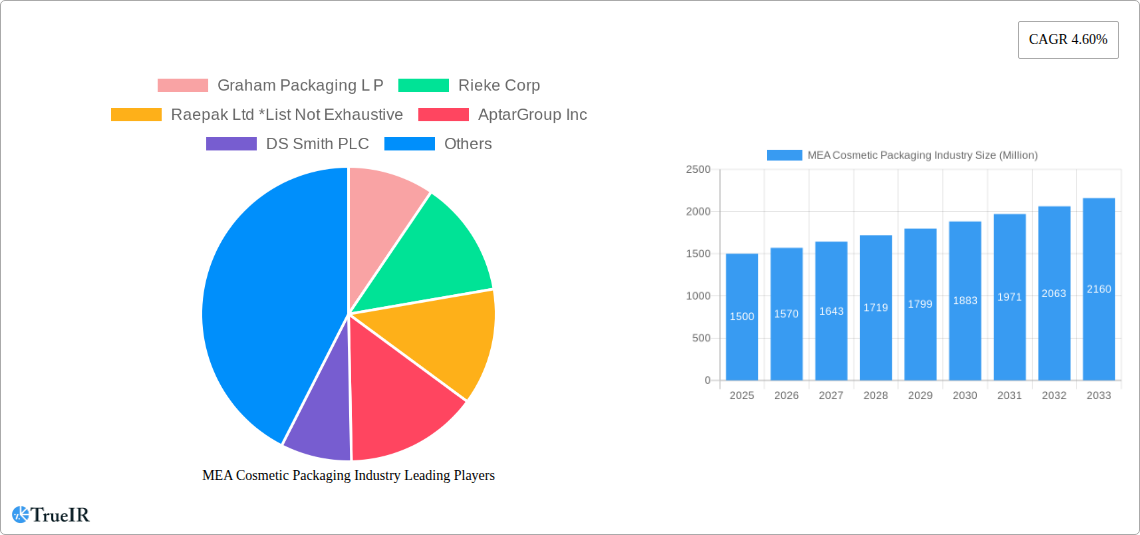
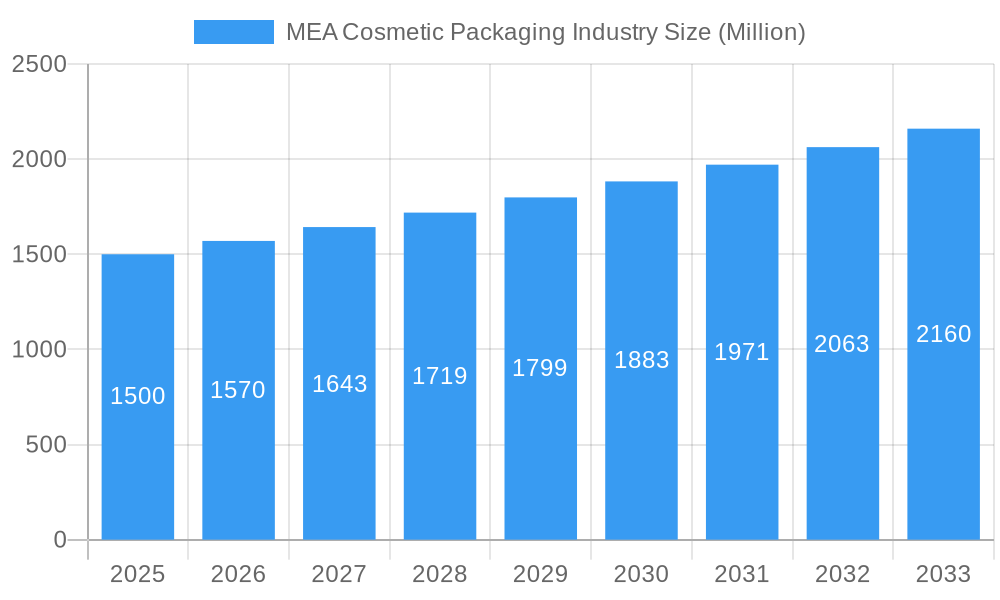
MEA Cosmetic Packaging Industry Market Size (In Billion)
The competitive landscape features a blend of multinational and regional companies investing heavily in research and development to deliver innovative packaging that meets consumer needs for convenience, aesthetics, and sustainability. The rise of personalized cosmetics is influencing packaging trends, with a growing demand for travel-sized and customized options. Further market consolidation is anticipated as companies aim to broaden their geographical presence and product portfolios. Future growth will depend on manufacturers' ability to provide sustainable, innovative, and cost-effective solutions tailored to the evolving preferences within the dynamic MEA cosmetic market.
MEA Cosmetic Packaging Industry Company Market Share
MEA Cosmetic Packaging Market Analysis: Growth, Trends, and Forecast (2025-2033)
This comprehensive report analyzes the Middle East and Africa (MEA) cosmetic packaging industry, providing critical insights for stakeholders. Focusing on the period from 2025 to 2033, the report examines market trends, competitive dynamics, and future growth projections. It includes detailed analysis across key segments: material types (plastic, glass, metal, paper), product types (bottles, containers, tubes, closures), cosmetic types (hair care, skincare, color cosmetics), and major MEA countries (UAE, Saudi Arabia, South Africa, Rest of MEA). The total market size is projected to reach a significant value by 2033, exhibiting a robust CAGR of 5.05% during the forecast period (2025-2033).
MEA Cosmetic Packaging Industry Market Structure & Competitive Landscape
The MEA cosmetic packaging market is characterized by a moderately concentrated structure with several large multinational players and a number of regional players. Key companies include Graham Packaging L P, AptarGroup Inc, DS Smith PLC, Amcor PLC, Albea SA, RPC Group PLC (Berry Global Group), Silgan Holdings Inc, Gerresheimer AG, Rieke Corp, Raepak Ltd, and Cosmopak Ltd. The market exhibits both organic and inorganic growth, with M&A activity contributing significantly to market consolidation. The estimated volume of M&A deals between 2019 and 2024 totaled xx Million.
- Market Concentration: The Herfindahl-Hirschman Index (HHI) is estimated at xx, suggesting a moderately concentrated market.
- Innovation Drivers: Growing demand for sustainable packaging, increasing focus on luxury packaging, and advancements in dispensing technologies are driving innovation.
- Regulatory Impacts: Stringent regulations concerning material safety and environmental protection are shaping packaging choices.
- Product Substitutes: The emergence of eco-friendly alternatives like biodegradable plastics and recycled materials poses a threat to traditional packaging.
- End-User Segmentation: The market is segmented by cosmetic type, with skincare and hair care dominating, followed by color cosmetics and men's grooming.
- M&A Trends: Consolidation is a dominant trend, with larger players acquiring smaller companies to expand their product portfolio and market share.
MEA Cosmetic Packaging Industry Market Trends & Opportunities
The MEA cosmetic packaging market is experiencing robust growth, driven by the burgeoning cosmetics industry, rising disposable incomes, and changing consumer preferences. The market size reached xx Million in 2024 and is projected to reach xx Million by 2033, exhibiting a CAGR of xx%. This growth is fueled by several factors, including:
- Growing Middle Class: A rapidly expanding middle class in several MEA countries is driving increased demand for cosmetic products and thus packaging.
- E-commerce Boom: The surge in online cosmetic sales is increasing demand for convenient and secure packaging options.
- Premiumization Trend: Consumers are increasingly seeking premium and luxury cosmetic products, boosting demand for high-end packaging solutions.
- Sustainability Concerns: Consumers are increasingly environmentally conscious, leading to heightened demand for sustainable and eco-friendly packaging materials.
- Technological Advancements: Innovations in materials science and packaging technologies are creating new opportunities for manufacturers.
- Brand Differentiation: Cosmetic brands are increasingly relying on innovative packaging to enhance brand image and differentiate themselves from competitors.
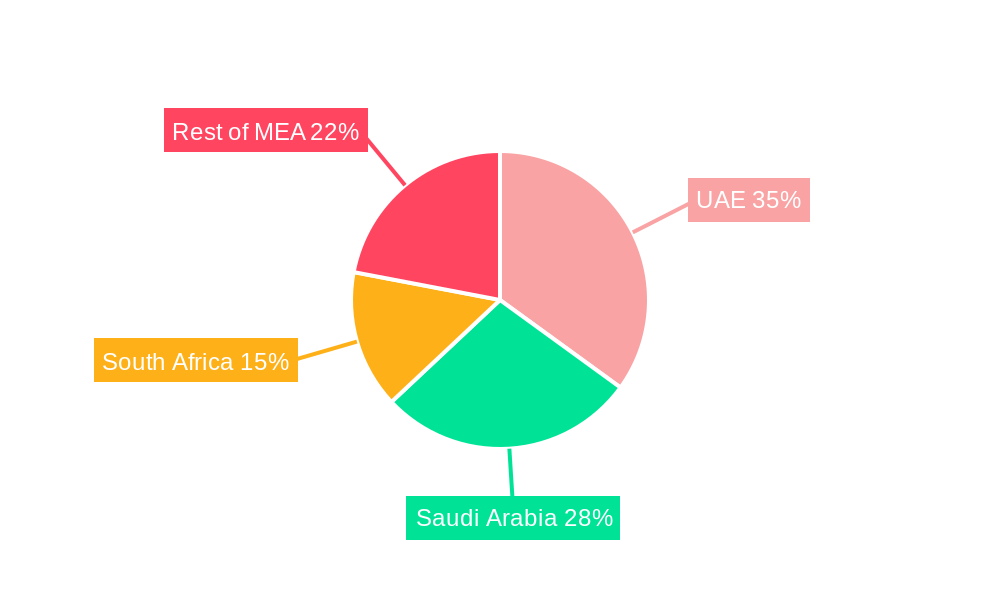
Dominant Markets & Segments in MEA Cosmetic Packaging Industry
The UAE and Saudi Arabia represent the largest markets within the MEA region, driven by high per capita consumption of cosmetic products and strong economic growth. The plastic packaging segment holds the largest market share by material type due to its versatility and cost-effectiveness. Within product types, plastic bottles and containers are the most dominant segment. Skincare is currently the leading segment by cosmetic type, with Hair care and Color Cosmetics following closely behind.
- Key Growth Drivers in the UAE: Strong economic growth, high disposable incomes, and a thriving tourism sector.
- Key Growth Drivers in Saudi Arabia: Government initiatives supporting the growth of the cosmetic industry and a large, young population.
- Key Growth Drivers in South Africa: Growing middle class, increasing urbanization, and rising demand for personal care products.
- Market Dominance Analysis: The UAE and Saudi Arabia's dominance stems from their significant population size, high per capita income and the rapidly growing cosmetic industry within those markets. The plastic segment's dominance is due to its cost-effectiveness and suitability for a wide range of products.
MEA Cosmetic Packaging Industry Product Analysis
Product innovation is a key driver in this market. Advancements focus on sustainability, convenience, and enhanced aesthetics. For instance, the increasing adoption of lightweight and recyclable plastics, the introduction of innovative dispensing systems (e.g., airless pumps), and the integration of smart packaging technologies are significantly influencing the market. These innovations cater to consumer demand for environmentally friendly and user-friendly packaging options, while providing brands with opportunities for differentiation.
Key Drivers, Barriers & Challenges in MEA Cosmetic Packaging Industry
Key Drivers: The primary drivers are the expanding cosmetics market, increasing consumer spending, and growing preference for premium and sustainable packaging options. Government initiatives promoting local manufacturing and favorable regulatory environments in some countries also contribute to growth.
Key Challenges: Supply chain disruptions due to geopolitical instability and increased raw material costs pose significant challenges. Stringent regulations related to material safety and environmental compliance impose additional burdens on manufacturers. Intense competition from both domestic and international players also presents a substantial hurdle. Estimated losses due to supply chain issues in 2024 were approximately xx Million.
Growth Drivers in the MEA Cosmetic Packaging Industry Market
Growth is fueled by rising disposable incomes, expanding e-commerce, increased consumer awareness of premium brands, and governmental support for local manufacturing. Technological advancements in sustainable packaging materials and smart packaging are further accelerating growth.
Challenges Impacting MEA Cosmetic Packaging Industry Growth
Significant challenges include fluctuating raw material prices, supply chain vulnerabilities, stringent regulatory compliance requirements, and intense competition. These factors impact profitability and market growth.
Key Players Shaping the MEA Cosmetic Packaging Industry Market
- Graham Packaging L P
- Rieke Corp
- Raepak Ltd
- AptarGroup Inc
- DS Smith PLC
- Amcor PLC
- Cosmopak Ltd
- Albea SA
- RPC Group PLC (Berry Global Group)
- Silgan Holdings Inc
- Gerresheimer AG
Significant MEA Cosmetic Packaging Industry Industry Milestones
- 2020: Increased focus on sustainable packaging solutions by major players.
- 2021: Launch of several innovative dispensing mechanisms by leading companies.
- 2022: Several mergers and acquisitions consolidating market share.
- 2023: Introduction of new regulations related to plastic packaging in several countries.
- 2024: Significant increase in demand for eco-friendly packaging.
Future Outlook for MEA Cosmetic Packaging Industry Market
The MEA cosmetic packaging industry is poised for continued strong growth, driven by a young and expanding population, increasing consumer spending, and a growing preference for premium and sustainable products. Strategic opportunities exist for companies focused on innovation, sustainability, and efficient supply chain management. The market's future success will depend on adapting to shifting consumer demands and navigating the challenges posed by regulatory changes and global economic conditions.
MEA Cosmetic Packaging Industry Segmentation
-
1. Material type
- 1.1. Plastic
- 1.2. Glass
- 1.3. Metal
- 1.4. Paper
-
2. Product Type
- 2.1. Plastic Bottles and Containers
- 2.2. Glass Bottles and Containers
- 2.3. Metal Containers
- 2.4. Folding Cartons
- 2.5. Corrugated Boxes
- 2.6. Tubes and Sticks
- 2.7. Caps and Closures
- 2.8. Pump and Dispenser
- 2.9. Droppers
- 2.10. Ampoules
- 2.11. Flexible Plastic Packaging
-
3. Cosmetic Type
- 3.1. Hair Care
- 3.2. Color Cosmetics
- 3.3. Skin Care
- 3.4. Men's Grooming
- 3.5. Deodorants
- 3.6. Other Co
MEA Cosmetic Packaging Industry Segmentation By Geography
-
1. North America
- 1.1. United States
- 1.2. Canada
- 1.3. Mexico
-
2. South America
- 2.1. Brazil
- 2.2. Argentina
- 2.3. Rest of South America
-
3. Europe
- 3.1. United Kingdom
- 3.2. Germany
- 3.3. France
- 3.4. Italy
- 3.5. Spain
- 3.6. Russia
- 3.7. Benelux
- 3.8. Nordics
- 3.9. Rest of Europe
-
4. Middle East & Africa
- 4.1. Turkey
- 4.2. Israel
- 4.3. GCC
- 4.4. North Africa
- 4.5. South Africa
- 4.6. Rest of Middle East & Africa
-
5. Asia Pacific
- 5.1. China
- 5.2. India
- 5.3. Japan
- 5.4. South Korea
- 5.5. ASEAN
- 5.6. Oceania
- 5.7. Rest of Asia Pacific
MEA Cosmetic Packaging Industry Regional Market Share
Geographic Coverage of MEA Cosmetic Packaging Industry
MEA Cosmetic Packaging Industry REPORT HIGHLIGHTS
| Aspects | Details |
|---|---|
| Study Period | 2020-2034 |
| Base Year | 2025 |
| Estimated Year | 2026 |
| Forecast Period | 2026-2034 |
| Historical Period | 2020-2025 |
| Growth Rate | CAGR of 5.05% from 2020-2034 |
| Segmentation |
|
Table of Contents
- 1. Introduction
- 1.1. Research Scope
- 1.2. Market Segmentation
- 1.3. Research Objective
- 1.4. Definitions and Assumptions
- 2. Executive Summary
- 2.1. Market Snapshot
- 3. Market Dynamics
- 3.1. Market Drivers
- 3.2. Market Restrains
- 3.3. Market Trends
- 3.4. Market Opportunities
- 4. Market Factor Analysis
- 4.1. Porters Five Forces
- 4.1.1. Bargaining Power of Suppliers
- 4.1.2. Bargaining Power of Buyers
- 4.1.3. Threat of New Entrants
- 4.1.4. Threat of Substitutes
- 4.1.5. Competitive Rivalry
- 4.2. PESTEL analysis
- 4.3. BCG Analysis
- 4.3.1. Stars (High Growth, High Market Share)
- 4.3.2. Cash Cows (Low Growth, High Market Share)
- 4.3.3. Question Mark (High Growth, Low Market Share)
- 4.3.4. Dogs (Low Growth, Low Market Share)
- 4.4. Ansoff Matrix Analysis
- 4.5. Supply Chain Analysis
- 4.6. Regulatory Landscape
- 4.7. Current Market Potential and Opportunity Assessment (TAM–SAM–SOM Framework)
- 4.8. TIR Analyst Note
- 4.1. Porters Five Forces
- 5. Market Analysis, Insights and Forecast 2021-2033
- 5.1. Market Analysis, Insights and Forecast - by Material type
- 5.1.1. Plastic
- 5.1.2. Glass
- 5.1.3. Metal
- 5.1.4. Paper
- 5.2. Market Analysis, Insights and Forecast - by Product Type
- 5.2.1. Plastic Bottles and Containers
- 5.2.2. Glass Bottles and Containers
- 5.2.3. Metal Containers
- 5.2.4. Folding Cartons
- 5.2.5. Corrugated Boxes
- 5.2.6. Tubes and Sticks
- 5.2.7. Caps and Closures
- 5.2.8. Pump and Dispenser
- 5.2.9. Droppers
- 5.2.10. Ampoules
- 5.2.11. Flexible Plastic Packaging
- 5.3. Market Analysis, Insights and Forecast - by Cosmetic Type
- 5.3.1. Hair Care
- 5.3.2. Color Cosmetics
- 5.3.3. Skin Care
- 5.3.4. Men's Grooming
- 5.3.5. Deodorants
- 5.3.6. Other Co
- 5.4. Market Analysis, Insights and Forecast - by Region
- 5.4.1. North America
- 5.4.2. South America
- 5.4.3. Europe
- 5.4.4. Middle East & Africa
- 5.4.5. Asia Pacific
- 5.1. Market Analysis, Insights and Forecast - by Material type
- 6. Global MEA Cosmetic Packaging Industry Analysis, Insights and Forecast, 2021-2033
- 6.1. Market Analysis, Insights and Forecast - by Material type
- 6.1.1. Plastic
- 6.1.2. Glass
- 6.1.3. Metal
- 6.1.4. Paper
- 6.2. Market Analysis, Insights and Forecast - by Product Type
- 6.2.1. Plastic Bottles and Containers
- 6.2.2. Glass Bottles and Containers
- 6.2.3. Metal Containers
- 6.2.4. Folding Cartons
- 6.2.5. Corrugated Boxes
- 6.2.6. Tubes and Sticks
- 6.2.7. Caps and Closures
- 6.2.8. Pump and Dispenser
- 6.2.9. Droppers
- 6.2.10. Ampoules
- 6.2.11. Flexible Plastic Packaging
- 6.3. Market Analysis, Insights and Forecast - by Cosmetic Type
- 6.3.1. Hair Care
- 6.3.2. Color Cosmetics
- 6.3.3. Skin Care
- 6.3.4. Men's Grooming
- 6.3.5. Deodorants
- 6.3.6. Other Co
- 6.1. Market Analysis, Insights and Forecast - by Material type
- 7. North America MEA Cosmetic Packaging Industry Analysis, Insights and Forecast, 2020-2032
- 7.1. Market Analysis, Insights and Forecast - by Material type
- 7.1.1. Plastic
- 7.1.2. Glass
- 7.1.3. Metal
- 7.1.4. Paper
- 7.2. Market Analysis, Insights and Forecast - by Product Type
- 7.2.1. Plastic Bottles and Containers
- 7.2.2. Glass Bottles and Containers
- 7.2.3. Metal Containers
- 7.2.4. Folding Cartons
- 7.2.5. Corrugated Boxes
- 7.2.6. Tubes and Sticks
- 7.2.7. Caps and Closures
- 7.2.8. Pump and Dispenser
- 7.2.9. Droppers
- 7.2.10. Ampoules
- 7.2.11. Flexible Plastic Packaging
- 7.3. Market Analysis, Insights and Forecast - by Cosmetic Type
- 7.3.1. Hair Care
- 7.3.2. Color Cosmetics
- 7.3.3. Skin Care
- 7.3.4. Men's Grooming
- 7.3.5. Deodorants
- 7.3.6. Other Co
- 7.1. Market Analysis, Insights and Forecast - by Material type
- 8. South America MEA Cosmetic Packaging Industry Analysis, Insights and Forecast, 2020-2032
- 8.1. Market Analysis, Insights and Forecast - by Material type
- 8.1.1. Plastic
- 8.1.2. Glass
- 8.1.3. Metal
- 8.1.4. Paper
- 8.2. Market Analysis, Insights and Forecast - by Product Type
- 8.2.1. Plastic Bottles and Containers
- 8.2.2. Glass Bottles and Containers
- 8.2.3. Metal Containers
- 8.2.4. Folding Cartons
- 8.2.5. Corrugated Boxes
- 8.2.6. Tubes and Sticks
- 8.2.7. Caps and Closures
- 8.2.8. Pump and Dispenser
- 8.2.9. Droppers
- 8.2.10. Ampoules
- 8.2.11. Flexible Plastic Packaging
- 8.3. Market Analysis, Insights and Forecast - by Cosmetic Type
- 8.3.1. Hair Care
- 8.3.2. Color Cosmetics
- 8.3.3. Skin Care
- 8.3.4. Men's Grooming
- 8.3.5. Deodorants
- 8.3.6. Other Co
- 8.1. Market Analysis, Insights and Forecast - by Material type
- 9. Europe MEA Cosmetic Packaging Industry Analysis, Insights and Forecast, 2020-2032
- 9.1. Market Analysis, Insights and Forecast - by Material type
- 9.1.1. Plastic
- 9.1.2. Glass
- 9.1.3. Metal
- 9.1.4. Paper
- 9.2. Market Analysis, Insights and Forecast - by Product Type
- 9.2.1. Plastic Bottles and Containers
- 9.2.2. Glass Bottles and Containers
- 9.2.3. Metal Containers
- 9.2.4. Folding Cartons
- 9.2.5. Corrugated Boxes
- 9.2.6. Tubes and Sticks
- 9.2.7. Caps and Closures
- 9.2.8. Pump and Dispenser
- 9.2.9. Droppers
- 9.2.10. Ampoules
- 9.2.11. Flexible Plastic Packaging
- 9.3. Market Analysis, Insights and Forecast - by Cosmetic Type
- 9.3.1. Hair Care
- 9.3.2. Color Cosmetics
- 9.3.3. Skin Care
- 9.3.4. Men's Grooming
- 9.3.5. Deodorants
- 9.3.6. Other Co
- 9.1. Market Analysis, Insights and Forecast - by Material type
- 10. Middle East & Africa MEA Cosmetic Packaging Industry Analysis, Insights and Forecast, 2020-2032
- 10.1. Market Analysis, Insights and Forecast - by Material type
- 10.1.1. Plastic
- 10.1.2. Glass
- 10.1.3. Metal
- 10.1.4. Paper
- 10.2. Market Analysis, Insights and Forecast - by Product Type
- 10.2.1. Plastic Bottles and Containers
- 10.2.2. Glass Bottles and Containers
- 10.2.3. Metal Containers
- 10.2.4. Folding Cartons
- 10.2.5. Corrugated Boxes
- 10.2.6. Tubes and Sticks
- 10.2.7. Caps and Closures
- 10.2.8. Pump and Dispenser
- 10.2.9. Droppers
- 10.2.10. Ampoules
- 10.2.11. Flexible Plastic Packaging
- 10.3. Market Analysis, Insights and Forecast - by Cosmetic Type
- 10.3.1. Hair Care
- 10.3.2. Color Cosmetics
- 10.3.3. Skin Care
- 10.3.4. Men's Grooming
- 10.3.5. Deodorants
- 10.3.6. Other Co
- 10.1. Market Analysis, Insights and Forecast - by Material type
- 11. Asia Pacific MEA Cosmetic Packaging Industry Analysis, Insights and Forecast, 2020-2032
- 11.1. Market Analysis, Insights and Forecast - by Material type
- 11.1.1. Plastic
- 11.1.2. Glass
- 11.1.3. Metal
- 11.1.4. Paper
- 11.2. Market Analysis, Insights and Forecast - by Product Type
- 11.2.1. Plastic Bottles and Containers
- 11.2.2. Glass Bottles and Containers
- 11.2.3. Metal Containers
- 11.2.4. Folding Cartons
- 11.2.5. Corrugated Boxes
- 11.2.6. Tubes and Sticks
- 11.2.7. Caps and Closures
- 11.2.8. Pump and Dispenser
- 11.2.9. Droppers
- 11.2.10. Ampoules
- 11.2.11. Flexible Plastic Packaging
- 11.3. Market Analysis, Insights and Forecast - by Cosmetic Type
- 11.3.1. Hair Care
- 11.3.2. Color Cosmetics
- 11.3.3. Skin Care
- 11.3.4. Men's Grooming
- 11.3.5. Deodorants
- 11.3.6. Other Co
- 11.1. Market Analysis, Insights and Forecast - by Material type
- 12. Competitive Analysis
- 12.1. Company Profiles
- 12.1.1 Graham Packaging L P
- 12.1.1.1. Company Overview
- 12.1.1.2. Products
- 12.1.1.3. Company Financials
- 12.1.1.4. SWOT Analysis
- 12.1.2 Rieke Corp
- 12.1.2.1. Company Overview
- 12.1.2.2. Products
- 12.1.2.3. Company Financials
- 12.1.2.4. SWOT Analysis
- 12.1.3 Raepak Ltd *List Not Exhaustive
- 12.1.3.1. Company Overview
- 12.1.3.2. Products
- 12.1.3.3. Company Financials
- 12.1.3.4. SWOT Analysis
- 12.1.4 AptarGroup Inc
- 12.1.4.1. Company Overview
- 12.1.4.2. Products
- 12.1.4.3. Company Financials
- 12.1.4.4. SWOT Analysis
- 12.1.5 DS Smith PLC
- 12.1.5.1. Company Overview
- 12.1.5.2. Products
- 12.1.5.3. Company Financials
- 12.1.5.4. SWOT Analysis
- 12.1.6 Amcor PLC
- 12.1.6.1. Company Overview
- 12.1.6.2. Products
- 12.1.6.3. Company Financials
- 12.1.6.4. SWOT Analysis
- 12.1.7 Cosmopak Ltd
- 12.1.7.1. Company Overview
- 12.1.7.2. Products
- 12.1.7.3. Company Financials
- 12.1.7.4. SWOT Analysis
- 12.1.8 Albea SA
- 12.1.8.1. Company Overview
- 12.1.8.2. Products
- 12.1.8.3. Company Financials
- 12.1.8.4. SWOT Analysis
- 12.1.9 RPC Group PLC (Berry Global Group)
- 12.1.9.1. Company Overview
- 12.1.9.2. Products
- 12.1.9.3. Company Financials
- 12.1.9.4. SWOT Analysis
- 12.1.10 Silgan Holdings Inc
- 12.1.10.1. Company Overview
- 12.1.10.2. Products
- 12.1.10.3. Company Financials
- 12.1.10.4. SWOT Analysis
- 12.1.11 Gerresheimer AG
- 12.1.11.1. Company Overview
- 12.1.11.2. Products
- 12.1.11.3. Company Financials
- 12.1.11.4. SWOT Analysis
- 12.1.1 Graham Packaging L P
- 12.2. Market Entropy
- 12.2.1 Company's Key Areas Served
- 12.2.2 Recent Developments
- 12.3. Company Market Share Analysis 2025
- 12.3.1 Top 5 Companies Market Share Analysis
- 12.3.2 Top 3 Companies Market Share Analysis
- 12.4. List of Potential Customers
- 13. Research Methodology
List of Figures
- Figure 1: Global MEA Cosmetic Packaging Industry Revenue Breakdown (billion, %) by Region 2025 & 2033
- Figure 2: North America MEA Cosmetic Packaging Industry Revenue (billion), by Material type 2025 & 2033
- Figure 3: North America MEA Cosmetic Packaging Industry Revenue Share (%), by Material type 2025 & 2033
- Figure 4: North America MEA Cosmetic Packaging Industry Revenue (billion), by Product Type 2025 & 2033
- Figure 5: North America MEA Cosmetic Packaging Industry Revenue Share (%), by Product Type 2025 & 2033
- Figure 6: North America MEA Cosmetic Packaging Industry Revenue (billion), by Cosmetic Type 2025 & 2033
- Figure 7: North America MEA Cosmetic Packaging Industry Revenue Share (%), by Cosmetic Type 2025 & 2033
- Figure 8: North America MEA Cosmetic Packaging Industry Revenue (billion), by Country 2025 & 2033
- Figure 9: North America MEA Cosmetic Packaging Industry Revenue Share (%), by Country 2025 & 2033
- Figure 10: South America MEA Cosmetic Packaging Industry Revenue (billion), by Material type 2025 & 2033
- Figure 11: South America MEA Cosmetic Packaging Industry Revenue Share (%), by Material type 2025 & 2033
- Figure 12: South America MEA Cosmetic Packaging Industry Revenue (billion), by Product Type 2025 & 2033
- Figure 13: South America MEA Cosmetic Packaging Industry Revenue Share (%), by Product Type 2025 & 2033
- Figure 14: South America MEA Cosmetic Packaging Industry Revenue (billion), by Cosmetic Type 2025 & 2033
- Figure 15: South America MEA Cosmetic Packaging Industry Revenue Share (%), by Cosmetic Type 2025 & 2033
- Figure 16: South America MEA Cosmetic Packaging Industry Revenue (billion), by Country 2025 & 2033
- Figure 17: South America MEA Cosmetic Packaging Industry Revenue Share (%), by Country 2025 & 2033
- Figure 18: Europe MEA Cosmetic Packaging Industry Revenue (billion), by Material type 2025 & 2033
- Figure 19: Europe MEA Cosmetic Packaging Industry Revenue Share (%), by Material type 2025 & 2033
- Figure 20: Europe MEA Cosmetic Packaging Industry Revenue (billion), by Product Type 2025 & 2033
- Figure 21: Europe MEA Cosmetic Packaging Industry Revenue Share (%), by Product Type 2025 & 2033
- Figure 22: Europe MEA Cosmetic Packaging Industry Revenue (billion), by Cosmetic Type 2025 & 2033
- Figure 23: Europe MEA Cosmetic Packaging Industry Revenue Share (%), by Cosmetic Type 2025 & 2033
- Figure 24: Europe MEA Cosmetic Packaging Industry Revenue (billion), by Country 2025 & 2033
- Figure 25: Europe MEA Cosmetic Packaging Industry Revenue Share (%), by Country 2025 & 2033
- Figure 26: Middle East & Africa MEA Cosmetic Packaging Industry Revenue (billion), by Material type 2025 & 2033
- Figure 27: Middle East & Africa MEA Cosmetic Packaging Industry Revenue Share (%), by Material type 2025 & 2033
- Figure 28: Middle East & Africa MEA Cosmetic Packaging Industry Revenue (billion), by Product Type 2025 & 2033
- Figure 29: Middle East & Africa MEA Cosmetic Packaging Industry Revenue Share (%), by Product Type 2025 & 2033
- Figure 30: Middle East & Africa MEA Cosmetic Packaging Industry Revenue (billion), by Cosmetic Type 2025 & 2033
- Figure 31: Middle East & Africa MEA Cosmetic Packaging Industry Revenue Share (%), by Cosmetic Type 2025 & 2033
- Figure 32: Middle East & Africa MEA Cosmetic Packaging Industry Revenue (billion), by Country 2025 & 2033
- Figure 33: Middle East & Africa MEA Cosmetic Packaging Industry Revenue Share (%), by Country 2025 & 2033
- Figure 34: Asia Pacific MEA Cosmetic Packaging Industry Revenue (billion), by Material type 2025 & 2033
- Figure 35: Asia Pacific MEA Cosmetic Packaging Industry Revenue Share (%), by Material type 2025 & 2033
- Figure 36: Asia Pacific MEA Cosmetic Packaging Industry Revenue (billion), by Product Type 2025 & 2033
- Figure 37: Asia Pacific MEA Cosmetic Packaging Industry Revenue Share (%), by Product Type 2025 & 2033
- Figure 38: Asia Pacific MEA Cosmetic Packaging Industry Revenue (billion), by Cosmetic Type 2025 & 2033
- Figure 39: Asia Pacific MEA Cosmetic Packaging Industry Revenue Share (%), by Cosmetic Type 2025 & 2033
- Figure 40: Asia Pacific MEA Cosmetic Packaging Industry Revenue (billion), by Country 2025 & 2033
- Figure 41: Asia Pacific MEA Cosmetic Packaging Industry Revenue Share (%), by Country 2025 & 2033
List of Tables
- Table 1: Global MEA Cosmetic Packaging Industry Revenue billion Forecast, by Material type 2020 & 2033
- Table 2: Global MEA Cosmetic Packaging Industry Revenue billion Forecast, by Product Type 2020 & 2033
- Table 3: Global MEA Cosmetic Packaging Industry Revenue billion Forecast, by Cosmetic Type 2020 & 2033
- Table 4: Global MEA Cosmetic Packaging Industry Revenue billion Forecast, by Region 2020 & 2033
- Table 5: Global MEA Cosmetic Packaging Industry Revenue billion Forecast, by Material type 2020 & 2033
- Table 6: Global MEA Cosmetic Packaging Industry Revenue billion Forecast, by Product Type 2020 & 2033
- Table 7: Global MEA Cosmetic Packaging Industry Revenue billion Forecast, by Cosmetic Type 2020 & 2033
- Table 8: Global MEA Cosmetic Packaging Industry Revenue billion Forecast, by Country 2020 & 2033
- Table 9: United States MEA Cosmetic Packaging Industry Revenue (billion) Forecast, by Application 2020 & 2033
- Table 10: Canada MEA Cosmetic Packaging Industry Revenue (billion) Forecast, by Application 2020 & 2033
- Table 11: Mexico MEA Cosmetic Packaging Industry Revenue (billion) Forecast, by Application 2020 & 2033
- Table 12: Global MEA Cosmetic Packaging Industry Revenue billion Forecast, by Material type 2020 & 2033
- Table 13: Global MEA Cosmetic Packaging Industry Revenue billion Forecast, by Product Type 2020 & 2033
- Table 14: Global MEA Cosmetic Packaging Industry Revenue billion Forecast, by Cosmetic Type 2020 & 2033
- Table 15: Global MEA Cosmetic Packaging Industry Revenue billion Forecast, by Country 2020 & 2033
- Table 16: Brazil MEA Cosmetic Packaging Industry Revenue (billion) Forecast, by Application 2020 & 2033
- Table 17: Argentina MEA Cosmetic Packaging Industry Revenue (billion) Forecast, by Application 2020 & 2033
- Table 18: Rest of South America MEA Cosmetic Packaging Industry Revenue (billion) Forecast, by Application 2020 & 2033
- Table 19: Global MEA Cosmetic Packaging Industry Revenue billion Forecast, by Material type 2020 & 2033
- Table 20: Global MEA Cosmetic Packaging Industry Revenue billion Forecast, by Product Type 2020 & 2033
- Table 21: Global MEA Cosmetic Packaging Industry Revenue billion Forecast, by Cosmetic Type 2020 & 2033
- Table 22: Global MEA Cosmetic Packaging Industry Revenue billion Forecast, by Country 2020 & 2033
- Table 23: United Kingdom MEA Cosmetic Packaging Industry Revenue (billion) Forecast, by Application 2020 & 2033
- Table 24: Germany MEA Cosmetic Packaging Industry Revenue (billion) Forecast, by Application 2020 & 2033
- Table 25: France MEA Cosmetic Packaging Industry Revenue (billion) Forecast, by Application 2020 & 2033
- Table 26: Italy MEA Cosmetic Packaging Industry Revenue (billion) Forecast, by Application 2020 & 2033
- Table 27: Spain MEA Cosmetic Packaging Industry Revenue (billion) Forecast, by Application 2020 & 2033
- Table 28: Russia MEA Cosmetic Packaging Industry Revenue (billion) Forecast, by Application 2020 & 2033
- Table 29: Benelux MEA Cosmetic Packaging Industry Revenue (billion) Forecast, by Application 2020 & 2033
- Table 30: Nordics MEA Cosmetic Packaging Industry Revenue (billion) Forecast, by Application 2020 & 2033
- Table 31: Rest of Europe MEA Cosmetic Packaging Industry Revenue (billion) Forecast, by Application 2020 & 2033
- Table 32: Global MEA Cosmetic Packaging Industry Revenue billion Forecast, by Material type 2020 & 2033
- Table 33: Global MEA Cosmetic Packaging Industry Revenue billion Forecast, by Product Type 2020 & 2033
- Table 34: Global MEA Cosmetic Packaging Industry Revenue billion Forecast, by Cosmetic Type 2020 & 2033
- Table 35: Global MEA Cosmetic Packaging Industry Revenue billion Forecast, by Country 2020 & 2033
- Table 36: Turkey MEA Cosmetic Packaging Industry Revenue (billion) Forecast, by Application 2020 & 2033
- Table 37: Israel MEA Cosmetic Packaging Industry Revenue (billion) Forecast, by Application 2020 & 2033
- Table 38: GCC MEA Cosmetic Packaging Industry Revenue (billion) Forecast, by Application 2020 & 2033
- Table 39: North Africa MEA Cosmetic Packaging Industry Revenue (billion) Forecast, by Application 2020 & 2033
- Table 40: South Africa MEA Cosmetic Packaging Industry Revenue (billion) Forecast, by Application 2020 & 2033
- Table 41: Rest of Middle East & Africa MEA Cosmetic Packaging Industry Revenue (billion) Forecast, by Application 2020 & 2033
- Table 42: Global MEA Cosmetic Packaging Industry Revenue billion Forecast, by Material type 2020 & 2033
- Table 43: Global MEA Cosmetic Packaging Industry Revenue billion Forecast, by Product Type 2020 & 2033
- Table 44: Global MEA Cosmetic Packaging Industry Revenue billion Forecast, by Cosmetic Type 2020 & 2033
- Table 45: Global MEA Cosmetic Packaging Industry Revenue billion Forecast, by Country 2020 & 2033
- Table 46: China MEA Cosmetic Packaging Industry Revenue (billion) Forecast, by Application 2020 & 2033
- Table 47: India MEA Cosmetic Packaging Industry Revenue (billion) Forecast, by Application 2020 & 2033
- Table 48: Japan MEA Cosmetic Packaging Industry Revenue (billion) Forecast, by Application 2020 & 2033
- Table 49: South Korea MEA Cosmetic Packaging Industry Revenue (billion) Forecast, by Application 2020 & 2033
- Table 50: ASEAN MEA Cosmetic Packaging Industry Revenue (billion) Forecast, by Application 2020 & 2033
- Table 51: Oceania MEA Cosmetic Packaging Industry Revenue (billion) Forecast, by Application 2020 & 2033
- Table 52: Rest of Asia Pacific MEA Cosmetic Packaging Industry Revenue (billion) Forecast, by Application 2020 & 2033
Frequently Asked Questions
1. What is the projected Compound Annual Growth Rate (CAGR) of the MEA Cosmetic Packaging Industry?
The projected CAGR is approximately 5.05%.
2. Which companies are prominent players in the MEA Cosmetic Packaging Industry?
Key companies in the market include Graham Packaging L P, Rieke Corp, Raepak Ltd *List Not Exhaustive, AptarGroup Inc, DS Smith PLC, Amcor PLC, Cosmopak Ltd, Albea SA, RPC Group PLC (Berry Global Group), Silgan Holdings Inc, Gerresheimer AG.
3. What are the main segments of the MEA Cosmetic Packaging Industry?
The market segments include Material type, Product Type, Cosmetic Type.
4. Can you provide details about the market size?
The market size is estimated to be USD 2.1 billion as of 2022.
5. What are some drivers contributing to market growth?
; Increasing Focus on Innovation and Attractive Packaging.
6. What are the notable trends driving market growth?
Sustainable Packaging to Drive the Market Growth.
7. Are there any restraints impacting market growth?
; Growing Sustainability Concerns.
8. Can you provide examples of recent developments in the market?
N/A
9. What pricing options are available for accessing the report?
Pricing options include single-user, multi-user, and enterprise licenses priced at USD 3800, USD 4500, and USD 5800 respectively.
10. Is the market size provided in terms of value or volume?
The market size is provided in terms of value, measured in billion.
11. Are there any specific market keywords associated with the report?
Yes, the market keyword associated with the report is "MEA Cosmetic Packaging Industry," which aids in identifying and referencing the specific market segment covered.
12. How do I determine which pricing option suits my needs best?
The pricing options vary based on user requirements and access needs. Individual users may opt for single-user licenses, while businesses requiring broader access may choose multi-user or enterprise licenses for cost-effective access to the report.
13. Are there any additional resources or data provided in the MEA Cosmetic Packaging Industry report?
While the report offers comprehensive insights, it's advisable to review the specific contents or supplementary materials provided to ascertain if additional resources or data are available.
14. How can I stay updated on further developments or reports in the MEA Cosmetic Packaging Industry?
To stay informed about further developments, trends, and reports in the MEA Cosmetic Packaging Industry, consider subscribing to industry newsletters, following relevant companies and organizations, or regularly checking reputable industry news sources and publications.
Methodology
Step 1 - Identification of Relevant Samples Size from Population Database


Step 2 - Approaches for Defining Global Market Size (Value, Volume* & Price*)

Note*: In applicable scenarios
Step 3 - Data Sources
Primary Research
- Web Analytics
- Survey Reports
- Research Institute
- Latest Research Reports
- Opinion Leaders
Secondary Research
- Annual Reports
- White Paper
- Latest Press Release
- Industry Association
- Paid Database
- Investor Presentations

Step 4 - Data Triangulation
Involves using different sources of information in order to increase the validity of a study
These sources are likely to be stakeholders in a program - participants, other researchers, program staff, other community members, and so on.
Then we put all data in single framework & apply various statistical tools to find out the dynamic on the market.
During the analysis stage, feedback from the stakeholder groups would be compared to determine areas of agreement as well as areas of divergence