

Key Insights
The North America soft drinks packaging market is projected to reach $42.16 billion by 2025, exhibiting a Compound Annual Growth Rate (CAGR) of 6.57% through 2033. Growth is propelled by increased demand for convenient, on-the-go beverage consumption, particularly ready-to-drink (RTD) and sports beverages. Technological advancements in lightweighting and the adoption of sustainable materials like recycled plastics and plant-based alternatives are also key drivers. Shifting consumer preferences towards healthier and functional beverages are spurring innovation in packaging materials and designs. The market is segmented by packaging material (plastic, paper & paperboard, glass, metal) and product type (bottled water, carbonated drinks, juices, RTD beverages, sports drinks). Plastic packaging currently leads due to its cost-effectiveness and versatility. However, growing environmental consciousness presents significant opportunities for paper-based and sustainable packaging solutions.
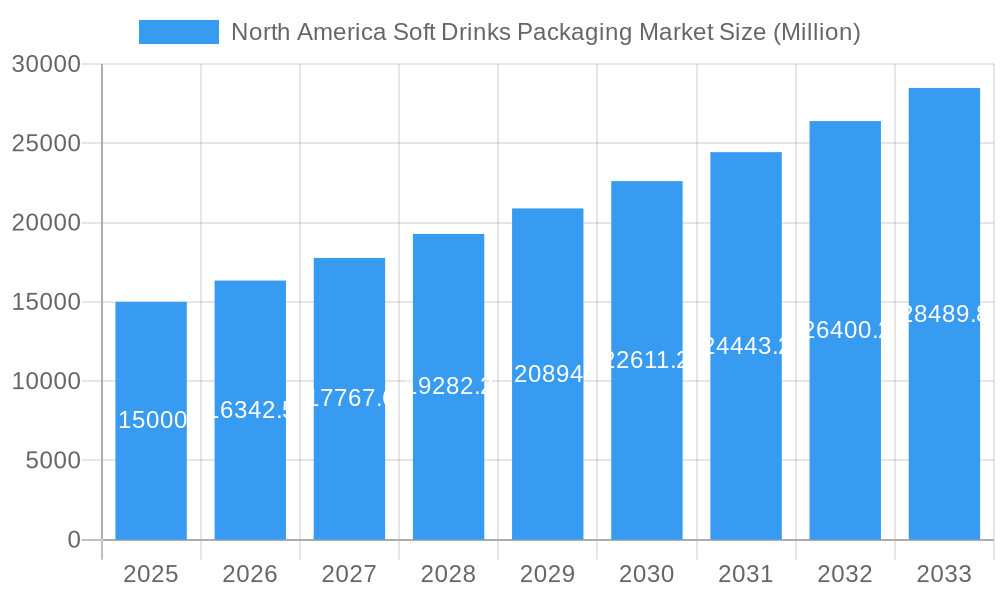
North America Soft Drinks Packaging Market Market Size (In Billion)
Intense competition characterizes the market, with leading players focusing on innovation, strategic partnerships, and acquisitions. The United States represents the largest market segment in North America, driven by high consumption rates. Canada and Mexico also contribute substantially, influenced by per capita income and consumer preferences. Potential restraints include fluctuating raw material prices and stringent environmental regulations. Nevertheless, the overall positive growth trajectory indicates a promising outlook for the North America soft drinks packaging market, with sustainability and the expanding RTD beverage segment expected to shape its future landscape.
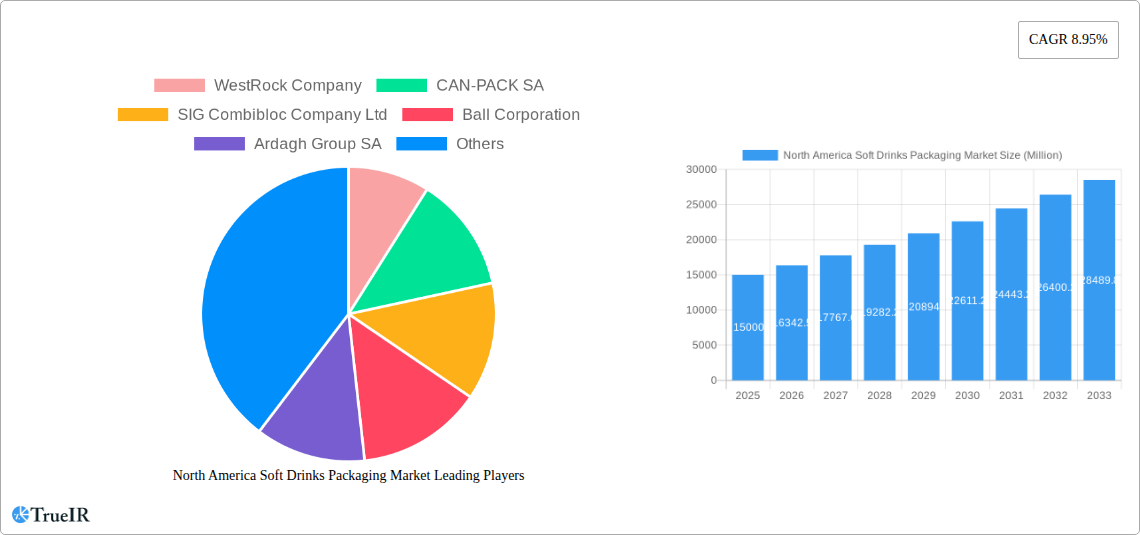
North America Soft Drinks Packaging Market Company Market Share
North America Soft Drinks Packaging Market Analysis: 2025-2033
This report offers a comprehensive analysis of the North America soft drinks packaging market, providing critical insights for strategic decision-making. It covers market size, segmentation, competitive dynamics, and future trends. The forecast period is 2025-2033, with 2025 as the base year. This report is essential for industry stakeholders, investors, and market analysts seeking a thorough understanding of this dynamic market. The market size for the base year, 2025, is estimated at $42.16 billion.
North America Soft Drinks Packaging Market Structure & Competitive Landscape
The North America soft drinks packaging market exhibits a moderately concentrated structure, with several large multinational companies holding significant market share. Key players include WestRock Company, CAN-PACK SA, SIG Combibloc Company Ltd, Ball Corporation, Ardagh Group SA, Alcoa Corporation, Crown Holdings Inc, Graham Packaging Company, Tetra Pak International, The Scoular Company, Toyo Seikan Group Holdings Ltd, Pactive LLC, Placon Corporation, Genpak LLC, Owens-Illinois Inc, and Amcor Ltd. However, the market also includes numerous smaller players, particularly in specialized segments.
- Market Concentration: The Herfindahl-Hirschman Index (HHI) is estimated to be xx, indicating a moderately concentrated market.
- Innovation Drivers: Sustainability concerns, evolving consumer preferences (e.g., demand for lightweighting and recyclability), and technological advancements in packaging materials (e.g., flexible packaging, bioplastics) drive innovation.
- Regulatory Impacts: Government regulations concerning recyclability, food safety, and labeling significantly influence packaging choices and necessitate continuous adaptation by market players. This results in a xx Million annual regulatory compliance cost for the industry.
- Product Substitutes: While traditional materials (glass, metal, plastic, paperboard) dominate, there's increasing competition from alternative materials like bio-based plastics and biodegradable packaging.
- End-User Segmentation: The market is segmented by product type (bottled water, carbonated drinks, juices, RTD beverages, sports drinks, and others) and packaging material type (plastic, paper and paperboard, glass, metal, and other materials). Bottled water and carbonated drinks currently represent the largest segments.
- M&A Trends: Consolidation through mergers and acquisitions is observed, with larger companies strategically acquiring smaller players to expand their product portfolio and market reach. An estimated xx M&A deals occurred between 2019 and 2024, with a total value of xx Million.
North America Soft Drinks Packaging Market Trends & Opportunities
The North America soft drinks packaging market is experiencing robust growth, driven by several factors. The market size is projected to reach xx Million by 2033, exhibiting a Compound Annual Growth Rate (CAGR) of xx% during the forecast period. This growth is fueled by increasing soft drinks consumption, particularly in developing regions. The shift toward healthier beverage options is also shaping the market, with increased demand for functional beverages and healthier packaging solutions. Technological advancements, particularly in lightweighting and sustainable packaging materials, are creating significant opportunities.
Consumer preferences for convenience, portability, and sustainability are reshaping packaging design and material choices. This is reflected in the rising adoption of lightweight plastic bottles, recyclable packaging, and innovative closures. Competitive dynamics are characterized by intense competition among packaging material suppliers, who continuously strive to offer superior quality, cost-effectiveness, and sustainability. Market penetration rates for innovative packaging technologies, such as smart packaging and active packaging, are expected to increase significantly in the coming years, creating new revenue streams for market participants.
Dominant Markets & Segments in North America Soft Drinks Packaging Market
The United States dominates the North America soft drinks packaging market, driven by high soft drinks consumption and a well-established infrastructure. Within the market, plastic packaging holds the largest share in terms of volume due to its cost-effectiveness and versatility. However, paper and paperboard packaging is witnessing strong growth owing to increasing environmental concerns and government initiatives promoting sustainable materials. The bottled water segment is also experiencing rapid expansion because of the growing consumer preference for health and hydration.
- Key Growth Drivers for Plastic Packaging: Low cost, versatility, ease of manufacturing, and efficient distribution channels.
- Key Growth Drivers for Paper and Paperboard Packaging: Increasing consumer preference for eco-friendly options, and stricter regulations regarding plastic waste.
- Key Growth Drivers for Bottled Water Segment: Rising health consciousness, increased physical activity, and favorable regulatory environment.
- Key Growth Drivers for the United States: High per capita soft drink consumption, robust retail infrastructure, and advanced technology.
North America Soft Drinks Packaging Market Product Analysis
Significant innovation is driving the market, including lightweighting, improved barrier properties, and increased recyclability. Companies are investing in advanced materials like bioplastics and recycled content to cater to growing sustainability concerns. This translates to cost savings for producers and consumers alike, and improved brand image for environmentally conscious brands. The focus on innovative closures and easy-opening mechanisms also enhances consumer experience. Market fit is primarily determined by cost, performance, sustainability attributes, and regulatory compliance.
Key Drivers, Barriers & Challenges in North America Soft Drinks Packaging Market
Key Drivers: The growth of the soft drinks industry, increasing demand for convenient and sustainable packaging, technological advancements in packaging materials, and favorable government policies promoting sustainable packaging are key drivers.
Challenges: Supply chain disruptions (due to raw material shortages, geopolitical uncertainties, and increased transportation costs), fluctuating raw material prices, stringent environmental regulations, and intense competition among packaging suppliers pose significant challenges. These challenges can result in increased production costs and affect overall profitability. For instance, a xx% increase in raw material prices can impact profit margins by approximately xx Million annually.
Growth Drivers in the North America Soft Drinks Packaging Market Market
Technological advancements, such as the development of lightweight and sustainable packaging materials, are significant drivers. Growing consumer demand for convenience and on-the-go consumption fuels the market's growth. Favorable government policies promoting recycling and sustainable practices further accelerate market expansion.
Challenges Impacting North America Soft Drinks Packaging Market Growth
Stringent environmental regulations related to plastic waste and stricter safety standards increase the cost of compliance. Fluctuations in raw material prices and supply chain disruptions create uncertainty for manufacturers. Intense competition among packaging suppliers, coupled with price pressure from soft drink brands, creates challenges for maintaining profitability.
Key Players Shaping the North America Soft Drinks Packaging Market Market
- WestRock Company
- CAN-PACK SA
- SIG Combibloc Company Ltd
- Ball Corporation
- Ardagh Group SA
- Alcoa Corporation
- Crown Holdings Inc
- Graham Packaging Company
- Tetra Pak International
- The Scoular Company
- Toyo Seikan Group Holdings Ltd
- Pactive LLC
- Placon Corporation
- Genpak LLC
- Owens-Illinois Inc
- Amcor Ltd
Significant North America Soft Drinks Packaging Market Industry Milestones
- May 2021: Ball Corporation launched its Ball Aluminum Cup for soft drinks, expanding to over 18,000 retailers nationwide.
- April 2021: Amcor invested USD 10-15 Million in ePac flexible packaging, boosting digital printing capabilities.
Future Outlook for North America Soft Drinks Packaging Market Market
The North America soft drinks packaging market is poised for continued growth, driven by innovation in sustainable materials and increasing consumer demand. Opportunities lie in developing lightweight, recyclable, and compostable packaging solutions. Strategic partnerships and collaborations among packaging manufacturers and beverage companies will play a key role in shaping the market's future. The focus on circular economy models and reduced environmental impact will be pivotal in driving market growth and attracting environmentally conscious consumers.
North America Soft Drinks Packaging Market Segmentation
-
1. Packaging Material Type
- 1.1. Plastic
- 1.2. Paper and Paperboard
- 1.3. Glass
- 1.4. Metal
- 1.5. Other Materials
-
2. Product Type
- 2.1. Bottled Water
- 2.2. Carbonated Drinks
- 2.3. Juices
- 2.4. RTD Beverages
- 2.5. Sports Drinks
- 2.6. Other Product Types
-
3. Geography
- 3.1. United States
- 3.2. Canada
North America Soft Drinks Packaging Market Segmentation By Geography
- 1. United States
- 2. Canada
North America Soft Drinks Packaging Market Regional Market Share
Geographic Coverage of North America Soft Drinks Packaging Market
North America Soft Drinks Packaging Market REPORT HIGHLIGHTS
| Aspects | Details |
|---|---|
| Study Period | 2020-2034 |
| Base Year | 2025 |
| Estimated Year | 2026 |
| Forecast Period | 2026-2034 |
| Historical Period | 2020-2025 |
| Growth Rate | CAGR of 6.57% from 2020-2034 |
| Segmentation |
|
Table of Contents
- 1. Introduction
- 1.1. Research Scope
- 1.2. Market Segmentation
- 1.3. Research Objective
- 1.4. Definitions and Assumptions
- 2. Executive Summary
- 2.1. Market Snapshot
- 3. Market Dynamics
- 3.1. Market Drivers
- 3.2. Market Restrains
- 3.3. Market Trends
- 3.4. Market Opportunities
- 4. Market Factor Analysis
- 4.1. Porters Five Forces
- 4.1.1. Bargaining Power of Suppliers
- 4.1.2. Bargaining Power of Buyers
- 4.1.3. Threat of New Entrants
- 4.1.4. Threat of Substitutes
- 4.1.5. Competitive Rivalry
- 4.2. PESTEL analysis
- 4.3. BCG Analysis
- 4.3.1. Stars (High Growth, High Market Share)
- 4.3.2. Cash Cows (Low Growth, High Market Share)
- 4.3.3. Question Mark (High Growth, Low Market Share)
- 4.3.4. Dogs (Low Growth, Low Market Share)
- 4.4. Ansoff Matrix Analysis
- 4.5. Supply Chain Analysis
- 4.6. Regulatory Landscape
- 4.7. Current Market Potential and Opportunity Assessment (TAM–SAM–SOM Framework)
- 4.8. TIR Analyst Note
- 4.1. Porters Five Forces
- 5. Market Analysis, Insights and Forecast 2021-2033
- 5.1. Market Analysis, Insights and Forecast - by Packaging Material Type
- 5.1.1. Plastic
- 5.1.2. Paper and Paperboard
- 5.1.3. Glass
- 5.1.4. Metal
- 5.1.5. Other Materials
- 5.2. Market Analysis, Insights and Forecast - by Product Type
- 5.2.1. Bottled Water
- 5.2.2. Carbonated Drinks
- 5.2.3. Juices
- 5.2.4. RTD Beverages
- 5.2.5. Sports Drinks
- 5.2.6. Other Product Types
- 5.3. Market Analysis, Insights and Forecast - by Geography
- 5.3.1. United States
- 5.3.2. Canada
- 5.4. Market Analysis, Insights and Forecast - by Region
- 5.4.1. United States
- 5.4.2. Canada
- 5.1. Market Analysis, Insights and Forecast - by Packaging Material Type
- 6. North America Soft Drinks Packaging Market Analysis, Insights and Forecast, 2021-2033
- 6.1. Market Analysis, Insights and Forecast - by Packaging Material Type
- 6.1.1. Plastic
- 6.1.2. Paper and Paperboard
- 6.1.3. Glass
- 6.1.4. Metal
- 6.1.5. Other Materials
- 6.2. Market Analysis, Insights and Forecast - by Product Type
- 6.2.1. Bottled Water
- 6.2.2. Carbonated Drinks
- 6.2.3. Juices
- 6.2.4. RTD Beverages
- 6.2.5. Sports Drinks
- 6.2.6. Other Product Types
- 6.3. Market Analysis, Insights and Forecast - by Geography
- 6.3.1. United States
- 6.3.2. Canada
- 6.1. Market Analysis, Insights and Forecast - by Packaging Material Type
- 7. United States North America Soft Drinks Packaging Market Analysis, Insights and Forecast, 2020-2032
- 7.1. Market Analysis, Insights and Forecast - by Packaging Material Type
- 7.1.1. Plastic
- 7.1.2. Paper and Paperboard
- 7.1.3. Glass
- 7.1.4. Metal
- 7.1.5. Other Materials
- 7.2. Market Analysis, Insights and Forecast - by Product Type
- 7.2.1. Bottled Water
- 7.2.2. Carbonated Drinks
- 7.2.3. Juices
- 7.2.4. RTD Beverages
- 7.2.5. Sports Drinks
- 7.2.6. Other Product Types
- 7.3. Market Analysis, Insights and Forecast - by Geography
- 7.3.1. United States
- 7.3.2. Canada
- 7.1. Market Analysis, Insights and Forecast - by Packaging Material Type
- 8. Canada North America Soft Drinks Packaging Market Analysis, Insights and Forecast, 2020-2032
- 8.1. Market Analysis, Insights and Forecast - by Packaging Material Type
- 8.1.1. Plastic
- 8.1.2. Paper and Paperboard
- 8.1.3. Glass
- 8.1.4. Metal
- 8.1.5. Other Materials
- 8.2. Market Analysis, Insights and Forecast - by Product Type
- 8.2.1. Bottled Water
- 8.2.2. Carbonated Drinks
- 8.2.3. Juices
- 8.2.4. RTD Beverages
- 8.2.5. Sports Drinks
- 8.2.6. Other Product Types
- 8.3. Market Analysis, Insights and Forecast - by Geography
- 8.3.1. United States
- 8.3.2. Canada
- 8.1. Market Analysis, Insights and Forecast - by Packaging Material Type
- 9. Competitive Analysis
- 9.1. Company Profiles
- 9.1.1 WestRock Company
- 9.1.1.1. Company Overview
- 9.1.1.2. Products
- 9.1.1.3. Company Financials
- 9.1.1.4. SWOT Analysis
- 9.1.2 CAN-PACK SA
- 9.1.2.1. Company Overview
- 9.1.2.2. Products
- 9.1.2.3. Company Financials
- 9.1.2.4. SWOT Analysis
- 9.1.3 SIG Combibloc Company Ltd
- 9.1.3.1. Company Overview
- 9.1.3.2. Products
- 9.1.3.3. Company Financials
- 9.1.3.4. SWOT Analysis
- 9.1.4 Ball Corporation
- 9.1.4.1. Company Overview
- 9.1.4.2. Products
- 9.1.4.3. Company Financials
- 9.1.4.4. SWOT Analysis
- 9.1.5 Ardagh Group SA
- 9.1.5.1. Company Overview
- 9.1.5.2. Products
- 9.1.5.3. Company Financials
- 9.1.5.4. SWOT Analysis
- 9.1.6 Alcoa Corporation*List Not Exhaustive
- 9.1.6.1. Company Overview
- 9.1.6.2. Products
- 9.1.6.3. Company Financials
- 9.1.6.4. SWOT Analysis
- 9.1.7 Crown Holdings Inc
- 9.1.7.1. Company Overview
- 9.1.7.2. Products
- 9.1.7.3. Company Financials
- 9.1.7.4. SWOT Analysis
- 9.1.8 Graham Packaging Company
- 9.1.8.1. Company Overview
- 9.1.8.2. Products
- 9.1.8.3. Company Financials
- 9.1.8.4. SWOT Analysis
- 9.1.9 Tetra Pak International
- 9.1.9.1. Company Overview
- 9.1.9.2. Products
- 9.1.9.3. Company Financials
- 9.1.9.4. SWOT Analysis
- 9.1.10 The Scoular Company
- 9.1.10.1. Company Overview
- 9.1.10.2. Products
- 9.1.10.3. Company Financials
- 9.1.10.4. SWOT Analysis
- 9.1.11 Toyo Seikan Group Holdings Ltd
- 9.1.11.1. Company Overview
- 9.1.11.2. Products
- 9.1.11.3. Company Financials
- 9.1.11.4. SWOT Analysis
- 9.1.12 Pactive LLC
- 9.1.12.1. Company Overview
- 9.1.12.2. Products
- 9.1.12.3. Company Financials
- 9.1.12.4. SWOT Analysis
- 9.1.13 Placon Corporation
- 9.1.13.1. Company Overview
- 9.1.13.2. Products
- 9.1.13.3. Company Financials
- 9.1.13.4. SWOT Analysis
- 9.1.14 Genpak LLC
- 9.1.14.1. Company Overview
- 9.1.14.2. Products
- 9.1.14.3. Company Financials
- 9.1.14.4. SWOT Analysis
- 9.1.15 Owens-Illinois Inc
- 9.1.15.1. Company Overview
- 9.1.15.2. Products
- 9.1.15.3. Company Financials
- 9.1.15.4. SWOT Analysis
- 9.1.16 Amcor Ltd
- 9.1.16.1. Company Overview
- 9.1.16.2. Products
- 9.1.16.3. Company Financials
- 9.1.16.4. SWOT Analysis
- 9.1.1 WestRock Company
- 9.2. Market Entropy
- 9.2.1 Company's Key Areas Served
- 9.2.2 Recent Developments
- 9.3. Company Market Share Analysis 2025
- 9.3.1 Top 5 Companies Market Share Analysis
- 9.3.2 Top 3 Companies Market Share Analysis
- 9.4. List of Potential Customers
- 10. Research Methodology
List of Figures
- Figure 1: North America Soft Drinks Packaging Market Revenue Breakdown (billion, %) by Product 2025 & 2033
- Figure 2: North America Soft Drinks Packaging Market Share (%) by Company 2025
List of Tables
- Table 1: North America Soft Drinks Packaging Market Revenue billion Forecast, by Packaging Material Type 2020 & 2033
- Table 2: North America Soft Drinks Packaging Market Revenue billion Forecast, by Product Type 2020 & 2033
- Table 3: North America Soft Drinks Packaging Market Revenue billion Forecast, by Geography 2020 & 2033
- Table 4: North America Soft Drinks Packaging Market Revenue billion Forecast, by Region 2020 & 2033
- Table 5: North America Soft Drinks Packaging Market Revenue billion Forecast, by Packaging Material Type 2020 & 2033
- Table 6: North America Soft Drinks Packaging Market Revenue billion Forecast, by Product Type 2020 & 2033
- Table 7: North America Soft Drinks Packaging Market Revenue billion Forecast, by Geography 2020 & 2033
- Table 8: North America Soft Drinks Packaging Market Revenue billion Forecast, by Country 2020 & 2033
- Table 9: North America Soft Drinks Packaging Market Revenue billion Forecast, by Packaging Material Type 2020 & 2033
- Table 10: North America Soft Drinks Packaging Market Revenue billion Forecast, by Product Type 2020 & 2033
- Table 11: North America Soft Drinks Packaging Market Revenue billion Forecast, by Geography 2020 & 2033
- Table 12: North America Soft Drinks Packaging Market Revenue billion Forecast, by Country 2020 & 2033
Frequently Asked Questions
1. What is the projected Compound Annual Growth Rate (CAGR) of the North America Soft Drinks Packaging Market?
The projected CAGR is approximately 6.57%.
2. Which companies are prominent players in the North America Soft Drinks Packaging Market?
Key companies in the market include WestRock Company, CAN-PACK SA, SIG Combibloc Company Ltd, Ball Corporation, Ardagh Group SA, Alcoa Corporation*List Not Exhaustive, Crown Holdings Inc, Graham Packaging Company, Tetra Pak International, The Scoular Company, Toyo Seikan Group Holdings Ltd, Pactive LLC, Placon Corporation, Genpak LLC, Owens-Illinois Inc, Amcor Ltd.
3. What are the main segments of the North America Soft Drinks Packaging Market?
The market segments include Packaging Material Type, Product Type, Geography.
4. Can you provide details about the market size?
The market size is estimated to be USD 42.16 billion as of 2022.
5. What are some drivers contributing to market growth?
Increasing Soft Drink Consumption; Increased Demand for Convenience Packaging from Consumers.
6. What are the notable trends driving market growth?
The RTD Beverages Segment is Expected to Hold a Significant Market Share.
7. Are there any restraints impacting market growth?
Environmental Concerns Regarding Usage of Plastic; Stringent Government Regulations.
8. Can you provide examples of recent developments in the market?
In May 2021, Ball Corporation announced the availability of the first-of-its-kind Ball Aluminum Cup for soft drinks at major retailers in all 50 states across the United States. The product was made available between May and June for the first time to more than 18,000 food, drug, and mass retailers, including Kroger, Target, Albertsons, CVS, and others. The nationwide retail rollout follows the success of a limited pilot that began in 2019. Since then, the cups have been available in select retailers, restaurants, and major sports and entertainment venues such as Ball Arena in Denver, SoFi Stadium in Inglewood, and Allegiant Stadium in Las Vegas.
9. What pricing options are available for accessing the report?
Pricing options include single-user, multi-user, and enterprise licenses priced at USD 4750, USD 5250, and USD 8750 respectively.
10. Is the market size provided in terms of value or volume?
The market size is provided in terms of value, measured in billion.
11. Are there any specific market keywords associated with the report?
Yes, the market keyword associated with the report is "North America Soft Drinks Packaging Market," which aids in identifying and referencing the specific market segment covered.
12. How do I determine which pricing option suits my needs best?
The pricing options vary based on user requirements and access needs. Individual users may opt for single-user licenses, while businesses requiring broader access may choose multi-user or enterprise licenses for cost-effective access to the report.
13. Are there any additional resources or data provided in the North America Soft Drinks Packaging Market report?
While the report offers comprehensive insights, it's advisable to review the specific contents or supplementary materials provided to ascertain if additional resources or data are available.
14. How can I stay updated on further developments or reports in the North America Soft Drinks Packaging Market?
To stay informed about further developments, trends, and reports in the North America Soft Drinks Packaging Market, consider subscribing to industry newsletters, following relevant companies and organizations, or regularly checking reputable industry news sources and publications.
Methodology
Step 1 - Identification of Relevant Samples Size from Population Database


Step 2 - Approaches for Defining Global Market Size (Value, Volume* & Price*)

Note*: In applicable scenarios
Step 3 - Data Sources
Primary Research
- Web Analytics
- Survey Reports
- Research Institute
- Latest Research Reports
- Opinion Leaders
Secondary Research
- Annual Reports
- White Paper
- Latest Press Release
- Industry Association
- Paid Database
- Investor Presentations

Step 4 - Data Triangulation
Involves using different sources of information in order to increase the validity of a study
These sources are likely to be stakeholders in a program - participants, other researchers, program staff, other community members, and so on.
Then we put all data in single framework & apply various statistical tools to find out the dynamic on the market.
During the analysis stage, feedback from the stakeholder groups would be compared to determine areas of agreement as well as areas of divergence