

Key Insights
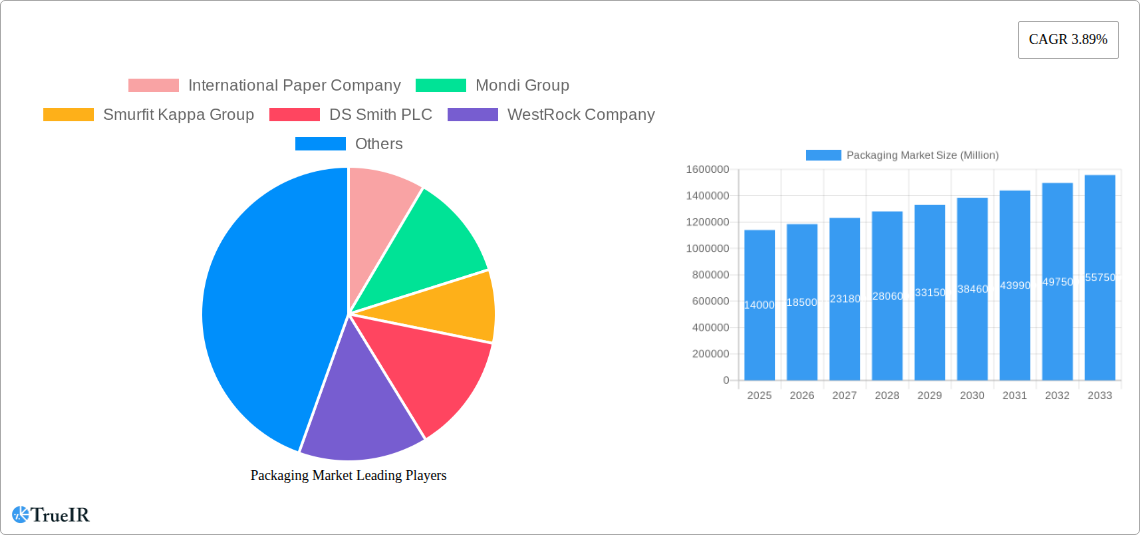
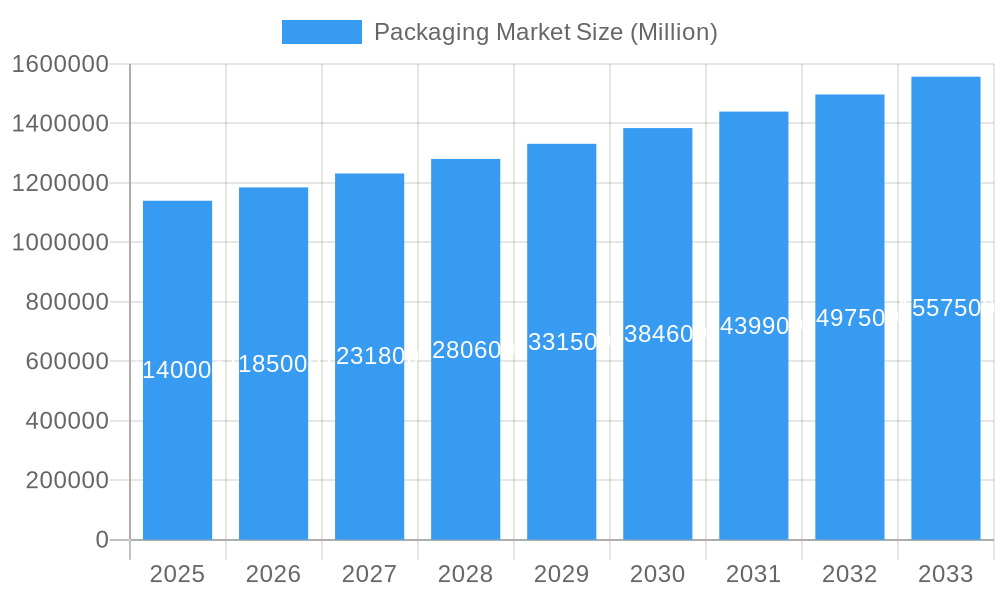
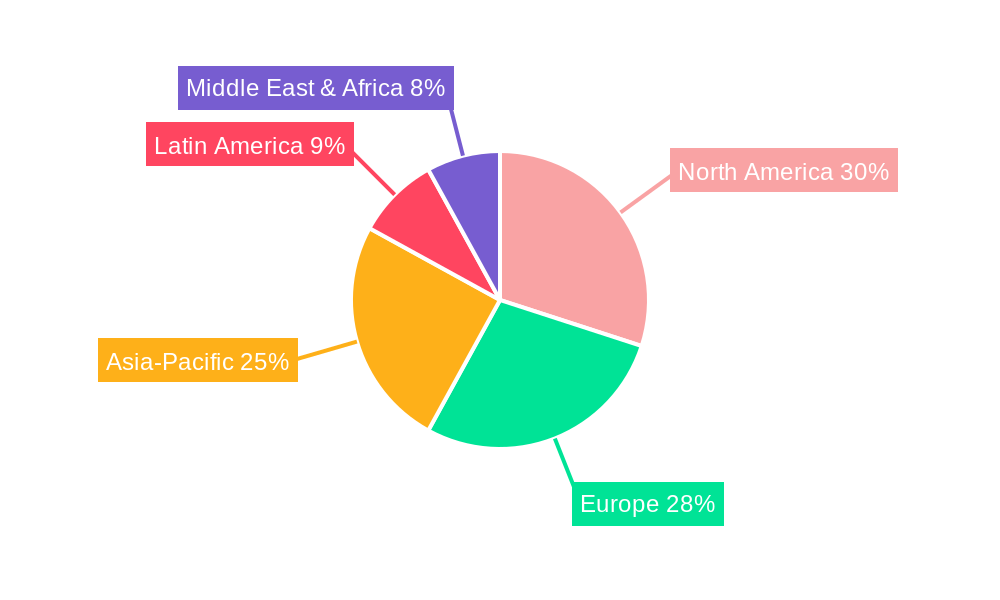
The global packaging market, valued at $1.14 trillion in 2025, is projected to experience robust growth, driven by several key factors. The rising e-commerce sector necessitates innovative and efficient packaging solutions for product protection and delivery. Furthermore, increasing consumer demand for convenient and sustainable packaging options, such as recyclable and biodegradable materials, is significantly shaping market trends. This shift towards eco-friendly practices is pushing manufacturers to invest in research and development of sustainable packaging alternatives, influencing material choices and production processes. Growth is further fueled by the expansion of the food and beverage industry, requiring advanced packaging to maintain product freshness and extend shelf life. However, fluctuations in raw material prices and stringent regulatory requirements regarding packaging waste management pose significant challenges to market growth. Competition amongst established players like International Paper, Mondi Group, and Smurfit Kappa, alongside emerging companies focusing on sustainable solutions, is intensifying. Regional variations exist, with North America and Europe currently holding substantial market share, but growth in developing economies presents significant future opportunities. The forecast period of 2025-2033 anticipates continued expansion at a compound annual growth rate (CAGR) of 3.89%, driven by the aforementioned factors, leading to substantial market expansion.
Packaging Market Market Size (In Million)
The projected growth of the packaging market is contingent upon several key factors. Continued advancements in packaging technology, specifically focusing on improved barrier properties, enhanced shelf life extension, and smart packaging features, will drive demand. Moreover, the rising focus on brand differentiation and attractive packaging designs to appeal to consumers plays a crucial role. The market's segmentation spans various packaging materials (paperboard, plastics, metals, etc.), packaging types (flexible, rigid, etc.), and end-use industries (food & beverage, pharmaceuticals, consumer goods, etc.). Companies are adapting their strategies to meet evolving consumer preferences and regulatory landscapes. This includes strategic partnerships, mergers and acquisitions, and increased investment in sustainable packaging solutions. The competitive landscape is dynamic, with both large multinational corporations and smaller specialized companies vying for market share. This competitive pressure fosters innovation and ensures a constant flow of improved and sustainable packaging options entering the market.
Packaging Market Company Market Share
Packaging Market: A Comprehensive Report (2019-2033)
This dynamic report provides a comprehensive analysis of the Packaging Market, offering invaluable insights for industry professionals, investors, and strategic decision-makers. The study period spans from 2019 to 2033, with 2025 serving as the base and estimated year. The report leverages extensive data analysis and expert insights to forecast market trends and growth opportunities until 2033. This detailed analysis covers market size, segmentation, competitive landscape, key players, and emerging trends, empowering you to navigate the complexities of this ever-evolving industry. The report value is estimated to be xx Million.
Packaging Market Market Structure & Competitive Landscape
The global packaging market exhibits a moderately concentrated structure, with a handful of multinational corporations holding significant market share. However, the presence of numerous smaller players, particularly in niche segments, fosters a dynamic competitive landscape. Innovation is a key driver, with companies investing heavily in R&D to develop sustainable, functional, and aesthetically pleasing packaging solutions. Regulatory pressures, particularly those focused on sustainability and recyclability, significantly impact market dynamics. The rise of e-commerce has fueled demand for protective and convenient packaging, while increasing consumer awareness of environmental concerns pushes the market towards eco-friendly alternatives. Mergers and acquisitions (M&A) activity remains robust, with larger players consolidating their market positions and expanding their product portfolios. The M&A volume in the last 5 years has averaged xx Million deals annually.
- Market Concentration: The top 5 players account for approximately xx% of the global market share (2024 data). Herfindahl-Hirschman Index (HHI) suggests a moderately concentrated market.
- Innovation Drivers: Sustainable materials (bioplastics, recycled content), smart packaging (RFID, sensors), and e-commerce-driven packaging innovations.
- Regulatory Impacts: Stricter regulations on plastic waste, recyclability standards, and labeling requirements are driving change.
- Product Substitutes: The growing popularity of reusable and refillable packaging presents a challenge to traditional disposable options.
- End-User Segmentation: Food and beverage, pharmaceuticals, cosmetics, electronics, and industrial goods represent key end-use sectors.
- M&A Trends: Strategic acquisitions are driven by expansion into new markets, technologies, and product categories.
Packaging Market Market Trends & Opportunities
The global packaging market is undergoing a significant transformation, characterized by dynamic growth and evolving consumer demands. Market size is projected to reach [Insert Future Market Size Here, e.g., $1.5 Trillion] by 2033, demonstrating a robust Compound Annual Growth Rate (CAGR) of approximately [Insert CAGR Here, e.g., 5.5%] during the forecast period (2025-2033). This expansion is propelled by advancements in materials science, leading to innovative and sustainable packaging solutions. Automation and digital printing technologies are revolutionizing the design, production, and personalization of packaging. A pivotal shift in consumer preferences towards eco-friendly and convenient packaging is reshaping product development and marketing strategies across industries. The competitive landscape is marked by intense innovation, strategic collaborations, and the emergence of agile players focused on circular economy principles. The adoption rate of sustainable packaging is on a steady upward trajectory, anticipated to reach [Insert Sustainable Packaging Penetration Rate Here, e.g., 70%] by 2033.
Dominant Markets & Segments in Packaging Market
The Asia-Pacific region currently commands a dominant position in the global packaging market. This leadership is largely attributed to rapid economic expansion, a burgeoning consumer base, and accelerated industrialization across key economies. Within this dynamic region, China and India stand out as primary engines of growth, influencing global packaging trends and demand.
-
Key Growth Drivers in Asia-Pacific:
- Accelerated urbanization coupled with a significant rise in disposable incomes.
- The exponential growth of the e-commerce sector, escalating the demand for protective and optimized packaging solutions.
- Proactive government initiatives and policies aimed at fostering the adoption and development of sustainable packaging.
- The robust expansion of the food processing, beverage, and manufacturing industries, necessitating advanced packaging.
-
Detailed Analysis: The pervasive dominance of Asia-Pacific in the packaging market is a result of a powerful confluence of factors. Its vast and expanding population, coupled with rapid industrialization, creates immense demand. The thriving e-commerce ecosystem further amplifies this need for efficient and secure packaging. Supportive government policies that prioritize economic development and infrastructure investment are instrumental in accelerating regional growth. Concurrently, increasing environmental awareness and evolving regulatory landscapes are prompting a significant shift towards more sustainable packaging practices within the region.
Packaging Market Product Analysis
Recent product innovations focus on sustainable materials, enhanced functionality, and improved aesthetics. The market is witnessing a surge in eco-friendly alternatives, such as biodegradable plastics, compostable packaging, and recycled content packaging. Technological advancements in printing and labeling techniques are also enhancing packaging designs and providing greater branding opportunities. The market fit of these innovations depends on their cost-effectiveness, performance, and consumer acceptance.
Key Drivers, Barriers & Challenges in Packaging Market
Key Drivers: The packaging market is significantly propelled by escalating demand from the food & beverage, pharmaceutical, and e-commerce sectors. Growing consumer inclination towards convenient, safe, and sustainable packaging solutions plays a crucial role. Continuous technological advancements in packaging materials, smart packaging technologies, and manufacturing processes are key enablers. Furthermore, supportive government regulations and global initiatives promoting circular economy principles and sustainable packaging practices are powerful drivers.
Key Challenges and Restraints: The market faces persistent challenges including volatile raw material prices, geopolitical influences on supply chains, and increasingly stringent environmental regulations. Intense competition necessitates continuous innovation and operational efficiency. Adapting to evolving consumer demands for personalization and functionality while meeting ambitious sustainability goals presents a significant hurdle. The impact of recent global supply chain disruptions has led to a substantial increase in packaging costs, estimated at around [Insert Percentage Here, e.g., 15-20%] in the past year.
Growth Drivers in the Packaging Market Market
The packaging market is propelled by several key drivers: rising consumer demand for convenient and sustainable packaging, technological advancements leading to innovative packaging solutions, and supportive government regulations promoting sustainable and eco-friendly alternatives.
Challenges Impacting Packaging Market Growth
The packaging market navigates several significant challenges that can impact its growth trajectory. These include the volatility of raw material prices, which can affect profitability and product pricing strategies. Complex and often fragile supply chains require robust management and contingency planning. Increasing regulatory scrutiny, particularly concerning environmental impact and material sourcing, necessitates constant adaptation and compliance. Intense competition across various segments demands continuous innovation, cost optimization, and a strong focus on differentiation. To remain competitive and resilient, businesses are compelled to adopt agile strategies, invest in cutting-edge technologies, and embed sustainability at the core of their operations.
Key Players Shaping the Packaging Market Market
- International Paper Company
- Mondi Group
- Smurfit Kappa Group
- DS Smith PLC
- WestRock Company
- UFlex Limited
- Huhtamaki Oyj
- Amcor Group GmbH
- Coveris Holding SA
- Sealed Air Corporation
- Greif Inc
- Sonoco Products Company
- Aptar Group Inc
- Berry Global Group Inc
- Alpla Group
- Owens-illinois Inc
- Vidrala S A
- Verallia SA
- Gerresheimer AG
- Vitro S A B De C V
- Ball Corporation
- Crown Holdings Inc
- Ardagh Group S A
- Can Pack SA
- Silgan Holdings Inc
Significant Packaging Market Industry Milestones
- June 2024: Sonoco Products Company's USD 3.9 Billion acquisition of Eviosys significantly expands its presence in the European food can market.
- May 2024: Mondi's USD 216.45 Million investment in a recycled containerboard machine in Italy underscores the industry's shift towards sustainable practices.
- April 2024: The UK's launch of CiPPPA highlights the growing focus on pharmaceutical packaging recycling and circularity.
- April 2024: Berry Global's 30% production capacity increase in Europe reflects the strong demand for healthcare packaging solutions.
Future Outlook for Packaging Market Market
The packaging market is poised for continued growth, driven by ongoing technological advancements, evolving consumer preferences, and the increasing importance of sustainability. Strategic opportunities exist for companies that can innovate in sustainable materials, develop smart packaging solutions, and effectively manage supply chain complexities. The market’s potential is substantial, with significant growth anticipated across various segments and regions.
Packaging Market Segmentation
- 1. Production Analysis
- 2. Consumption Analysis
- 3. Import Market Analysis (Value & Volume)
- 4. Export Market Analysis (Value & Volume)
- 5. Price Trend Analysis
Packaging Market Segmentation By Geography
-
1. North America
- 1.1. United States
- 1.2. Canada
- 1.3. Mexico
-
2. South America
- 2.1. Brazil
- 2.2. Argentina
- 2.3. Rest of South America
-
3. Europe
- 3.1. United Kingdom
- 3.2. Germany
- 3.3. France
- 3.4. Italy
- 3.5. Spain
- 3.6. Russia
- 3.7. Benelux
- 3.8. Nordics
- 3.9. Rest of Europe
-
4. Middle East & Africa
- 4.1. Turkey
- 4.2. Israel
- 4.3. GCC
- 4.4. North Africa
- 4.5. South Africa
- 4.6. Rest of Middle East & Africa
-
5. Asia Pacific
- 5.1. China
- 5.2. India
- 5.3. Japan
- 5.4. South Korea
- 5.5. ASEAN
- 5.6. Oceania
- 5.7. Rest of Asia Pacific
Packaging Market Regional Market Share
Geographic Coverage of Packaging Market
Packaging Market REPORT HIGHLIGHTS
| Aspects | Details |
|---|---|
| Study Period | 2020-2034 |
| Base Year | 2025 |
| Estimated Year | 2026 |
| Forecast Period | 2026-2034 |
| Historical Period | 2020-2025 |
| Growth Rate | CAGR of 3.89% from 2020-2034 |
| Segmentation |
|
Table of Contents
- 1. Introduction
- 1.1. Research Scope
- 1.2. Market Segmentation
- 1.3. Research Objective
- 1.4. Definitions and Assumptions
- 2. Executive Summary
- 2.1. Market Snapshot
- 3. Market Dynamics
- 3.1. Market Drivers
- 3.2. Market Restrains
- 3.3. Market Trends
- 3.4. Market Opportunities
- 4. Market Factor Analysis
- 4.1. Porters Five Forces
- 4.1.1. Bargaining Power of Suppliers
- 4.1.2. Bargaining Power of Buyers
- 4.1.3. Threat of New Entrants
- 4.1.4. Threat of Substitutes
- 4.1.5. Competitive Rivalry
- 4.2. PESTEL analysis
- 4.3. BCG Analysis
- 4.3.1. Stars (High Growth, High Market Share)
- 4.3.2. Cash Cows (Low Growth, High Market Share)
- 4.3.3. Question Mark (High Growth, Low Market Share)
- 4.3.4. Dogs (Low Growth, Low Market Share)
- 4.4. Ansoff Matrix Analysis
- 4.5. Supply Chain Analysis
- 4.6. Regulatory Landscape
- 4.7. Current Market Potential and Opportunity Assessment (TAM–SAM–SOM Framework)
- 4.8. TIR Analyst Note
- 4.1. Porters Five Forces
- 5. Market Analysis, Insights and Forecast 2021-2033
- 5.1. Market Analysis, Insights and Forecast - by Production Analysis
- 5.2. Market Analysis, Insights and Forecast - by Consumption Analysis
- 5.3. Market Analysis, Insights and Forecast - by Import Market Analysis (Value & Volume)
- 5.4. Market Analysis, Insights and Forecast - by Export Market Analysis (Value & Volume)
- 5.5. Market Analysis, Insights and Forecast - by Price Trend Analysis
- 5.6. Market Analysis, Insights and Forecast - by Region
- 5.6.1. North America
- 5.6.2. South America
- 5.6.3. Europe
- 5.6.4. Middle East & Africa
- 5.6.5. Asia Pacific
- 6. Global Packaging Market Analysis, Insights and Forecast, 2021-2033
- 6.1. Market Analysis, Insights and Forecast - by Production Analysis
- 6.2. Market Analysis, Insights and Forecast - by Consumption Analysis
- 6.3. Market Analysis, Insights and Forecast - by Import Market Analysis (Value & Volume)
- 6.4. Market Analysis, Insights and Forecast - by Export Market Analysis (Value & Volume)
- 6.5. Market Analysis, Insights and Forecast - by Price Trend Analysis
- 7. North America Packaging Market Analysis, Insights and Forecast, 2020-2032
- 7.1. Market Analysis, Insights and Forecast - by Production Analysis
- 7.2. Market Analysis, Insights and Forecast - by Consumption Analysis
- 7.3. Market Analysis, Insights and Forecast - by Import Market Analysis (Value & Volume)
- 7.4. Market Analysis, Insights and Forecast - by Export Market Analysis (Value & Volume)
- 7.5. Market Analysis, Insights and Forecast - by Price Trend Analysis
- 8. South America Packaging Market Analysis, Insights and Forecast, 2020-2032
- 8.1. Market Analysis, Insights and Forecast - by Production Analysis
- 8.2. Market Analysis, Insights and Forecast - by Consumption Analysis
- 8.3. Market Analysis, Insights and Forecast - by Import Market Analysis (Value & Volume)
- 8.4. Market Analysis, Insights and Forecast - by Export Market Analysis (Value & Volume)
- 8.5. Market Analysis, Insights and Forecast - by Price Trend Analysis
- 9. Europe Packaging Market Analysis, Insights and Forecast, 2020-2032
- 9.1. Market Analysis, Insights and Forecast - by Production Analysis
- 9.2. Market Analysis, Insights and Forecast - by Consumption Analysis
- 9.3. Market Analysis, Insights and Forecast - by Import Market Analysis (Value & Volume)
- 9.4. Market Analysis, Insights and Forecast - by Export Market Analysis (Value & Volume)
- 9.5. Market Analysis, Insights and Forecast - by Price Trend Analysis
- 10. Middle East & Africa Packaging Market Analysis, Insights and Forecast, 2020-2032
- 10.1. Market Analysis, Insights and Forecast - by Production Analysis
- 10.2. Market Analysis, Insights and Forecast - by Consumption Analysis
- 10.3. Market Analysis, Insights and Forecast - by Import Market Analysis (Value & Volume)
- 10.4. Market Analysis, Insights and Forecast - by Export Market Analysis (Value & Volume)
- 10.5. Market Analysis, Insights and Forecast - by Price Trend Analysis
- 11. Asia Pacific Packaging Market Analysis, Insights and Forecast, 2020-2032
- 11.1. Market Analysis, Insights and Forecast - by Production Analysis
- 11.2. Market Analysis, Insights and Forecast - by Consumption Analysis
- 11.3. Market Analysis, Insights and Forecast - by Import Market Analysis (Value & Volume)
- 11.4. Market Analysis, Insights and Forecast - by Export Market Analysis (Value & Volume)
- 11.5. Market Analysis, Insights and Forecast - by Price Trend Analysis
- 12. Competitive Analysis
- 12.1. Company Profiles
- 12.1.1 International Paper Company
- 12.1.1.1. Company Overview
- 12.1.1.2. Products
- 12.1.1.3. Company Financials
- 12.1.1.4. SWOT Analysis
- 12.1.2 Mondi Group
- 12.1.2.1. Company Overview
- 12.1.2.2. Products
- 12.1.2.3. Company Financials
- 12.1.2.4. SWOT Analysis
- 12.1.3 Smurfit Kappa Group
- 12.1.3.1. Company Overview
- 12.1.3.2. Products
- 12.1.3.3. Company Financials
- 12.1.3.4. SWOT Analysis
- 12.1.4 DS Smith PLC
- 12.1.4.1. Company Overview
- 12.1.4.2. Products
- 12.1.4.3. Company Financials
- 12.1.4.4. SWOT Analysis
- 12.1.5 WestRock Company
- 12.1.5.1. Company Overview
- 12.1.5.2. Products
- 12.1.5.3. Company Financials
- 12.1.5.4. SWOT Analysis
- 12.1.6 UFlex Limited
- 12.1.6.1. Company Overview
- 12.1.6.2. Products
- 12.1.6.3. Company Financials
- 12.1.6.4. SWOT Analysis
- 12.1.7 Huhtamaki Oyj
- 12.1.7.1. Company Overview
- 12.1.7.2. Products
- 12.1.7.3. Company Financials
- 12.1.7.4. SWOT Analysis
- 12.1.8 Amcor Group GmbH
- 12.1.8.1. Company Overview
- 12.1.8.2. Products
- 12.1.8.3. Company Financials
- 12.1.8.4. SWOT Analysis
- 12.1.9 Coveris Holding SA
- 12.1.9.1. Company Overview
- 12.1.9.2. Products
- 12.1.9.3. Company Financials
- 12.1.9.4. SWOT Analysis
- 12.1.10 Sealed Air Corporation
- 12.1.10.1. Company Overview
- 12.1.10.2. Products
- 12.1.10.3. Company Financials
- 12.1.10.4. SWOT Analysis
- 12.1.11 Greif Inc
- 12.1.11.1. Company Overview
- 12.1.11.2. Products
- 12.1.11.3. Company Financials
- 12.1.11.4. SWOT Analysis
- 12.1.12 Sonoco Products Company
- 12.1.12.1. Company Overview
- 12.1.12.2. Products
- 12.1.12.3. Company Financials
- 12.1.12.4. SWOT Analysis
- 12.1.13 Aptar Group Inc
- 12.1.13.1. Company Overview
- 12.1.13.2. Products
- 12.1.13.3. Company Financials
- 12.1.13.4. SWOT Analysis
- 12.1.14 Berry Global Group Inc
- 12.1.14.1. Company Overview
- 12.1.14.2. Products
- 12.1.14.3. Company Financials
- 12.1.14.4. SWOT Analysis
- 12.1.15 Alpla Group
- 12.1.15.1. Company Overview
- 12.1.15.2. Products
- 12.1.15.3. Company Financials
- 12.1.15.4. SWOT Analysis
- 12.1.16 Owens-illinois Inc
- 12.1.16.1. Company Overview
- 12.1.16.2. Products
- 12.1.16.3. Company Financials
- 12.1.16.4. SWOT Analysis
- 12.1.17 Vidrala S A
- 12.1.17.1. Company Overview
- 12.1.17.2. Products
- 12.1.17.3. Company Financials
- 12.1.17.4. SWOT Analysis
- 12.1.18 Verallia SA
- 12.1.18.1. Company Overview
- 12.1.18.2. Products
- 12.1.18.3. Company Financials
- 12.1.18.4. SWOT Analysis
- 12.1.19 Gerresheimer AG
- 12.1.19.1. Company Overview
- 12.1.19.2. Products
- 12.1.19.3. Company Financials
- 12.1.19.4. SWOT Analysis
- 12.1.20 Vitro S A B De C V
- 12.1.20.1. Company Overview
- 12.1.20.2. Products
- 12.1.20.3. Company Financials
- 12.1.20.4. SWOT Analysis
- 12.1.21 Ball Corporation
- 12.1.21.1. Company Overview
- 12.1.21.2. Products
- 12.1.21.3. Company Financials
- 12.1.21.4. SWOT Analysis
- 12.1.22 Crown Holdings Inc
- 12.1.22.1. Company Overview
- 12.1.22.2. Products
- 12.1.22.3. Company Financials
- 12.1.22.4. SWOT Analysis
- 12.1.23 Ardagh Group S A
- 12.1.23.1. Company Overview
- 12.1.23.2. Products
- 12.1.23.3. Company Financials
- 12.1.23.4. SWOT Analysis
- 12.1.24 Can Pack SA
- 12.1.24.1. Company Overview
- 12.1.24.2. Products
- 12.1.24.3. Company Financials
- 12.1.24.4. SWOT Analysis
- 12.1.25 Silgan Holdings Inc
- 12.1.25.1. Company Overview
- 12.1.25.2. Products
- 12.1.25.3. Company Financials
- 12.1.25.4. SWOT Analysis
- 12.1.1 International Paper Company
- 12.2. Market Entropy
- 12.2.1 Company's Key Areas Served
- 12.2.2 Recent Developments
- 12.3. Company Market Share Analysis 2025
- 12.3.1 Top 5 Companies Market Share Analysis
- 12.3.2 Top 3 Companies Market Share Analysis
- 12.4. List of Potential Customers
- 13. Research Methodology
List of Figures
- Figure 1: Global Packaging Market Revenue Breakdown (Million, %) by Region 2025 & 2033
- Figure 2: Global Packaging Market Volume Breakdown (Trillion, %) by Region 2025 & 2033
- Figure 3: North America Packaging Market Revenue (Million), by Production Analysis 2025 & 2033
- Figure 4: North America Packaging Market Volume (Trillion), by Production Analysis 2025 & 2033
- Figure 5: North America Packaging Market Revenue Share (%), by Production Analysis 2025 & 2033
- Figure 6: North America Packaging Market Volume Share (%), by Production Analysis 2025 & 2033
- Figure 7: North America Packaging Market Revenue (Million), by Consumption Analysis 2025 & 2033
- Figure 8: North America Packaging Market Volume (Trillion), by Consumption Analysis 2025 & 2033
- Figure 9: North America Packaging Market Revenue Share (%), by Consumption Analysis 2025 & 2033
- Figure 10: North America Packaging Market Volume Share (%), by Consumption Analysis 2025 & 2033
- Figure 11: North America Packaging Market Revenue (Million), by Import Market Analysis (Value & Volume) 2025 & 2033
- Figure 12: North America Packaging Market Volume (Trillion), by Import Market Analysis (Value & Volume) 2025 & 2033
- Figure 13: North America Packaging Market Revenue Share (%), by Import Market Analysis (Value & Volume) 2025 & 2033
- Figure 14: North America Packaging Market Volume Share (%), by Import Market Analysis (Value & Volume) 2025 & 2033
- Figure 15: North America Packaging Market Revenue (Million), by Export Market Analysis (Value & Volume) 2025 & 2033
- Figure 16: North America Packaging Market Volume (Trillion), by Export Market Analysis (Value & Volume) 2025 & 2033
- Figure 17: North America Packaging Market Revenue Share (%), by Export Market Analysis (Value & Volume) 2025 & 2033
- Figure 18: North America Packaging Market Volume Share (%), by Export Market Analysis (Value & Volume) 2025 & 2033
- Figure 19: North America Packaging Market Revenue (Million), by Price Trend Analysis 2025 & 2033
- Figure 20: North America Packaging Market Volume (Trillion), by Price Trend Analysis 2025 & 2033
- Figure 21: North America Packaging Market Revenue Share (%), by Price Trend Analysis 2025 & 2033
- Figure 22: North America Packaging Market Volume Share (%), by Price Trend Analysis 2025 & 2033
- Figure 23: North America Packaging Market Revenue (Million), by Country 2025 & 2033
- Figure 24: North America Packaging Market Volume (Trillion), by Country 2025 & 2033
- Figure 25: North America Packaging Market Revenue Share (%), by Country 2025 & 2033
- Figure 26: North America Packaging Market Volume Share (%), by Country 2025 & 2033
- Figure 27: South America Packaging Market Revenue (Million), by Production Analysis 2025 & 2033
- Figure 28: South America Packaging Market Volume (Trillion), by Production Analysis 2025 & 2033
- Figure 29: South America Packaging Market Revenue Share (%), by Production Analysis 2025 & 2033
- Figure 30: South America Packaging Market Volume Share (%), by Production Analysis 2025 & 2033
- Figure 31: South America Packaging Market Revenue (Million), by Consumption Analysis 2025 & 2033
- Figure 32: South America Packaging Market Volume (Trillion), by Consumption Analysis 2025 & 2033
- Figure 33: South America Packaging Market Revenue Share (%), by Consumption Analysis 2025 & 2033
- Figure 34: South America Packaging Market Volume Share (%), by Consumption Analysis 2025 & 2033
- Figure 35: South America Packaging Market Revenue (Million), by Import Market Analysis (Value & Volume) 2025 & 2033
- Figure 36: South America Packaging Market Volume (Trillion), by Import Market Analysis (Value & Volume) 2025 & 2033
- Figure 37: South America Packaging Market Revenue Share (%), by Import Market Analysis (Value & Volume) 2025 & 2033
- Figure 38: South America Packaging Market Volume Share (%), by Import Market Analysis (Value & Volume) 2025 & 2033
- Figure 39: South America Packaging Market Revenue (Million), by Export Market Analysis (Value & Volume) 2025 & 2033
- Figure 40: South America Packaging Market Volume (Trillion), by Export Market Analysis (Value & Volume) 2025 & 2033
- Figure 41: South America Packaging Market Revenue Share (%), by Export Market Analysis (Value & Volume) 2025 & 2033
- Figure 42: South America Packaging Market Volume Share (%), by Export Market Analysis (Value & Volume) 2025 & 2033
- Figure 43: South America Packaging Market Revenue (Million), by Price Trend Analysis 2025 & 2033
- Figure 44: South America Packaging Market Volume (Trillion), by Price Trend Analysis 2025 & 2033
- Figure 45: South America Packaging Market Revenue Share (%), by Price Trend Analysis 2025 & 2033
- Figure 46: South America Packaging Market Volume Share (%), by Price Trend Analysis 2025 & 2033
- Figure 47: South America Packaging Market Revenue (Million), by Country 2025 & 2033
- Figure 48: South America Packaging Market Volume (Trillion), by Country 2025 & 2033
- Figure 49: South America Packaging Market Revenue Share (%), by Country 2025 & 2033
- Figure 50: South America Packaging Market Volume Share (%), by Country 2025 & 2033
- Figure 51: Europe Packaging Market Revenue (Million), by Production Analysis 2025 & 2033
- Figure 52: Europe Packaging Market Volume (Trillion), by Production Analysis 2025 & 2033
- Figure 53: Europe Packaging Market Revenue Share (%), by Production Analysis 2025 & 2033
- Figure 54: Europe Packaging Market Volume Share (%), by Production Analysis 2025 & 2033
- Figure 55: Europe Packaging Market Revenue (Million), by Consumption Analysis 2025 & 2033
- Figure 56: Europe Packaging Market Volume (Trillion), by Consumption Analysis 2025 & 2033
- Figure 57: Europe Packaging Market Revenue Share (%), by Consumption Analysis 2025 & 2033
- Figure 58: Europe Packaging Market Volume Share (%), by Consumption Analysis 2025 & 2033
- Figure 59: Europe Packaging Market Revenue (Million), by Import Market Analysis (Value & Volume) 2025 & 2033
- Figure 60: Europe Packaging Market Volume (Trillion), by Import Market Analysis (Value & Volume) 2025 & 2033
- Figure 61: Europe Packaging Market Revenue Share (%), by Import Market Analysis (Value & Volume) 2025 & 2033
- Figure 62: Europe Packaging Market Volume Share (%), by Import Market Analysis (Value & Volume) 2025 & 2033
- Figure 63: Europe Packaging Market Revenue (Million), by Export Market Analysis (Value & Volume) 2025 & 2033
- Figure 64: Europe Packaging Market Volume (Trillion), by Export Market Analysis (Value & Volume) 2025 & 2033
- Figure 65: Europe Packaging Market Revenue Share (%), by Export Market Analysis (Value & Volume) 2025 & 2033
- Figure 66: Europe Packaging Market Volume Share (%), by Export Market Analysis (Value & Volume) 2025 & 2033
- Figure 67: Europe Packaging Market Revenue (Million), by Price Trend Analysis 2025 & 2033
- Figure 68: Europe Packaging Market Volume (Trillion), by Price Trend Analysis 2025 & 2033
- Figure 69: Europe Packaging Market Revenue Share (%), by Price Trend Analysis 2025 & 2033
- Figure 70: Europe Packaging Market Volume Share (%), by Price Trend Analysis 2025 & 2033
- Figure 71: Europe Packaging Market Revenue (Million), by Country 2025 & 2033
- Figure 72: Europe Packaging Market Volume (Trillion), by Country 2025 & 2033
- Figure 73: Europe Packaging Market Revenue Share (%), by Country 2025 & 2033
- Figure 74: Europe Packaging Market Volume Share (%), by Country 2025 & 2033
- Figure 75: Middle East & Africa Packaging Market Revenue (Million), by Production Analysis 2025 & 2033
- Figure 76: Middle East & Africa Packaging Market Volume (Trillion), by Production Analysis 2025 & 2033
- Figure 77: Middle East & Africa Packaging Market Revenue Share (%), by Production Analysis 2025 & 2033
- Figure 78: Middle East & Africa Packaging Market Volume Share (%), by Production Analysis 2025 & 2033
- Figure 79: Middle East & Africa Packaging Market Revenue (Million), by Consumption Analysis 2025 & 2033
- Figure 80: Middle East & Africa Packaging Market Volume (Trillion), by Consumption Analysis 2025 & 2033
- Figure 81: Middle East & Africa Packaging Market Revenue Share (%), by Consumption Analysis 2025 & 2033
- Figure 82: Middle East & Africa Packaging Market Volume Share (%), by Consumption Analysis 2025 & 2033
- Figure 83: Middle East & Africa Packaging Market Revenue (Million), by Import Market Analysis (Value & Volume) 2025 & 2033
- Figure 84: Middle East & Africa Packaging Market Volume (Trillion), by Import Market Analysis (Value & Volume) 2025 & 2033
- Figure 85: Middle East & Africa Packaging Market Revenue Share (%), by Import Market Analysis (Value & Volume) 2025 & 2033
- Figure 86: Middle East & Africa Packaging Market Volume Share (%), by Import Market Analysis (Value & Volume) 2025 & 2033
- Figure 87: Middle East & Africa Packaging Market Revenue (Million), by Export Market Analysis (Value & Volume) 2025 & 2033
- Figure 88: Middle East & Africa Packaging Market Volume (Trillion), by Export Market Analysis (Value & Volume) 2025 & 2033
- Figure 89: Middle East & Africa Packaging Market Revenue Share (%), by Export Market Analysis (Value & Volume) 2025 & 2033
- Figure 90: Middle East & Africa Packaging Market Volume Share (%), by Export Market Analysis (Value & Volume) 2025 & 2033
- Figure 91: Middle East & Africa Packaging Market Revenue (Million), by Price Trend Analysis 2025 & 2033
- Figure 92: Middle East & Africa Packaging Market Volume (Trillion), by Price Trend Analysis 2025 & 2033
- Figure 93: Middle East & Africa Packaging Market Revenue Share (%), by Price Trend Analysis 2025 & 2033
- Figure 94: Middle East & Africa Packaging Market Volume Share (%), by Price Trend Analysis 2025 & 2033
- Figure 95: Middle East & Africa Packaging Market Revenue (Million), by Country 2025 & 2033
- Figure 96: Middle East & Africa Packaging Market Volume (Trillion), by Country 2025 & 2033
- Figure 97: Middle East & Africa Packaging Market Revenue Share (%), by Country 2025 & 2033
- Figure 98: Middle East & Africa Packaging Market Volume Share (%), by Country 2025 & 2033
- Figure 99: Asia Pacific Packaging Market Revenue (Million), by Production Analysis 2025 & 2033
- Figure 100: Asia Pacific Packaging Market Volume (Trillion), by Production Analysis 2025 & 2033
- Figure 101: Asia Pacific Packaging Market Revenue Share (%), by Production Analysis 2025 & 2033
- Figure 102: Asia Pacific Packaging Market Volume Share (%), by Production Analysis 2025 & 2033
- Figure 103: Asia Pacific Packaging Market Revenue (Million), by Consumption Analysis 2025 & 2033
- Figure 104: Asia Pacific Packaging Market Volume (Trillion), by Consumption Analysis 2025 & 2033
- Figure 105: Asia Pacific Packaging Market Revenue Share (%), by Consumption Analysis 2025 & 2033
- Figure 106: Asia Pacific Packaging Market Volume Share (%), by Consumption Analysis 2025 & 2033
- Figure 107: Asia Pacific Packaging Market Revenue (Million), by Import Market Analysis (Value & Volume) 2025 & 2033
- Figure 108: Asia Pacific Packaging Market Volume (Trillion), by Import Market Analysis (Value & Volume) 2025 & 2033
- Figure 109: Asia Pacific Packaging Market Revenue Share (%), by Import Market Analysis (Value & Volume) 2025 & 2033
- Figure 110: Asia Pacific Packaging Market Volume Share (%), by Import Market Analysis (Value & Volume) 2025 & 2033
- Figure 111: Asia Pacific Packaging Market Revenue (Million), by Export Market Analysis (Value & Volume) 2025 & 2033
- Figure 112: Asia Pacific Packaging Market Volume (Trillion), by Export Market Analysis (Value & Volume) 2025 & 2033
- Figure 113: Asia Pacific Packaging Market Revenue Share (%), by Export Market Analysis (Value & Volume) 2025 & 2033
- Figure 114: Asia Pacific Packaging Market Volume Share (%), by Export Market Analysis (Value & Volume) 2025 & 2033
- Figure 115: Asia Pacific Packaging Market Revenue (Million), by Price Trend Analysis 2025 & 2033
- Figure 116: Asia Pacific Packaging Market Volume (Trillion), by Price Trend Analysis 2025 & 2033
- Figure 117: Asia Pacific Packaging Market Revenue Share (%), by Price Trend Analysis 2025 & 2033
- Figure 118: Asia Pacific Packaging Market Volume Share (%), by Price Trend Analysis 2025 & 2033
- Figure 119: Asia Pacific Packaging Market Revenue (Million), by Country 2025 & 2033
- Figure 120: Asia Pacific Packaging Market Volume (Trillion), by Country 2025 & 2033
- Figure 121: Asia Pacific Packaging Market Revenue Share (%), by Country 2025 & 2033
- Figure 122: Asia Pacific Packaging Market Volume Share (%), by Country 2025 & 2033
List of Tables
- Table 1: Global Packaging Market Revenue Million Forecast, by Production Analysis 2020 & 2033
- Table 2: Global Packaging Market Volume Trillion Forecast, by Production Analysis 2020 & 2033
- Table 3: Global Packaging Market Revenue Million Forecast, by Consumption Analysis 2020 & 2033
- Table 4: Global Packaging Market Volume Trillion Forecast, by Consumption Analysis 2020 & 2033
- Table 5: Global Packaging Market Revenue Million Forecast, by Import Market Analysis (Value & Volume) 2020 & 2033
- Table 6: Global Packaging Market Volume Trillion Forecast, by Import Market Analysis (Value & Volume) 2020 & 2033
- Table 7: Global Packaging Market Revenue Million Forecast, by Export Market Analysis (Value & Volume) 2020 & 2033
- Table 8: Global Packaging Market Volume Trillion Forecast, by Export Market Analysis (Value & Volume) 2020 & 2033
- Table 9: Global Packaging Market Revenue Million Forecast, by Price Trend Analysis 2020 & 2033
- Table 10: Global Packaging Market Volume Trillion Forecast, by Price Trend Analysis 2020 & 2033
- Table 11: Global Packaging Market Revenue Million Forecast, by Region 2020 & 2033
- Table 12: Global Packaging Market Volume Trillion Forecast, by Region 2020 & 2033
- Table 13: Global Packaging Market Revenue Million Forecast, by Production Analysis 2020 & 2033
- Table 14: Global Packaging Market Volume Trillion Forecast, by Production Analysis 2020 & 2033
- Table 15: Global Packaging Market Revenue Million Forecast, by Consumption Analysis 2020 & 2033
- Table 16: Global Packaging Market Volume Trillion Forecast, by Consumption Analysis 2020 & 2033
- Table 17: Global Packaging Market Revenue Million Forecast, by Import Market Analysis (Value & Volume) 2020 & 2033
- Table 18: Global Packaging Market Volume Trillion Forecast, by Import Market Analysis (Value & Volume) 2020 & 2033
- Table 19: Global Packaging Market Revenue Million Forecast, by Export Market Analysis (Value & Volume) 2020 & 2033
- Table 20: Global Packaging Market Volume Trillion Forecast, by Export Market Analysis (Value & Volume) 2020 & 2033
- Table 21: Global Packaging Market Revenue Million Forecast, by Price Trend Analysis 2020 & 2033
- Table 22: Global Packaging Market Volume Trillion Forecast, by Price Trend Analysis 2020 & 2033
- Table 23: Global Packaging Market Revenue Million Forecast, by Country 2020 & 2033
- Table 24: Global Packaging Market Volume Trillion Forecast, by Country 2020 & 2033
- Table 25: United States Packaging Market Revenue (Million) Forecast, by Application 2020 & 2033
- Table 26: United States Packaging Market Volume (Trillion) Forecast, by Application 2020 & 2033
- Table 27: Canada Packaging Market Revenue (Million) Forecast, by Application 2020 & 2033
- Table 28: Canada Packaging Market Volume (Trillion) Forecast, by Application 2020 & 2033
- Table 29: Mexico Packaging Market Revenue (Million) Forecast, by Application 2020 & 2033
- Table 30: Mexico Packaging Market Volume (Trillion) Forecast, by Application 2020 & 2033
- Table 31: Global Packaging Market Revenue Million Forecast, by Production Analysis 2020 & 2033
- Table 32: Global Packaging Market Volume Trillion Forecast, by Production Analysis 2020 & 2033
- Table 33: Global Packaging Market Revenue Million Forecast, by Consumption Analysis 2020 & 2033
- Table 34: Global Packaging Market Volume Trillion Forecast, by Consumption Analysis 2020 & 2033
- Table 35: Global Packaging Market Revenue Million Forecast, by Import Market Analysis (Value & Volume) 2020 & 2033
- Table 36: Global Packaging Market Volume Trillion Forecast, by Import Market Analysis (Value & Volume) 2020 & 2033
- Table 37: Global Packaging Market Revenue Million Forecast, by Export Market Analysis (Value & Volume) 2020 & 2033
- Table 38: Global Packaging Market Volume Trillion Forecast, by Export Market Analysis (Value & Volume) 2020 & 2033
- Table 39: Global Packaging Market Revenue Million Forecast, by Price Trend Analysis 2020 & 2033
- Table 40: Global Packaging Market Volume Trillion Forecast, by Price Trend Analysis 2020 & 2033
- Table 41: Global Packaging Market Revenue Million Forecast, by Country 2020 & 2033
- Table 42: Global Packaging Market Volume Trillion Forecast, by Country 2020 & 2033
- Table 43: Brazil Packaging Market Revenue (Million) Forecast, by Application 2020 & 2033
- Table 44: Brazil Packaging Market Volume (Trillion) Forecast, by Application 2020 & 2033
- Table 45: Argentina Packaging Market Revenue (Million) Forecast, by Application 2020 & 2033
- Table 46: Argentina Packaging Market Volume (Trillion) Forecast, by Application 2020 & 2033
- Table 47: Rest of South America Packaging Market Revenue (Million) Forecast, by Application 2020 & 2033
- Table 48: Rest of South America Packaging Market Volume (Trillion) Forecast, by Application 2020 & 2033
- Table 49: Global Packaging Market Revenue Million Forecast, by Production Analysis 2020 & 2033
- Table 50: Global Packaging Market Volume Trillion Forecast, by Production Analysis 2020 & 2033
- Table 51: Global Packaging Market Revenue Million Forecast, by Consumption Analysis 2020 & 2033
- Table 52: Global Packaging Market Volume Trillion Forecast, by Consumption Analysis 2020 & 2033
- Table 53: Global Packaging Market Revenue Million Forecast, by Import Market Analysis (Value & Volume) 2020 & 2033
- Table 54: Global Packaging Market Volume Trillion Forecast, by Import Market Analysis (Value & Volume) 2020 & 2033
- Table 55: Global Packaging Market Revenue Million Forecast, by Export Market Analysis (Value & Volume) 2020 & 2033
- Table 56: Global Packaging Market Volume Trillion Forecast, by Export Market Analysis (Value & Volume) 2020 & 2033
- Table 57: Global Packaging Market Revenue Million Forecast, by Price Trend Analysis 2020 & 2033
- Table 58: Global Packaging Market Volume Trillion Forecast, by Price Trend Analysis 2020 & 2033
- Table 59: Global Packaging Market Revenue Million Forecast, by Country 2020 & 2033
- Table 60: Global Packaging Market Volume Trillion Forecast, by Country 2020 & 2033
- Table 61: United Kingdom Packaging Market Revenue (Million) Forecast, by Application 2020 & 2033
- Table 62: United Kingdom Packaging Market Volume (Trillion) Forecast, by Application 2020 & 2033
- Table 63: Germany Packaging Market Revenue (Million) Forecast, by Application 2020 & 2033
- Table 64: Germany Packaging Market Volume (Trillion) Forecast, by Application 2020 & 2033
- Table 65: France Packaging Market Revenue (Million) Forecast, by Application 2020 & 2033
- Table 66: France Packaging Market Volume (Trillion) Forecast, by Application 2020 & 2033
- Table 67: Italy Packaging Market Revenue (Million) Forecast, by Application 2020 & 2033
- Table 68: Italy Packaging Market Volume (Trillion) Forecast, by Application 2020 & 2033
- Table 69: Spain Packaging Market Revenue (Million) Forecast, by Application 2020 & 2033
- Table 70: Spain Packaging Market Volume (Trillion) Forecast, by Application 2020 & 2033
- Table 71: Russia Packaging Market Revenue (Million) Forecast, by Application 2020 & 2033
- Table 72: Russia Packaging Market Volume (Trillion) Forecast, by Application 2020 & 2033
- Table 73: Benelux Packaging Market Revenue (Million) Forecast, by Application 2020 & 2033
- Table 74: Benelux Packaging Market Volume (Trillion) Forecast, by Application 2020 & 2033
- Table 75: Nordics Packaging Market Revenue (Million) Forecast, by Application 2020 & 2033
- Table 76: Nordics Packaging Market Volume (Trillion) Forecast, by Application 2020 & 2033
- Table 77: Rest of Europe Packaging Market Revenue (Million) Forecast, by Application 2020 & 2033
- Table 78: Rest of Europe Packaging Market Volume (Trillion) Forecast, by Application 2020 & 2033
- Table 79: Global Packaging Market Revenue Million Forecast, by Production Analysis 2020 & 2033
- Table 80: Global Packaging Market Volume Trillion Forecast, by Production Analysis 2020 & 2033
- Table 81: Global Packaging Market Revenue Million Forecast, by Consumption Analysis 2020 & 2033
- Table 82: Global Packaging Market Volume Trillion Forecast, by Consumption Analysis 2020 & 2033
- Table 83: Global Packaging Market Revenue Million Forecast, by Import Market Analysis (Value & Volume) 2020 & 2033
- Table 84: Global Packaging Market Volume Trillion Forecast, by Import Market Analysis (Value & Volume) 2020 & 2033
- Table 85: Global Packaging Market Revenue Million Forecast, by Export Market Analysis (Value & Volume) 2020 & 2033
- Table 86: Global Packaging Market Volume Trillion Forecast, by Export Market Analysis (Value & Volume) 2020 & 2033
- Table 87: Global Packaging Market Revenue Million Forecast, by Price Trend Analysis 2020 & 2033
- Table 88: Global Packaging Market Volume Trillion Forecast, by Price Trend Analysis 2020 & 2033
- Table 89: Global Packaging Market Revenue Million Forecast, by Country 2020 & 2033
- Table 90: Global Packaging Market Volume Trillion Forecast, by Country 2020 & 2033
- Table 91: Turkey Packaging Market Revenue (Million) Forecast, by Application 2020 & 2033
- Table 92: Turkey Packaging Market Volume (Trillion) Forecast, by Application 2020 & 2033
- Table 93: Israel Packaging Market Revenue (Million) Forecast, by Application 2020 & 2033
- Table 94: Israel Packaging Market Volume (Trillion) Forecast, by Application 2020 & 2033
- Table 95: GCC Packaging Market Revenue (Million) Forecast, by Application 2020 & 2033
- Table 96: GCC Packaging Market Volume (Trillion) Forecast, by Application 2020 & 2033
- Table 97: North Africa Packaging Market Revenue (Million) Forecast, by Application 2020 & 2033
- Table 98: North Africa Packaging Market Volume (Trillion) Forecast, by Application 2020 & 2033
- Table 99: South Africa Packaging Market Revenue (Million) Forecast, by Application 2020 & 2033
- Table 100: South Africa Packaging Market Volume (Trillion) Forecast, by Application 2020 & 2033
- Table 101: Rest of Middle East & Africa Packaging Market Revenue (Million) Forecast, by Application 2020 & 2033
- Table 102: Rest of Middle East & Africa Packaging Market Volume (Trillion) Forecast, by Application 2020 & 2033
- Table 103: Global Packaging Market Revenue Million Forecast, by Production Analysis 2020 & 2033
- Table 104: Global Packaging Market Volume Trillion Forecast, by Production Analysis 2020 & 2033
- Table 105: Global Packaging Market Revenue Million Forecast, by Consumption Analysis 2020 & 2033
- Table 106: Global Packaging Market Volume Trillion Forecast, by Consumption Analysis 2020 & 2033
- Table 107: Global Packaging Market Revenue Million Forecast, by Import Market Analysis (Value & Volume) 2020 & 2033
- Table 108: Global Packaging Market Volume Trillion Forecast, by Import Market Analysis (Value & Volume) 2020 & 2033
- Table 109: Global Packaging Market Revenue Million Forecast, by Export Market Analysis (Value & Volume) 2020 & 2033
- Table 110: Global Packaging Market Volume Trillion Forecast, by Export Market Analysis (Value & Volume) 2020 & 2033
- Table 111: Global Packaging Market Revenue Million Forecast, by Price Trend Analysis 2020 & 2033
- Table 112: Global Packaging Market Volume Trillion Forecast, by Price Trend Analysis 2020 & 2033
- Table 113: Global Packaging Market Revenue Million Forecast, by Country 2020 & 2033
- Table 114: Global Packaging Market Volume Trillion Forecast, by Country 2020 & 2033
- Table 115: China Packaging Market Revenue (Million) Forecast, by Application 2020 & 2033
- Table 116: China Packaging Market Volume (Trillion) Forecast, by Application 2020 & 2033
- Table 117: India Packaging Market Revenue (Million) Forecast, by Application 2020 & 2033
- Table 118: India Packaging Market Volume (Trillion) Forecast, by Application 2020 & 2033
- Table 119: Japan Packaging Market Revenue (Million) Forecast, by Application 2020 & 2033
- Table 120: Japan Packaging Market Volume (Trillion) Forecast, by Application 2020 & 2033
- Table 121: South Korea Packaging Market Revenue (Million) Forecast, by Application 2020 & 2033
- Table 122: South Korea Packaging Market Volume (Trillion) Forecast, by Application 2020 & 2033
- Table 123: ASEAN Packaging Market Revenue (Million) Forecast, by Application 2020 & 2033
- Table 124: ASEAN Packaging Market Volume (Trillion) Forecast, by Application 2020 & 2033
- Table 125: Oceania Packaging Market Revenue (Million) Forecast, by Application 2020 & 2033
- Table 126: Oceania Packaging Market Volume (Trillion) Forecast, by Application 2020 & 2033
- Table 127: Rest of Asia Pacific Packaging Market Revenue (Million) Forecast, by Application 2020 & 2033
- Table 128: Rest of Asia Pacific Packaging Market Volume (Trillion) Forecast, by Application 2020 & 2033
Frequently Asked Questions
1. What is the projected Compound Annual Growth Rate (CAGR) of the Packaging Market?
The projected CAGR is approximately 3.89%.
2. Which companies are prominent players in the Packaging Market?
Key companies in the market include International Paper Company, Mondi Group, Smurfit Kappa Group, DS Smith PLC, WestRock Company, UFlex Limited, Huhtamaki Oyj, Amcor Group GmbH, Coveris Holding SA, Sealed Air Corporation, Greif Inc, Sonoco Products Company, Aptar Group Inc, Berry Global Group Inc, Alpla Group, Owens-illinois Inc, Vidrala S A, Verallia SA, Gerresheimer AG, Vitro S A B De C V, Ball Corporation, Crown Holdings Inc, Ardagh Group S A, Can Pack SA, Silgan Holdings Inc.
3. What are the main segments of the Packaging Market?
The market segments include Production Analysis, Consumption Analysis, Import Market Analysis (Value & Volume), Export Market Analysis (Value & Volume), Price Trend Analysis.
4. Can you provide details about the market size?
The market size is estimated to be USD 1.14 Million as of 2022.
5. What are some drivers contributing to market growth?
N/A
6. What are the notable trends driving market growth?
Paper and Paperboard Packaging Products to Witness the Highest Growth.
7. Are there any restraints impacting market growth?
N/A
8. Can you provide examples of recent developments in the market?
June 2024: Sonoco Products Company announced its agreement to acquire Eviosys, a Europe manufacturer of food cans, ends, and closures, from KPS Capital Partners, LP, at around USD 3.9 billion.
9. What pricing options are available for accessing the report?
Pricing options include single-user, multi-user, and enterprise licenses priced at USD 3800, USD 4500, and USD 5800 respectively.
10. Is the market size provided in terms of value or volume?
The market size is provided in terms of value, measured in Million and volume, measured in Trillion.
11. Are there any specific market keywords associated with the report?
Yes, the market keyword associated with the report is "Packaging Market," which aids in identifying and referencing the specific market segment covered.
12. How do I determine which pricing option suits my needs best?
The pricing options vary based on user requirements and access needs. Individual users may opt for single-user licenses, while businesses requiring broader access may choose multi-user or enterprise licenses for cost-effective access to the report.
13. Are there any additional resources or data provided in the Packaging Market report?
While the report offers comprehensive insights, it's advisable to review the specific contents or supplementary materials provided to ascertain if additional resources or data are available.
14. How can I stay updated on further developments or reports in the Packaging Market?
To stay informed about further developments, trends, and reports in the Packaging Market, consider subscribing to industry newsletters, following relevant companies and organizations, or regularly checking reputable industry news sources and publications.
Methodology
Step 1 - Identification of Relevant Samples Size from Population Database


Step 2 - Approaches for Defining Global Market Size (Value, Volume* & Price*)

Note*: In applicable scenarios
Step 3 - Data Sources
Primary Research
- Web Analytics
- Survey Reports
- Research Institute
- Latest Research Reports
- Opinion Leaders
Secondary Research
- Annual Reports
- White Paper
- Latest Press Release
- Industry Association
- Paid Database
- Investor Presentations

Step 4 - Data Triangulation
Involves using different sources of information in order to increase the validity of a study
These sources are likely to be stakeholders in a program - participants, other researchers, program staff, other community members, and so on.
Then we put all data in single framework & apply various statistical tools to find out the dynamic on the market.
During the analysis stage, feedback from the stakeholder groups would be compared to determine areas of agreement as well as areas of divergence