

Key Insights
The shelf-stable packaging market is poised for significant expansion, driven by escalating consumer demand for convenient, extended-shelf-life food products. With a projected Compound Annual Growth Rate (CAGR) of 4.9% from 2025 onwards, the market is anticipated to reach a size of 63.15 billion. Key growth catalysts include the increasing popularity of ready-to-eat meals, a growing consumer preference for extended shelf life, and an enhanced focus on food safety and preservation technologies. The market is segmented by packaging format (flexible and rigid), material (plastic, metal, glass, paper and paperboard), product type (cans, bottles, jars, cartons, pouches, and others), packaging technology (aseptic, retort, hot fill, and others), and end-user industry (sauce & condiments, processed fruits & vegetables, prepared foods, juices, dairy, meat, poultry & seafood, and others). While specific regional data is not detailed, North America and Europe are expected to maintain substantial market share, with the Asia-Pacific region showing considerable growth potential due to urbanization and evolving consumption patterns. Major industry players, including Amcor, Tetra Pak, and Crown Holdings, are actively competing through innovation and strategic acquisitions.
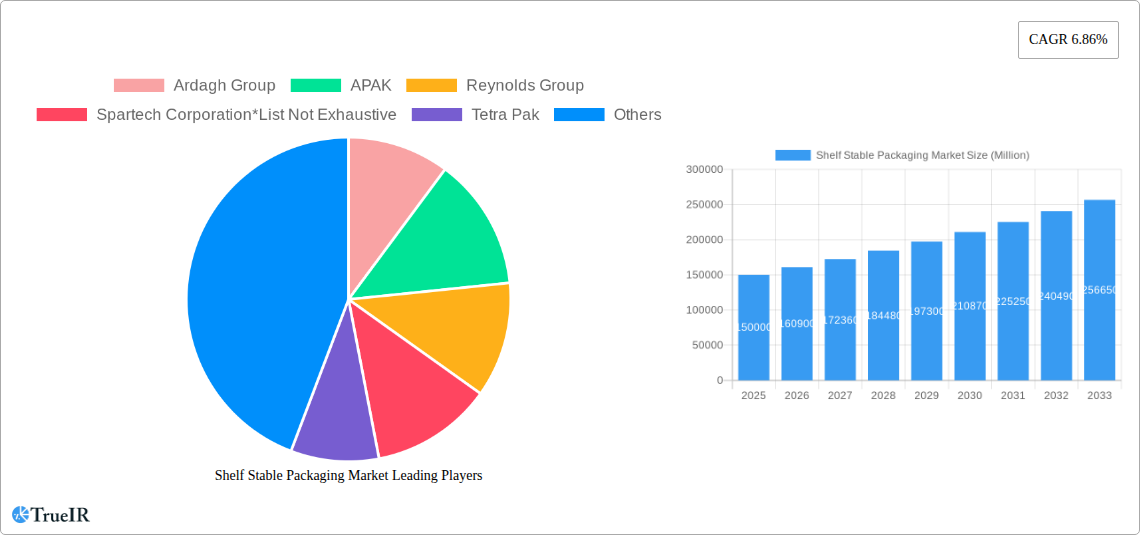
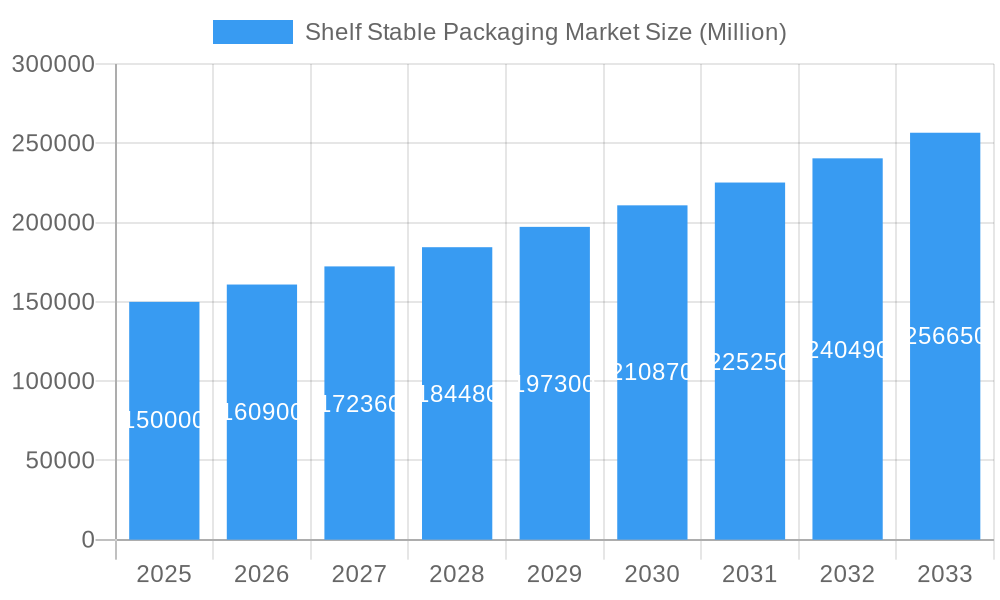
Shelf Stable Packaging Market Market Size (In Billion)
Market evolution is influenced by several key trends, notably the adoption of sustainable packaging solutions, the expansion of e-commerce, and advancements in packaging technology. Eco-friendly materials such as recyclable and biodegradable options are increasingly favored, prompting manufacturers to embrace sustainable practices. The growth of online grocery shopping is fueling demand for packaging that ensures product integrity during transit. Technological innovations in aseptic and retort packaging are extending shelf life, thereby reducing food waste and improving product quality. However, market expansion may face challenges from fluctuating raw material costs and stringent food safety and environmental regulations. Future growth will likely be shaped by the synergy of these factors, with a continued emphasis on innovation, sustainability, and consumer preferences guiding market development.
Shelf Stable Packaging Market Company Market Share
Shelf Stable Packaging Market: A Comprehensive Report (2019-2033)
This dynamic report provides a thorough analysis of the Shelf Stable Packaging Market, offering invaluable insights for industry professionals, investors, and strategic decision-makers. Leveraging extensive market research and data analysis spanning the period from 2019 to 2033 (base year 2025, forecast period 2025-2033), this report delivers a 360° view of this rapidly evolving sector. The report features detailed segmentation analysis, competitive landscape evaluation, and future projections, equipping readers with the knowledge necessary to navigate this dynamic market. With a focus on high-volume keywords like "shelf stable packaging market," "food packaging market," "aseptic packaging," and "sustainable packaging," this report is optimized for enhanced search visibility and industry relevance. The global market value is projected to reach xx Million by 2033, demonstrating significant growth potential.
Shelf Stable Packaging Market Market Structure & Competitive Landscape
The shelf-stable packaging market exhibits a moderately concentrated structure, with several major players holding significant market share. The Herfindahl-Hirschman Index (HHI) is estimated at xx, indicating a competitive yet consolidated landscape. Innovation is a key driver, with companies continuously developing new materials, technologies, and formats to enhance product preservation and consumer appeal. Regulatory pressures, particularly concerning sustainability and food safety, significantly impact market dynamics. Increasing environmental concerns fuel the demand for eco-friendly packaging options, creating both challenges and opportunities for market participants. Product substitutes, such as modified atmosphere packaging (MAP), are also influencing market share dynamics.
- Market Concentration: Moderately concentrated (HHI: xx)
- Innovation Drivers: Sustainable materials, improved barrier properties, enhanced convenience features.
- Regulatory Impacts: Stringent food safety regulations, increasing emphasis on sustainable packaging.
- Product Substitutes: MAP, vacuum packaging.
- End-User Segmentation: Significant diversity across food and beverage categories.
- M&A Trends: Consolidation is expected, driven by the need for economies of scale and expanded product portfolios. The number of M&A deals in the past five years is estimated to be xx, with a total value of approximately xx Million.
Shelf Stable Packaging Market Market Trends & Opportunities
The shelf-stable packaging market is experiencing robust growth, driven by several key factors. The global market is projected to expand at a Compound Annual Growth Rate (CAGR) of xx% during the forecast period (2025-2033), reaching a value of xx Million by 2033. This growth is fueled by several factors, including:
- Rising Demand for Convenient Foods: The increasing prevalence of single-serve and ready-to-eat foods boosts demand for shelf-stable packaging solutions.
- Technological Advancements: The introduction of innovative packaging materials and technologies, such as aseptic and retort packaging, is extending shelf life and improving product quality.
- E-commerce Growth: The surge in online grocery shopping requires packaging that can withstand the rigors of shipping and handling.
- Sustainability Concerns: Growing consumer awareness of environmental issues is driving the demand for eco-friendly packaging options.
- Changing Consumer Preferences: Consumers are increasingly seeking healthier and more convenient food options, which directly affects packaging choices.
- Market Penetration Rates: The penetration rate of shelf-stable packaging solutions in developing economies is increasing significantly.
Dominant Markets & Segments in Shelf Stable Packaging Market
The North American and European markets currently hold dominant positions in the shelf-stable packaging market, driven by high consumer spending and established food processing industries. However, Asia-Pacific is witnessing rapid growth, fueled by increasing disposable incomes and changing dietary habits. Within segment analysis:
By Packaging Format: Flexible packaging currently dominates, driven by its cost-effectiveness and versatility. Rigid packaging is also experiencing growth, particularly in applications demanding robust protection.
By Packaging Material: Plastic currently holds the largest share, due to its versatility and low cost. However, the increasing focus on sustainability is driving demand for alternative materials like paper and paperboard.
By Product Type: Metal cans are a dominant format due to their long shelf life and protective properties. Pouches are experiencing rapid growth due to their cost-effectiveness and versatility.
By Packaging Technology: Aseptic packaging is becoming increasingly popular due to its ability to maintain food quality and safety without refrigeration.
By End User Industry: The Prepared Food sector is the largest end-user, followed by Processed Fruit & Vegetable and Dairy Foods.
Key Growth Drivers:
- Strong economic growth in developing countries
- Government initiatives to support the food processing industry
- Investments in infrastructure to support efficient food supply chains
Shelf Stable Packaging Market Product Analysis
Recent innovations in shelf-stable packaging focus on enhancing product quality, shelf life, and sustainability. Advances in materials science have led to the development of barrier films with improved oxygen and moisture resistance, extending the shelf life of packaged foods. Aseptic and retort packaging technologies are gaining traction, minimizing the need for refrigeration and enhancing food safety. These advancements have significantly improved product quality and consumer satisfaction. Companies are focusing on eco-friendly materials and designs, minimizing environmental impact and catering to growing consumer preferences.
Key Drivers, Barriers & Challenges in Shelf Stable Packaging Market
Key Drivers:
- Growing demand for convenient and ready-to-eat food
- Technological advancements in packaging materials and technologies
- Increasing focus on food safety and preservation
- Government regulations promoting sustainable packaging
Key Challenges:
- Fluctuating raw material prices impact production costs.
- Stringent regulations regarding food safety and environmental compliance increase complexity.
- Competition from alternative packaging formats and technologies presents ongoing pressure. The entry of several small to medium scale enterprises puts pressure on the established players. Market share has shifted by xx% in the last five years.
Growth Drivers in the Shelf Stable Packaging Market Market
Technological advancements, rising demand for convenient foods, and the expanding e-commerce sector are key drivers. The increasing focus on sustainability is also driving innovation and market growth. Government regulations supporting sustainable and safe packaging further contribute to the market's expansion.
Challenges Impacting Shelf Stable Packaging Market Growth
Raw material price volatility, stringent regulations, and intense competition create significant challenges. Maintaining supply chain efficiency during periods of increased demand is another major hurdle. Fluctuating oil prices affecting plastic resin costs present a key constraint.
Key Players Shaping the Shelf Stable Packaging Market Market
- Ardagh Group
- APAK
- Reynolds Group
- Spartech Corporation
- Tetra Pak
- PolyOne
- Bemis Company Inc
- Mondi Group
- Amcor PLC
- JHS Packaging
- DuPont
- Crown Holdings
- Berry Global
- Sealed Air Corporation
- Silgan Holdings
- Printpack
- Portland Pet Food Company
Significant Shelf Stable Packaging Market Industry Milestones
- July 2022: Liquibox launched Aseptic Liqui-Sure and Aseptic Flip-N-Seal, aseptic-ready fitments for bag-in-box dispensing, enhancing liquid preservation.
- March 2022: Mori, a food technology company, secured USD 50 Million in Series B1 financing to extend food shelf life and improve sustainable supply chains.
Future Outlook for Shelf Stable Packaging Market Market
The shelf-stable packaging market is poised for continued growth, driven by technological innovations, sustainability concerns, and evolving consumer preferences. Opportunities exist in developing sustainable packaging solutions and expanding into emerging markets. The market’s potential is significant, particularly in regions with growing populations and increasing demand for convenient and ready-to-eat foods.
Shelf Stable Packaging Market Segmentation
-
1. Packaging Format
- 1.1. Flexible
- 1.2. Rigid
-
2. Packaging Material
- 2.1. Plastic
- 2.2. Metal
- 2.3. Glass
- 2.4. Paper and Paperboard
-
3. Product Type
- 3.1. Metal Cans
- 3.2. Bottles
- 3.3. Jars
- 3.4. Cartons
- 3.5. Pouches
- 3.6. Other Pr
-
4. Packaging Technology
- 4.1. Asceptic Food Packaging
- 4.2. Retort Food Packaging
- 4.3. Hot Fill Food Packaging
- 4.4. Others
-
5. End User Industry
- 5.1. Sauce & Condiment
- 5.2. Processed Fruit & Vegetable
- 5.3. Prepared Food
- 5.4. Juice
- 5.5. Dairy Food
- 5.6. Meat Poultry and Seafood
- 5.7. Others
Shelf Stable Packaging Market Segmentation By Geography
- 1. North America
- 2. Europe
- 3. Asia Pacific
- 4. Latin America
- 5. Middle East and Africa
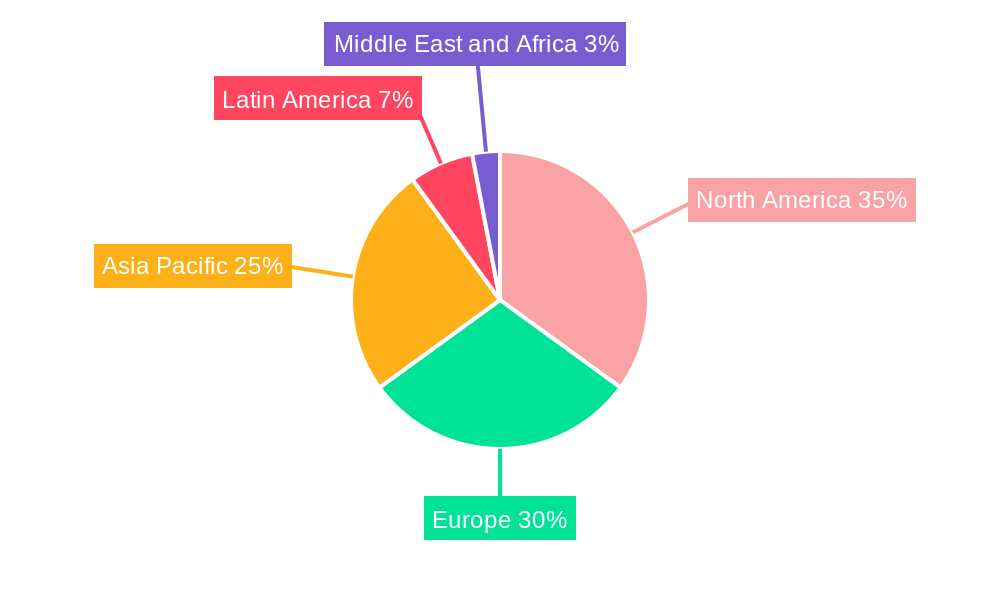
Shelf Stable Packaging Market Regional Market Share
Geographic Coverage of Shelf Stable Packaging Market
Shelf Stable Packaging Market REPORT HIGHLIGHTS
| Aspects | Details |
|---|---|
| Study Period | 2020-2034 |
| Base Year | 2025 |
| Estimated Year | 2026 |
| Forecast Period | 2026-2034 |
| Historical Period | 2020-2025 |
| Growth Rate | CAGR of 4.9% from 2020-2034 |
| Segmentation |
|
Table of Contents
- 1. Introduction
- 1.1. Research Scope
- 1.2. Market Segmentation
- 1.3. Research Objective
- 1.4. Definitions and Assumptions
- 2. Executive Summary
- 2.1. Market Snapshot
- 3. Market Dynamics
- 3.1. Market Drivers
- 3.2. Market Restrains
- 3.3. Market Trends
- 3.4. Market Opportunities
- 4. Market Factor Analysis
- 4.1. Porters Five Forces
- 4.1.1. Bargaining Power of Suppliers
- 4.1.2. Bargaining Power of Buyers
- 4.1.3. Threat of New Entrants
- 4.1.4. Threat of Substitutes
- 4.1.5. Competitive Rivalry
- 4.2. PESTEL analysis
- 4.3. BCG Analysis
- 4.3.1. Stars (High Growth, High Market Share)
- 4.3.2. Cash Cows (Low Growth, High Market Share)
- 4.3.3. Question Mark (High Growth, Low Market Share)
- 4.3.4. Dogs (Low Growth, Low Market Share)
- 4.4. Ansoff Matrix Analysis
- 4.5. Supply Chain Analysis
- 4.6. Regulatory Landscape
- 4.7. Current Market Potential and Opportunity Assessment (TAM–SAM–SOM Framework)
- 4.8. TIR Analyst Note
- 4.1. Porters Five Forces
- 5. Market Analysis, Insights and Forecast 2021-2033
- 5.1. Market Analysis, Insights and Forecast - by Packaging Format
- 5.1.1. Flexible
- 5.1.2. Rigid
- 5.2. Market Analysis, Insights and Forecast - by Packaging Material
- 5.2.1. Plastic
- 5.2.2. Metal
- 5.2.3. Glass
- 5.2.4. Paper and Paperboard
- 5.3. Market Analysis, Insights and Forecast - by Product Type
- 5.3.1. Metal Cans
- 5.3.2. Bottles
- 5.3.3. Jars
- 5.3.4. Cartons
- 5.3.5. Pouches
- 5.3.6. Other Pr
- 5.4. Market Analysis, Insights and Forecast - by Packaging Technology
- 5.4.1. Asceptic Food Packaging
- 5.4.2. Retort Food Packaging
- 5.4.3. Hot Fill Food Packaging
- 5.4.4. Others
- 5.5. Market Analysis, Insights and Forecast - by End User Industry
- 5.5.1. Sauce & Condiment
- 5.5.2. Processed Fruit & Vegetable
- 5.5.3. Prepared Food
- 5.5.4. Juice
- 5.5.5. Dairy Food
- 5.5.6. Meat Poultry and Seafood
- 5.5.7. Others
- 5.6. Market Analysis, Insights and Forecast - by Region
- 5.6.1. North America
- 5.6.2. Europe
- 5.6.3. Asia Pacific
- 5.6.4. Latin America
- 5.6.5. Middle East and Africa
- 5.1. Market Analysis, Insights and Forecast - by Packaging Format
- 6. Global Shelf Stable Packaging Market Analysis, Insights and Forecast, 2021-2033
- 6.1. Market Analysis, Insights and Forecast - by Packaging Format
- 6.1.1. Flexible
- 6.1.2. Rigid
- 6.2. Market Analysis, Insights and Forecast - by Packaging Material
- 6.2.1. Plastic
- 6.2.2. Metal
- 6.2.3. Glass
- 6.2.4. Paper and Paperboard
- 6.3. Market Analysis, Insights and Forecast - by Product Type
- 6.3.1. Metal Cans
- 6.3.2. Bottles
- 6.3.3. Jars
- 6.3.4. Cartons
- 6.3.5. Pouches
- 6.3.6. Other Pr
- 6.4. Market Analysis, Insights and Forecast - by Packaging Technology
- 6.4.1. Asceptic Food Packaging
- 6.4.2. Retort Food Packaging
- 6.4.3. Hot Fill Food Packaging
- 6.4.4. Others
- 6.5. Market Analysis, Insights and Forecast - by End User Industry
- 6.5.1. Sauce & Condiment
- 6.5.2. Processed Fruit & Vegetable
- 6.5.3. Prepared Food
- 6.5.4. Juice
- 6.5.5. Dairy Food
- 6.5.6. Meat Poultry and Seafood
- 6.5.7. Others
- 6.1. Market Analysis, Insights and Forecast - by Packaging Format
- 7. North America Shelf Stable Packaging Market Analysis, Insights and Forecast, 2020-2032
- 7.1. Market Analysis, Insights and Forecast - by Packaging Format
- 7.1.1. Flexible
- 7.1.2. Rigid
- 7.2. Market Analysis, Insights and Forecast - by Packaging Material
- 7.2.1. Plastic
- 7.2.2. Metal
- 7.2.3. Glass
- 7.2.4. Paper and Paperboard
- 7.3. Market Analysis, Insights and Forecast - by Product Type
- 7.3.1. Metal Cans
- 7.3.2. Bottles
- 7.3.3. Jars
- 7.3.4. Cartons
- 7.3.5. Pouches
- 7.3.6. Other Pr
- 7.4. Market Analysis, Insights and Forecast - by Packaging Technology
- 7.4.1. Asceptic Food Packaging
- 7.4.2. Retort Food Packaging
- 7.4.3. Hot Fill Food Packaging
- 7.4.4. Others
- 7.5. Market Analysis, Insights and Forecast - by End User Industry
- 7.5.1. Sauce & Condiment
- 7.5.2. Processed Fruit & Vegetable
- 7.5.3. Prepared Food
- 7.5.4. Juice
- 7.5.5. Dairy Food
- 7.5.6. Meat Poultry and Seafood
- 7.5.7. Others
- 7.1. Market Analysis, Insights and Forecast - by Packaging Format
- 8. Europe Shelf Stable Packaging Market Analysis, Insights and Forecast, 2020-2032
- 8.1. Market Analysis, Insights and Forecast - by Packaging Format
- 8.1.1. Flexible
- 8.1.2. Rigid
- 8.2. Market Analysis, Insights and Forecast - by Packaging Material
- 8.2.1. Plastic
- 8.2.2. Metal
- 8.2.3. Glass
- 8.2.4. Paper and Paperboard
- 8.3. Market Analysis, Insights and Forecast - by Product Type
- 8.3.1. Metal Cans
- 8.3.2. Bottles
- 8.3.3. Jars
- 8.3.4. Cartons
- 8.3.5. Pouches
- 8.3.6. Other Pr
- 8.4. Market Analysis, Insights and Forecast - by Packaging Technology
- 8.4.1. Asceptic Food Packaging
- 8.4.2. Retort Food Packaging
- 8.4.3. Hot Fill Food Packaging
- 8.4.4. Others
- 8.5. Market Analysis, Insights and Forecast - by End User Industry
- 8.5.1. Sauce & Condiment
- 8.5.2. Processed Fruit & Vegetable
- 8.5.3. Prepared Food
- 8.5.4. Juice
- 8.5.5. Dairy Food
- 8.5.6. Meat Poultry and Seafood
- 8.5.7. Others
- 8.1. Market Analysis, Insights and Forecast - by Packaging Format
- 9. Asia Pacific Shelf Stable Packaging Market Analysis, Insights and Forecast, 2020-2032
- 9.1. Market Analysis, Insights and Forecast - by Packaging Format
- 9.1.1. Flexible
- 9.1.2. Rigid
- 9.2. Market Analysis, Insights and Forecast - by Packaging Material
- 9.2.1. Plastic
- 9.2.2. Metal
- 9.2.3. Glass
- 9.2.4. Paper and Paperboard
- 9.3. Market Analysis, Insights and Forecast - by Product Type
- 9.3.1. Metal Cans
- 9.3.2. Bottles
- 9.3.3. Jars
- 9.3.4. Cartons
- 9.3.5. Pouches
- 9.3.6. Other Pr
- 9.4. Market Analysis, Insights and Forecast - by Packaging Technology
- 9.4.1. Asceptic Food Packaging
- 9.4.2. Retort Food Packaging
- 9.4.3. Hot Fill Food Packaging
- 9.4.4. Others
- 9.5. Market Analysis, Insights and Forecast - by End User Industry
- 9.5.1. Sauce & Condiment
- 9.5.2. Processed Fruit & Vegetable
- 9.5.3. Prepared Food
- 9.5.4. Juice
- 9.5.5. Dairy Food
- 9.5.6. Meat Poultry and Seafood
- 9.5.7. Others
- 9.1. Market Analysis, Insights and Forecast - by Packaging Format
- 10. Latin America Shelf Stable Packaging Market Analysis, Insights and Forecast, 2020-2032
- 10.1. Market Analysis, Insights and Forecast - by Packaging Format
- 10.1.1. Flexible
- 10.1.2. Rigid
- 10.2. Market Analysis, Insights and Forecast - by Packaging Material
- 10.2.1. Plastic
- 10.2.2. Metal
- 10.2.3. Glass
- 10.2.4. Paper and Paperboard
- 10.3. Market Analysis, Insights and Forecast - by Product Type
- 10.3.1. Metal Cans
- 10.3.2. Bottles
- 10.3.3. Jars
- 10.3.4. Cartons
- 10.3.5. Pouches
- 10.3.6. Other Pr
- 10.4. Market Analysis, Insights and Forecast - by Packaging Technology
- 10.4.1. Asceptic Food Packaging
- 10.4.2. Retort Food Packaging
- 10.4.3. Hot Fill Food Packaging
- 10.4.4. Others
- 10.5. Market Analysis, Insights and Forecast - by End User Industry
- 10.5.1. Sauce & Condiment
- 10.5.2. Processed Fruit & Vegetable
- 10.5.3. Prepared Food
- 10.5.4. Juice
- 10.5.5. Dairy Food
- 10.5.6. Meat Poultry and Seafood
- 10.5.7. Others
- 10.1. Market Analysis, Insights and Forecast - by Packaging Format
- 11. Middle East and Africa Shelf Stable Packaging Market Analysis, Insights and Forecast, 2020-2032
- 11.1. Market Analysis, Insights and Forecast - by Packaging Format
- 11.1.1. Flexible
- 11.1.2. Rigid
- 11.2. Market Analysis, Insights and Forecast - by Packaging Material
- 11.2.1. Plastic
- 11.2.2. Metal
- 11.2.3. Glass
- 11.2.4. Paper and Paperboard
- 11.3. Market Analysis, Insights and Forecast - by Product Type
- 11.3.1. Metal Cans
- 11.3.2. Bottles
- 11.3.3. Jars
- 11.3.4. Cartons
- 11.3.5. Pouches
- 11.3.6. Other Pr
- 11.4. Market Analysis, Insights and Forecast - by Packaging Technology
- 11.4.1. Asceptic Food Packaging
- 11.4.2. Retort Food Packaging
- 11.4.3. Hot Fill Food Packaging
- 11.4.4. Others
- 11.5. Market Analysis, Insights and Forecast - by End User Industry
- 11.5.1. Sauce & Condiment
- 11.5.2. Processed Fruit & Vegetable
- 11.5.3. Prepared Food
- 11.5.4. Juice
- 11.5.5. Dairy Food
- 11.5.6. Meat Poultry and Seafood
- 11.5.7. Others
- 11.1. Market Analysis, Insights and Forecast - by Packaging Format
- 12. Competitive Analysis
- 12.1. Company Profiles
- 12.1.1 Ardagh Group
- 12.1.1.1. Company Overview
- 12.1.1.2. Products
- 12.1.1.3. Company Financials
- 12.1.1.4. SWOT Analysis
- 12.1.2 APAK
- 12.1.2.1. Company Overview
- 12.1.2.2. Products
- 12.1.2.3. Company Financials
- 12.1.2.4. SWOT Analysis
- 12.1.3 Reynolds Group
- 12.1.3.1. Company Overview
- 12.1.3.2. Products
- 12.1.3.3. Company Financials
- 12.1.3.4. SWOT Analysis
- 12.1.4 Spartech Corporation*List Not Exhaustive
- 12.1.4.1. Company Overview
- 12.1.4.2. Products
- 12.1.4.3. Company Financials
- 12.1.4.4. SWOT Analysis
- 12.1.5 Tetra Pak
- 12.1.5.1. Company Overview
- 12.1.5.2. Products
- 12.1.5.3. Company Financials
- 12.1.5.4. SWOT Analysis
- 12.1.6 PolyOne
- 12.1.6.1. Company Overview
- 12.1.6.2. Products
- 12.1.6.3. Company Financials
- 12.1.6.4. SWOT Analysis
- 12.1.7 Bemis Company Inc
- 12.1.7.1. Company Overview
- 12.1.7.2. Products
- 12.1.7.3. Company Financials
- 12.1.7.4. SWOT Analysis
- 12.1.8 Mondi Group
- 12.1.8.1. Company Overview
- 12.1.8.2. Products
- 12.1.8.3. Company Financials
- 12.1.8.4. SWOT Analysis
- 12.1.9 Amcor PLC
- 12.1.9.1. Company Overview
- 12.1.9.2. Products
- 12.1.9.3. Company Financials
- 12.1.9.4. SWOT Analysis
- 12.1.10 JHS Packaging
- 12.1.10.1. Company Overview
- 12.1.10.2. Products
- 12.1.10.3. Company Financials
- 12.1.10.4. SWOT Analysis
- 12.1.11 DuPont
- 12.1.11.1. Company Overview
- 12.1.11.2. Products
- 12.1.11.3. Company Financials
- 12.1.11.4. SWOT Analysis
- 12.1.12 Crown Holdings
- 12.1.12.1. Company Overview
- 12.1.12.2. Products
- 12.1.12.3. Company Financials
- 12.1.12.4. SWOT Analysis
- 12.1.13 Berry Global
- 12.1.13.1. Company Overview
- 12.1.13.2. Products
- 12.1.13.3. Company Financials
- 12.1.13.4. SWOT Analysis
- 12.1.14 Sealed Air Corporation
- 12.1.14.1. Company Overview
- 12.1.14.2. Products
- 12.1.14.3. Company Financials
- 12.1.14.4. SWOT Analysis
- 12.1.15 Silgan Holdings
- 12.1.15.1. Company Overview
- 12.1.15.2. Products
- 12.1.15.3. Company Financials
- 12.1.15.4. SWOT Analysis
- 12.1.16 Printpack
- 12.1.16.1. Company Overview
- 12.1.16.2. Products
- 12.1.16.3. Company Financials
- 12.1.16.4. SWOT Analysis
- 12.1.17 Portland Pet Food Company
- 12.1.17.1. Company Overview
- 12.1.17.2. Products
- 12.1.17.3. Company Financials
- 12.1.17.4. SWOT Analysis
- 12.1.1 Ardagh Group
- 12.2. Market Entropy
- 12.2.1 Company's Key Areas Served
- 12.2.2 Recent Developments
- 12.3. Company Market Share Analysis 2025
- 12.3.1 Top 5 Companies Market Share Analysis
- 12.3.2 Top 3 Companies Market Share Analysis
- 12.4. List of Potential Customers
- 13. Research Methodology
List of Figures
- Figure 1: Global Shelf Stable Packaging Market Revenue Breakdown (billion, %) by Region 2025 & 2033
- Figure 2: North America Shelf Stable Packaging Market Revenue (billion), by Packaging Format 2025 & 2033
- Figure 3: North America Shelf Stable Packaging Market Revenue Share (%), by Packaging Format 2025 & 2033
- Figure 4: North America Shelf Stable Packaging Market Revenue (billion), by Packaging Material 2025 & 2033
- Figure 5: North America Shelf Stable Packaging Market Revenue Share (%), by Packaging Material 2025 & 2033
- Figure 6: North America Shelf Stable Packaging Market Revenue (billion), by Product Type 2025 & 2033
- Figure 7: North America Shelf Stable Packaging Market Revenue Share (%), by Product Type 2025 & 2033
- Figure 8: North America Shelf Stable Packaging Market Revenue (billion), by Packaging Technology 2025 & 2033
- Figure 9: North America Shelf Stable Packaging Market Revenue Share (%), by Packaging Technology 2025 & 2033
- Figure 10: North America Shelf Stable Packaging Market Revenue (billion), by End User Industry 2025 & 2033
- Figure 11: North America Shelf Stable Packaging Market Revenue Share (%), by End User Industry 2025 & 2033
- Figure 12: North America Shelf Stable Packaging Market Revenue (billion), by Country 2025 & 2033
- Figure 13: North America Shelf Stable Packaging Market Revenue Share (%), by Country 2025 & 2033
- Figure 14: Europe Shelf Stable Packaging Market Revenue (billion), by Packaging Format 2025 & 2033
- Figure 15: Europe Shelf Stable Packaging Market Revenue Share (%), by Packaging Format 2025 & 2033
- Figure 16: Europe Shelf Stable Packaging Market Revenue (billion), by Packaging Material 2025 & 2033
- Figure 17: Europe Shelf Stable Packaging Market Revenue Share (%), by Packaging Material 2025 & 2033
- Figure 18: Europe Shelf Stable Packaging Market Revenue (billion), by Product Type 2025 & 2033
- Figure 19: Europe Shelf Stable Packaging Market Revenue Share (%), by Product Type 2025 & 2033
- Figure 20: Europe Shelf Stable Packaging Market Revenue (billion), by Packaging Technology 2025 & 2033
- Figure 21: Europe Shelf Stable Packaging Market Revenue Share (%), by Packaging Technology 2025 & 2033
- Figure 22: Europe Shelf Stable Packaging Market Revenue (billion), by End User Industry 2025 & 2033
- Figure 23: Europe Shelf Stable Packaging Market Revenue Share (%), by End User Industry 2025 & 2033
- Figure 24: Europe Shelf Stable Packaging Market Revenue (billion), by Country 2025 & 2033
- Figure 25: Europe Shelf Stable Packaging Market Revenue Share (%), by Country 2025 & 2033
- Figure 26: Asia Pacific Shelf Stable Packaging Market Revenue (billion), by Packaging Format 2025 & 2033
- Figure 27: Asia Pacific Shelf Stable Packaging Market Revenue Share (%), by Packaging Format 2025 & 2033
- Figure 28: Asia Pacific Shelf Stable Packaging Market Revenue (billion), by Packaging Material 2025 & 2033
- Figure 29: Asia Pacific Shelf Stable Packaging Market Revenue Share (%), by Packaging Material 2025 & 2033
- Figure 30: Asia Pacific Shelf Stable Packaging Market Revenue (billion), by Product Type 2025 & 2033
- Figure 31: Asia Pacific Shelf Stable Packaging Market Revenue Share (%), by Product Type 2025 & 2033
- Figure 32: Asia Pacific Shelf Stable Packaging Market Revenue (billion), by Packaging Technology 2025 & 2033
- Figure 33: Asia Pacific Shelf Stable Packaging Market Revenue Share (%), by Packaging Technology 2025 & 2033
- Figure 34: Asia Pacific Shelf Stable Packaging Market Revenue (billion), by End User Industry 2025 & 2033
- Figure 35: Asia Pacific Shelf Stable Packaging Market Revenue Share (%), by End User Industry 2025 & 2033
- Figure 36: Asia Pacific Shelf Stable Packaging Market Revenue (billion), by Country 2025 & 2033
- Figure 37: Asia Pacific Shelf Stable Packaging Market Revenue Share (%), by Country 2025 & 2033
- Figure 38: Latin America Shelf Stable Packaging Market Revenue (billion), by Packaging Format 2025 & 2033
- Figure 39: Latin America Shelf Stable Packaging Market Revenue Share (%), by Packaging Format 2025 & 2033
- Figure 40: Latin America Shelf Stable Packaging Market Revenue (billion), by Packaging Material 2025 & 2033
- Figure 41: Latin America Shelf Stable Packaging Market Revenue Share (%), by Packaging Material 2025 & 2033
- Figure 42: Latin America Shelf Stable Packaging Market Revenue (billion), by Product Type 2025 & 2033
- Figure 43: Latin America Shelf Stable Packaging Market Revenue Share (%), by Product Type 2025 & 2033
- Figure 44: Latin America Shelf Stable Packaging Market Revenue (billion), by Packaging Technology 2025 & 2033
- Figure 45: Latin America Shelf Stable Packaging Market Revenue Share (%), by Packaging Technology 2025 & 2033
- Figure 46: Latin America Shelf Stable Packaging Market Revenue (billion), by End User Industry 2025 & 2033
- Figure 47: Latin America Shelf Stable Packaging Market Revenue Share (%), by End User Industry 2025 & 2033
- Figure 48: Latin America Shelf Stable Packaging Market Revenue (billion), by Country 2025 & 2033
- Figure 49: Latin America Shelf Stable Packaging Market Revenue Share (%), by Country 2025 & 2033
- Figure 50: Middle East and Africa Shelf Stable Packaging Market Revenue (billion), by Packaging Format 2025 & 2033
- Figure 51: Middle East and Africa Shelf Stable Packaging Market Revenue Share (%), by Packaging Format 2025 & 2033
- Figure 52: Middle East and Africa Shelf Stable Packaging Market Revenue (billion), by Packaging Material 2025 & 2033
- Figure 53: Middle East and Africa Shelf Stable Packaging Market Revenue Share (%), by Packaging Material 2025 & 2033
- Figure 54: Middle East and Africa Shelf Stable Packaging Market Revenue (billion), by Product Type 2025 & 2033
- Figure 55: Middle East and Africa Shelf Stable Packaging Market Revenue Share (%), by Product Type 2025 & 2033
- Figure 56: Middle East and Africa Shelf Stable Packaging Market Revenue (billion), by Packaging Technology 2025 & 2033
- Figure 57: Middle East and Africa Shelf Stable Packaging Market Revenue Share (%), by Packaging Technology 2025 & 2033
- Figure 58: Middle East and Africa Shelf Stable Packaging Market Revenue (billion), by End User Industry 2025 & 2033
- Figure 59: Middle East and Africa Shelf Stable Packaging Market Revenue Share (%), by End User Industry 2025 & 2033
- Figure 60: Middle East and Africa Shelf Stable Packaging Market Revenue (billion), by Country 2025 & 2033
- Figure 61: Middle East and Africa Shelf Stable Packaging Market Revenue Share (%), by Country 2025 & 2033
List of Tables
- Table 1: Global Shelf Stable Packaging Market Revenue billion Forecast, by Packaging Format 2020 & 2033
- Table 2: Global Shelf Stable Packaging Market Revenue billion Forecast, by Packaging Material 2020 & 2033
- Table 3: Global Shelf Stable Packaging Market Revenue billion Forecast, by Product Type 2020 & 2033
- Table 4: Global Shelf Stable Packaging Market Revenue billion Forecast, by Packaging Technology 2020 & 2033
- Table 5: Global Shelf Stable Packaging Market Revenue billion Forecast, by End User Industry 2020 & 2033
- Table 6: Global Shelf Stable Packaging Market Revenue billion Forecast, by Region 2020 & 2033
- Table 7: Global Shelf Stable Packaging Market Revenue billion Forecast, by Packaging Format 2020 & 2033
- Table 8: Global Shelf Stable Packaging Market Revenue billion Forecast, by Packaging Material 2020 & 2033
- Table 9: Global Shelf Stable Packaging Market Revenue billion Forecast, by Product Type 2020 & 2033
- Table 10: Global Shelf Stable Packaging Market Revenue billion Forecast, by Packaging Technology 2020 & 2033
- Table 11: Global Shelf Stable Packaging Market Revenue billion Forecast, by End User Industry 2020 & 2033
- Table 12: Global Shelf Stable Packaging Market Revenue billion Forecast, by Country 2020 & 2033
- Table 13: Global Shelf Stable Packaging Market Revenue billion Forecast, by Packaging Format 2020 & 2033
- Table 14: Global Shelf Stable Packaging Market Revenue billion Forecast, by Packaging Material 2020 & 2033
- Table 15: Global Shelf Stable Packaging Market Revenue billion Forecast, by Product Type 2020 & 2033
- Table 16: Global Shelf Stable Packaging Market Revenue billion Forecast, by Packaging Technology 2020 & 2033
- Table 17: Global Shelf Stable Packaging Market Revenue billion Forecast, by End User Industry 2020 & 2033
- Table 18: Global Shelf Stable Packaging Market Revenue billion Forecast, by Country 2020 & 2033
- Table 19: Global Shelf Stable Packaging Market Revenue billion Forecast, by Packaging Format 2020 & 2033
- Table 20: Global Shelf Stable Packaging Market Revenue billion Forecast, by Packaging Material 2020 & 2033
- Table 21: Global Shelf Stable Packaging Market Revenue billion Forecast, by Product Type 2020 & 2033
- Table 22: Global Shelf Stable Packaging Market Revenue billion Forecast, by Packaging Technology 2020 & 2033
- Table 23: Global Shelf Stable Packaging Market Revenue billion Forecast, by End User Industry 2020 & 2033
- Table 24: Global Shelf Stable Packaging Market Revenue billion Forecast, by Country 2020 & 2033
- Table 25: Global Shelf Stable Packaging Market Revenue billion Forecast, by Packaging Format 2020 & 2033
- Table 26: Global Shelf Stable Packaging Market Revenue billion Forecast, by Packaging Material 2020 & 2033
- Table 27: Global Shelf Stable Packaging Market Revenue billion Forecast, by Product Type 2020 & 2033
- Table 28: Global Shelf Stable Packaging Market Revenue billion Forecast, by Packaging Technology 2020 & 2033
- Table 29: Global Shelf Stable Packaging Market Revenue billion Forecast, by End User Industry 2020 & 2033
- Table 30: Global Shelf Stable Packaging Market Revenue billion Forecast, by Country 2020 & 2033
- Table 31: Global Shelf Stable Packaging Market Revenue billion Forecast, by Packaging Format 2020 & 2033
- Table 32: Global Shelf Stable Packaging Market Revenue billion Forecast, by Packaging Material 2020 & 2033
- Table 33: Global Shelf Stable Packaging Market Revenue billion Forecast, by Product Type 2020 & 2033
- Table 34: Global Shelf Stable Packaging Market Revenue billion Forecast, by Packaging Technology 2020 & 2033
- Table 35: Global Shelf Stable Packaging Market Revenue billion Forecast, by End User Industry 2020 & 2033
- Table 36: Global Shelf Stable Packaging Market Revenue billion Forecast, by Country 2020 & 2033
Frequently Asked Questions
1. What is the projected Compound Annual Growth Rate (CAGR) of the Shelf Stable Packaging Market?
The projected CAGR is approximately 4.9%.
2. Which companies are prominent players in the Shelf Stable Packaging Market?
Key companies in the market include Ardagh Group, APAK, Reynolds Group, Spartech Corporation*List Not Exhaustive, Tetra Pak, PolyOne, Bemis Company Inc, Mondi Group, Amcor PLC, JHS Packaging, DuPont, Crown Holdings, Berry Global, Sealed Air Corporation, Silgan Holdings, Printpack, Portland Pet Food Company.
3. What are the main segments of the Shelf Stable Packaging Market?
The market segments include Packaging Format, Packaging Material, Product Type, Packaging Technology, End User Industry.
4. Can you provide details about the market size?
The market size is estimated to be USD 63.15 billion as of 2022.
5. What are some drivers contributing to market growth?
Increasing Demand to Reduce Cost of Cold Chain Logistics; Growing Demand for Ready-to-eat Food and Changing Consumer Lifestyle.
6. What are the notable trends driving market growth?
Aseptic Packaging is the Fastest-growing Packaging Technology.
7. Are there any restraints impacting market growth?
High Processing Requirements and Associated Costs.
8. Can you provide examples of recent developments in the market?
July 2022: Aseptic Liqui-Sure and Aseptic Flip-N-Seal were launched by Liquibox. These aseptic-ready fitments give brands the option of bag-in-box dispensing. Both of the new products are aseptic-capable dispensing fittings that establish and maintain a hermetic seal to preserve the safety and freshness of liquids.
9. What pricing options are available for accessing the report?
Pricing options include single-user, multi-user, and enterprise licenses priced at USD 4750, USD 5250, and USD 8750 respectively.
10. Is the market size provided in terms of value or volume?
The market size is provided in terms of value, measured in billion.
11. Are there any specific market keywords associated with the report?
Yes, the market keyword associated with the report is "Shelf Stable Packaging Market," which aids in identifying and referencing the specific market segment covered.
12. How do I determine which pricing option suits my needs best?
The pricing options vary based on user requirements and access needs. Individual users may opt for single-user licenses, while businesses requiring broader access may choose multi-user or enterprise licenses for cost-effective access to the report.
13. Are there any additional resources or data provided in the Shelf Stable Packaging Market report?
While the report offers comprehensive insights, it's advisable to review the specific contents or supplementary materials provided to ascertain if additional resources or data are available.
14. How can I stay updated on further developments or reports in the Shelf Stable Packaging Market?
To stay informed about further developments, trends, and reports in the Shelf Stable Packaging Market, consider subscribing to industry newsletters, following relevant companies and organizations, or regularly checking reputable industry news sources and publications.
Methodology
Step 1 - Identification of Relevant Samples Size from Population Database


Step 2 - Approaches for Defining Global Market Size (Value, Volume* & Price*)

Note*: In applicable scenarios
Step 3 - Data Sources
Primary Research
- Web Analytics
- Survey Reports
- Research Institute
- Latest Research Reports
- Opinion Leaders
Secondary Research
- Annual Reports
- White Paper
- Latest Press Release
- Industry Association
- Paid Database
- Investor Presentations

Step 4 - Data Triangulation
Involves using different sources of information in order to increase the validity of a study
These sources are likely to be stakeholders in a program - participants, other researchers, program staff, other community members, and so on.
Then we put all data in single framework & apply various statistical tools to find out the dynamic on the market.
During the analysis stage, feedback from the stakeholder groups would be compared to determine areas of agreement as well as areas of divergence