

Key Insights
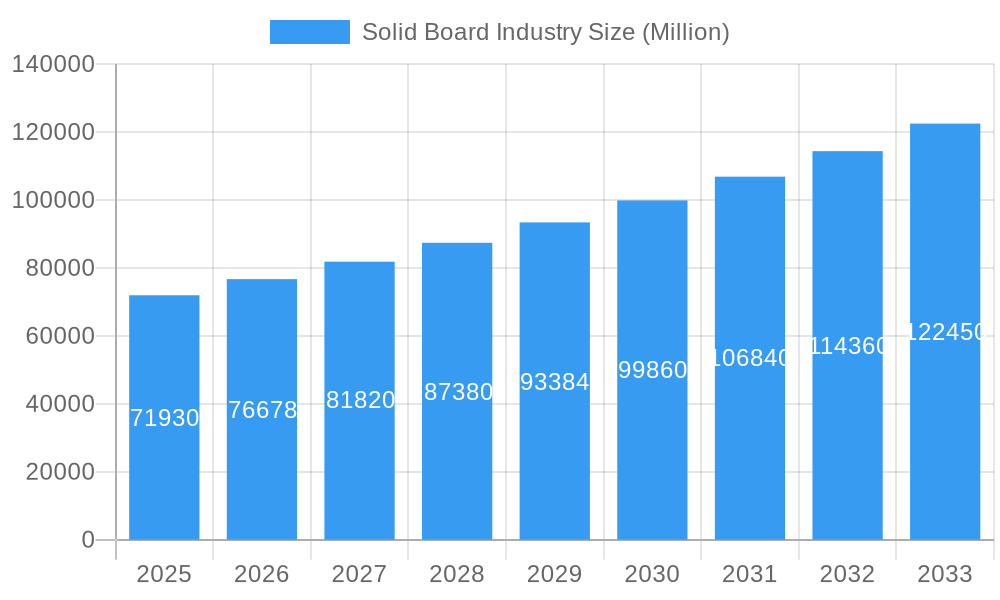
The global solid board market, valued at $71.93 billion in 2025, is projected to experience robust growth, driven by increasing demand across diverse end-use sectors. A compound annual growth rate (CAGR) of 6.47% from 2025 to 2033 indicates a significant expansion, fueled primarily by the burgeoning food and beverage industries, particularly in packaging for ready-to-eat meals and on-the-go consumables. The pharmaceutical and healthcare sectors also contribute substantially to market growth, driven by the need for safe and efficient packaging for sensitive medications and medical devices. Growth in e-commerce and online retail further boosts demand, requiring efficient and sustainable packaging solutions. The solid bleached board segment holds the largest market share, owing to its superior printability and aesthetic appeal, making it ideal for premium packaging applications. However, the increasing focus on sustainability and environmental concerns is expected to drive growth in eco-friendly alternatives like recycled and sustainably sourced solid unbleached board. Regional growth will vary, with developing economies in Asia exhibiting particularly strong growth due to rising disposable incomes and expanding consumer base. Competitive pressures are high, with leading players like Smurfit Kappa Group, WestRock, and International Paper vying for market share through innovation, strategic partnerships, and expansion into new markets.
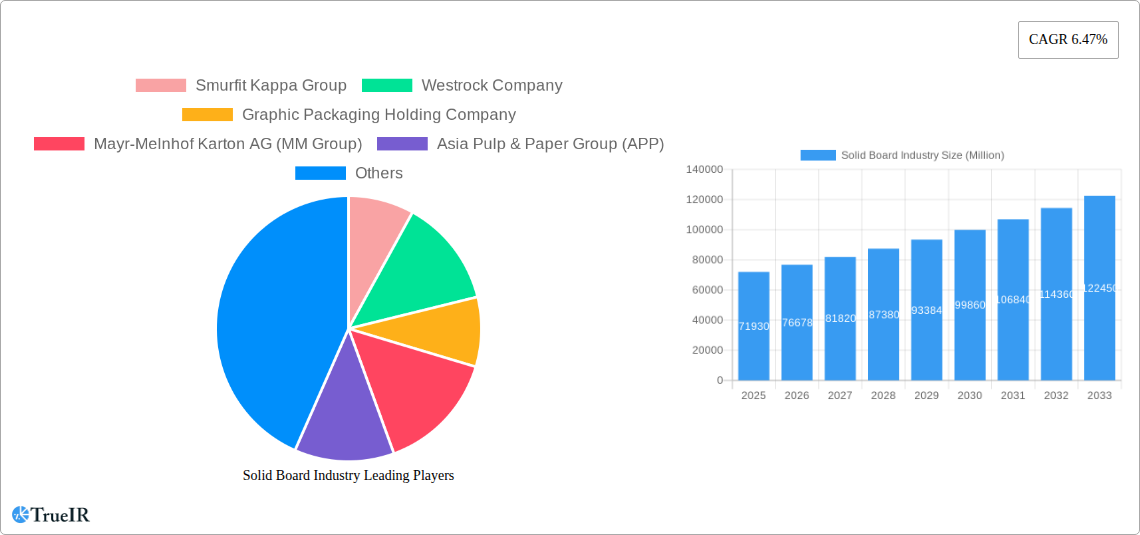
Solid Board Industry Market Size (In Billion)
The market's growth trajectory is influenced by several factors. The rising preference for convenient and ready-to-consume food items is a significant driver, leading to a surge in demand for food-service board and liquid packaging board. Furthermore, advancements in packaging technology, such as improved barrier properties and enhanced printing capabilities, are enhancing the appeal of solid board. However, fluctuating raw material prices, particularly pulp, and increased regulatory scrutiny regarding sustainable packaging practices represent significant challenges. The industry is actively adapting by investing in sustainable sourcing and manufacturing processes to mitigate these challenges and capitalize on growing environmental awareness among consumers. Future growth will depend on the balance between meeting rising consumer demand, managing raw material costs, and adhering to evolving environmental regulations. The market is poised for continued expansion, with innovations in materials and design continuously shaping its trajectory.
Solid Board Industry Company Market Share
Solid Board Industry Market Report: 2019-2033
This comprehensive report provides a detailed analysis of the global solid board industry, offering invaluable insights for businesses, investors, and stakeholders seeking to understand market dynamics, competitive landscapes, and future growth prospects. The study period spans from 2019 to 2033, with a base year of 2025 and a forecast period from 2025 to 2033. The report uses a combination of quantitative data and qualitative analysis to provide a holistic view of the industry. The market size is predicted to reach xx Million by 2033, demonstrating significant growth potential.
Solid Board Industry Market Structure & Competitive Landscape
The global solid board market is characterized by a moderately concentrated structure, with a few dominant players commanding a significant share. The Herfindahl-Hirschman Index (HHI) is estimated to be around xx, indicating a moderately concentrated market. Key players like Smurfit Kappa Group, Westrock Company, and Graphic Packaging Holding Company compete intensely through product innovation, cost optimization, and strategic acquisitions. Innovation is a crucial driver, with companies investing heavily in research and development to improve product quality, sustainability, and functionality. Regulatory pressures, such as those related to sustainability and waste management, significantly impact the industry, driving the adoption of eco-friendly practices. Product substitution is a concern, with alternatives like plastic packaging posing a threat, although the demand for sustainable packaging is mitigating this risk.
The market is segmented by product grade (Solid Bleached Board, Solid Unbleached Board, Folding Boxboard, White-lined Chipboard, Liquid Packaging Board, Food Service Board) and end-user (Beverage, Food, Pharmaceutical and Healthcare, Cosmetics and Toiletries, Tobacco). Mergers and acquisitions (M&A) activity remains robust, with an estimated xx Million in M&A volume during the historical period (2019-2024). These activities aim to expand market share, enhance product portfolios, and achieve economies of scale.
- Key Market Dynamics:
- High concentration ratio among major players.
- Increasing focus on sustainable packaging.
- Growing demand from the food and beverage sector.
- Significant M&A activity shaping market structure.
- Regulatory changes impacting production and packaging.
Solid Board Industry Market Trends & Opportunities
The solid board market is experiencing robust growth, driven by several key trends. The market is estimated to achieve a Compound Annual Growth Rate (CAGR) of xx% during the forecast period (2025-2033), reaching a projected value of xx Million by 2033. This growth is fueled by increasing demand from various end-use sectors, particularly the food and beverage industry, which is projected to witness a market penetration rate of xx%. Technological advancements in board manufacturing and packaging solutions are continuously improving product quality and efficiency. Consumer preferences are shifting towards sustainable and recyclable packaging, presenting significant opportunities for companies investing in eco-friendly materials and production processes. The competitive landscape is characterized by continuous innovation, leading to the introduction of new product grades and packaging solutions to meet diverse customer demands. This is creating a highly dynamic environment which pushes the need for more sustainable and efficient production methods. Market competition is intense, particularly among the top players. Product differentiation, cost effectiveness, and sustainability initiatives will be crucial for success.
Dominant Markets & Segments in Solid Board Industry
The Asia-Pacific region currently dominates the global solid board market, accounting for approximately xx% of the total market share in 2024. This dominance is attributed to rapid economic growth, increasing population, and expanding consumption of packaged goods. China, in particular, is a major consumer and producer of solid board. Within the product grade segments, Folding Boxboard and Solid Bleached Board dominate, driven by high demand from the food and beverage and pharmaceutical sectors. In terms of end-users, the food and beverage industry accounts for the largest market share, followed by the pharmaceutical and healthcare sectors.
- Key Growth Drivers in Asia-Pacific:
- Rapid economic growth and rising disposable incomes.
- Expanding food and beverage industry.
- Increasing demand for consumer goods.
- Favorable government policies supporting packaging industry growth.
Solid Board Industry Product Analysis
Innovation in the solid board industry centers on developing more sustainable, functional, and cost-effective products. Technological advancements such as improved coating techniques, enhanced barrier properties, and lighter weight materials are driving product differentiation. The market is seeing increased demand for recyclable and biodegradable options. These advancements are aimed at enhancing the shelf life of packaged goods and reducing the environmental impact of packaging. The success of new products depends on their ability to meet specific end-user needs, offering a balance between performance, cost, and environmental friendliness.
Key Drivers, Barriers & Challenges in Solid Board Industry
Key Drivers: The increasing demand for packaged goods across various sectors, coupled with technological advancements enabling the production of more sustainable and efficient packaging, are key drivers. Favorable government regulations promoting sustainable packaging are also fostering growth.
Key Barriers and Challenges: Fluctuations in raw material prices, stringent environmental regulations, and intense competition among key players pose significant challenges. Supply chain disruptions, particularly those related to raw material availability, can significantly impact production and profitability. These challenges demand efficient supply chain management and strategic responses to environmental regulations and competitive pressures. The estimated impact of supply chain disruptions on the market is around xx Million annually.
Growth Drivers in the Solid Board Industry Market
Strong growth is expected due to increased demand from the expanding food and beverage, pharmaceutical and healthcare, and cosmetic sectors. Technological advancements enabling more sustainable packaging solutions, and favorable government policies promoting sustainable packaging further fuel market expansion. The global shift towards e-commerce and its associated packaging demands is another crucial driver.
Challenges Impacting Solid Board Industry Growth
Significant challenges include fluctuating raw material prices, particularly pulp, which are expected to impact the industry by approximately xx Million annually. Stringent environmental regulations requiring compliance with sustainable packaging standards, as well as intense competition amongst major players and potential disruption from substitutes, represent ongoing concerns.
Key Players Shaping the Solid Board Industry Market
Significant Solid Board Industry Industry Milestones
- June 2023: Stora Enso opened a new corrugated board manufacturing facility in De Lier, Netherlands, expanding its Western Europe packaging solutions capacity and emphasizing sustainable operations.
- June 2023: Metsa Group launched Mouto 3D, a fiber-based packaging solution in collaboration with Mets Spring and Fiskars Group, showcasing innovation in sustainable and visually appealing packaging.
Future Outlook for Solid Board Industry Market
The future of the solid board industry is bright, driven by consistent growth across diverse end-use sectors and the industry's shift toward sustainable and innovative packaging solutions. Strategic investments in research and development, coupled with a focus on sustainability, will be crucial for players to thrive in a competitive market. Opportunities exist for companies that can effectively address the challenges related to supply chain resilience, regulatory compliance, and consumer demand for eco-friendly packaging. The market is poised for continued expansion, with significant opportunities for growth and innovation.
Solid Board Industry Segmentation
-
1. Product Grade
- 1.1. Solid Bleached Board
- 1.2. Solid Unbleached Board
- 1.3. Folding Boxboard
- 1.4. White-lined Chipboard
- 1.5. Liquid Packaging Board
- 1.6. Food Service Board
-
2. End-User
- 2.1. Beverage
- 2.2. Food
- 2.3. Pharmaceutical and Healthcare
- 2.4. Cosmetics and Toiletries
- 2.5. Tobacco
Solid Board Industry Segmentation By Geography
-
1. North America
- 1.1. United States
- 1.2. Canada
-
2. Europe
- 2.1. United Kingdom
- 2.2. Germany
- 2.3. France
- 2.4. Italy
- 2.5. Spain
-
3. Asia
- 3.1. China
- 3.2. India
- 3.3. Japan
- 3.4. Australia and New Zealand
-
4. Latin America
- 4.1. Brazil
- 4.2. Argentina
- 4.3. Mexico
-
5. Middle East and Africa
- 5.1. United Arab Emirates
- 5.2. Saudi Arabia
- 5.3. South Africa
- 5.4. Egypt
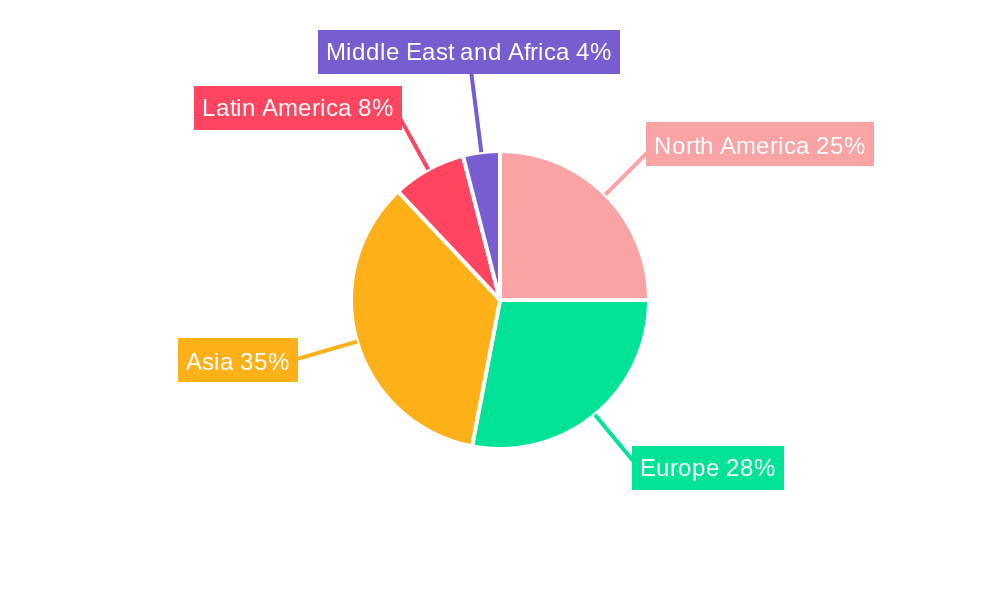
Solid Board Industry Regional Market Share
Geographic Coverage of Solid Board Industry
Solid Board Industry REPORT HIGHLIGHTS
| Aspects | Details |
|---|---|
| Study Period | 2020-2034 |
| Base Year | 2025 |
| Estimated Year | 2026 |
| Forecast Period | 2026-2034 |
| Historical Period | 2020-2025 |
| Growth Rate | CAGR of 6.47% from 2020-2034 |
| Segmentation |
|
Table of Contents
- 1. Introduction
- 1.1. Research Scope
- 1.2. Market Segmentation
- 1.3. Research Objective
- 1.4. Definitions and Assumptions
- 2. Executive Summary
- 2.1. Market Snapshot
- 3. Market Dynamics
- 3.1. Market Drivers
- 3.2. Market Restrains
- 3.3. Market Trends
- 3.4. Market Opportunities
- 4. Market Factor Analysis
- 4.1. Porters Five Forces
- 4.1.1. Bargaining Power of Suppliers
- 4.1.2. Bargaining Power of Buyers
- 4.1.3. Threat of New Entrants
- 4.1.4. Threat of Substitutes
- 4.1.5. Competitive Rivalry
- 4.2. PESTEL analysis
- 4.3. BCG Analysis
- 4.3.1. Stars (High Growth, High Market Share)
- 4.3.2. Cash Cows (Low Growth, High Market Share)
- 4.3.3. Question Mark (High Growth, Low Market Share)
- 4.3.4. Dogs (Low Growth, Low Market Share)
- 4.4. Ansoff Matrix Analysis
- 4.5. Supply Chain Analysis
- 4.6. Regulatory Landscape
- 4.7. Current Market Potential and Opportunity Assessment (TAM–SAM–SOM Framework)
- 4.8. TIR Analyst Note
- 4.1. Porters Five Forces
- 5. Market Analysis, Insights and Forecast 2021-2033
- 5.1. Market Analysis, Insights and Forecast - by Product Grade
- 5.1.1. Solid Bleached Board
- 5.1.2. Solid Unbleached Board
- 5.1.3. Folding Boxboard
- 5.1.4. White-lined Chipboard
- 5.1.5. Liquid Packaging Board
- 5.1.6. Food Service Board
- 5.2. Market Analysis, Insights and Forecast - by End-User
- 5.2.1. Beverage
- 5.2.2. Food
- 5.2.3. Pharmaceutical and Healthcare
- 5.2.4. Cosmetics and Toiletries
- 5.2.5. Tobacco
- 5.3. Market Analysis, Insights and Forecast - by Region
- 5.3.1. North America
- 5.3.2. Europe
- 5.3.3. Asia
- 5.3.4. Latin America
- 5.3.5. Middle East and Africa
- 5.1. Market Analysis, Insights and Forecast - by Product Grade
- 6. Global Solid Board Industry Analysis, Insights and Forecast, 2021-2033
- 6.1. Market Analysis, Insights and Forecast - by Product Grade
- 6.1.1. Solid Bleached Board
- 6.1.2. Solid Unbleached Board
- 6.1.3. Folding Boxboard
- 6.1.4. White-lined Chipboard
- 6.1.5. Liquid Packaging Board
- 6.1.6. Food Service Board
- 6.2. Market Analysis, Insights and Forecast - by End-User
- 6.2.1. Beverage
- 6.2.2. Food
- 6.2.3. Pharmaceutical and Healthcare
- 6.2.4. Cosmetics and Toiletries
- 6.2.5. Tobacco
- 6.1. Market Analysis, Insights and Forecast - by Product Grade
- 7. North America Solid Board Industry Analysis, Insights and Forecast, 2020-2032
- 7.1. Market Analysis, Insights and Forecast - by Product Grade
- 7.1.1. Solid Bleached Board
- 7.1.2. Solid Unbleached Board
- 7.1.3. Folding Boxboard
- 7.1.4. White-lined Chipboard
- 7.1.5. Liquid Packaging Board
- 7.1.6. Food Service Board
- 7.2. Market Analysis, Insights and Forecast - by End-User
- 7.2.1. Beverage
- 7.2.2. Food
- 7.2.3. Pharmaceutical and Healthcare
- 7.2.4. Cosmetics and Toiletries
- 7.2.5. Tobacco
- 7.1. Market Analysis, Insights and Forecast - by Product Grade
- 8. Europe Solid Board Industry Analysis, Insights and Forecast, 2020-2032
- 8.1. Market Analysis, Insights and Forecast - by Product Grade
- 8.1.1. Solid Bleached Board
- 8.1.2. Solid Unbleached Board
- 8.1.3. Folding Boxboard
- 8.1.4. White-lined Chipboard
- 8.1.5. Liquid Packaging Board
- 8.1.6. Food Service Board
- 8.2. Market Analysis, Insights and Forecast - by End-User
- 8.2.1. Beverage
- 8.2.2. Food
- 8.2.3. Pharmaceutical and Healthcare
- 8.2.4. Cosmetics and Toiletries
- 8.2.5. Tobacco
- 8.1. Market Analysis, Insights and Forecast - by Product Grade
- 9. Asia Solid Board Industry Analysis, Insights and Forecast, 2020-2032
- 9.1. Market Analysis, Insights and Forecast - by Product Grade
- 9.1.1. Solid Bleached Board
- 9.1.2. Solid Unbleached Board
- 9.1.3. Folding Boxboard
- 9.1.4. White-lined Chipboard
- 9.1.5. Liquid Packaging Board
- 9.1.6. Food Service Board
- 9.2. Market Analysis, Insights and Forecast - by End-User
- 9.2.1. Beverage
- 9.2.2. Food
- 9.2.3. Pharmaceutical and Healthcare
- 9.2.4. Cosmetics and Toiletries
- 9.2.5. Tobacco
- 9.1. Market Analysis, Insights and Forecast - by Product Grade
- 10. Latin America Solid Board Industry Analysis, Insights and Forecast, 2020-2032
- 10.1. Market Analysis, Insights and Forecast - by Product Grade
- 10.1.1. Solid Bleached Board
- 10.1.2. Solid Unbleached Board
- 10.1.3. Folding Boxboard
- 10.1.4. White-lined Chipboard
- 10.1.5. Liquid Packaging Board
- 10.1.6. Food Service Board
- 10.2. Market Analysis, Insights and Forecast - by End-User
- 10.2.1. Beverage
- 10.2.2. Food
- 10.2.3. Pharmaceutical and Healthcare
- 10.2.4. Cosmetics and Toiletries
- 10.2.5. Tobacco
- 10.1. Market Analysis, Insights and Forecast - by Product Grade
- 11. Middle East and Africa Solid Board Industry Analysis, Insights and Forecast, 2020-2032
- 11.1. Market Analysis, Insights and Forecast - by Product Grade
- 11.1.1. Solid Bleached Board
- 11.1.2. Solid Unbleached Board
- 11.1.3. Folding Boxboard
- 11.1.4. White-lined Chipboard
- 11.1.5. Liquid Packaging Board
- 11.1.6. Food Service Board
- 11.2. Market Analysis, Insights and Forecast - by End-User
- 11.2.1. Beverage
- 11.2.2. Food
- 11.2.3. Pharmaceutical and Healthcare
- 11.2.4. Cosmetics and Toiletries
- 11.2.5. Tobacco
- 11.1. Market Analysis, Insights and Forecast - by Product Grade
- 12. Competitive Analysis
- 12.1. Company Profiles
- 12.1.1 Smurfit Kappa Group
- 12.1.1.1. Company Overview
- 12.1.1.2. Products
- 12.1.1.3. Company Financials
- 12.1.1.4. SWOT Analysis
- 12.1.2 Westrock Company
- 12.1.2.1. Company Overview
- 12.1.2.2. Products
- 12.1.2.3. Company Financials
- 12.1.2.4. SWOT Analysis
- 12.1.3 Graphic Packaging Holding Company
- 12.1.3.1. Company Overview
- 12.1.3.2. Products
- 12.1.3.3. Company Financials
- 12.1.3.4. SWOT Analysis
- 12.1.4 Mayr-Melnhof Karton AG (MM Group)
- 12.1.4.1. Company Overview
- 12.1.4.2. Products
- 12.1.4.3. Company Financials
- 12.1.4.4. SWOT Analysis
- 12.1.5 Asia Pulp & Paper Group (APP)
- 12.1.5.1. Company Overview
- 12.1.5.2. Products
- 12.1.5.3. Company Financials
- 12.1.5.4. SWOT Analysis
- 12.1.6 Pankaboard OYJ*List Not Exhaustive
- 12.1.6.1. Company Overview
- 12.1.6.2. Products
- 12.1.6.3. Company Financials
- 12.1.6.4. SWOT Analysis
- 12.1.7 International Paper Company
- 12.1.7.1. Company Overview
- 12.1.7.2. Products
- 12.1.7.3. Company Financials
- 12.1.7.4. SWOT Analysis
- 12.1.8 Stora Enso OYJ
- 12.1.8.1. Company Overview
- 12.1.8.2. Products
- 12.1.8.3. Company Financials
- 12.1.8.4. SWOT Analysis
- 12.1.9 Metsa Board
- 12.1.9.1. Company Overview
- 12.1.9.2. Products
- 12.1.9.3. Company Financials
- 12.1.9.4. SWOT Analysis
- 12.1.10 Nine Dragons Paper Holdings Limited
- 12.1.10.1. Company Overview
- 12.1.10.2. Products
- 12.1.10.3. Company Financials
- 12.1.10.4. SWOT Analysis
- 12.1.1 Smurfit Kappa Group
- 12.2. Market Entropy
- 12.2.1 Company's Key Areas Served
- 12.2.2 Recent Developments
- 12.3. Company Market Share Analysis 2025
- 12.3.1 Top 5 Companies Market Share Analysis
- 12.3.2 Top 3 Companies Market Share Analysis
- 12.4. List of Potential Customers
- 13. Research Methodology
List of Figures
- Figure 1: Global Solid Board Industry Revenue Breakdown (Million, %) by Region 2025 & 2033
- Figure 2: North America Solid Board Industry Revenue (Million), by Product Grade 2025 & 2033
- Figure 3: North America Solid Board Industry Revenue Share (%), by Product Grade 2025 & 2033
- Figure 4: North America Solid Board Industry Revenue (Million), by End-User 2025 & 2033
- Figure 5: North America Solid Board Industry Revenue Share (%), by End-User 2025 & 2033
- Figure 6: North America Solid Board Industry Revenue (Million), by Country 2025 & 2033
- Figure 7: North America Solid Board Industry Revenue Share (%), by Country 2025 & 2033
- Figure 8: Europe Solid Board Industry Revenue (Million), by Product Grade 2025 & 2033
- Figure 9: Europe Solid Board Industry Revenue Share (%), by Product Grade 2025 & 2033
- Figure 10: Europe Solid Board Industry Revenue (Million), by End-User 2025 & 2033
- Figure 11: Europe Solid Board Industry Revenue Share (%), by End-User 2025 & 2033
- Figure 12: Europe Solid Board Industry Revenue (Million), by Country 2025 & 2033
- Figure 13: Europe Solid Board Industry Revenue Share (%), by Country 2025 & 2033
- Figure 14: Asia Solid Board Industry Revenue (Million), by Product Grade 2025 & 2033
- Figure 15: Asia Solid Board Industry Revenue Share (%), by Product Grade 2025 & 2033
- Figure 16: Asia Solid Board Industry Revenue (Million), by End-User 2025 & 2033
- Figure 17: Asia Solid Board Industry Revenue Share (%), by End-User 2025 & 2033
- Figure 18: Asia Solid Board Industry Revenue (Million), by Country 2025 & 2033
- Figure 19: Asia Solid Board Industry Revenue Share (%), by Country 2025 & 2033
- Figure 20: Latin America Solid Board Industry Revenue (Million), by Product Grade 2025 & 2033
- Figure 21: Latin America Solid Board Industry Revenue Share (%), by Product Grade 2025 & 2033
- Figure 22: Latin America Solid Board Industry Revenue (Million), by End-User 2025 & 2033
- Figure 23: Latin America Solid Board Industry Revenue Share (%), by End-User 2025 & 2033
- Figure 24: Latin America Solid Board Industry Revenue (Million), by Country 2025 & 2033
- Figure 25: Latin America Solid Board Industry Revenue Share (%), by Country 2025 & 2033
- Figure 26: Middle East and Africa Solid Board Industry Revenue (Million), by Product Grade 2025 & 2033
- Figure 27: Middle East and Africa Solid Board Industry Revenue Share (%), by Product Grade 2025 & 2033
- Figure 28: Middle East and Africa Solid Board Industry Revenue (Million), by End-User 2025 & 2033
- Figure 29: Middle East and Africa Solid Board Industry Revenue Share (%), by End-User 2025 & 2033
- Figure 30: Middle East and Africa Solid Board Industry Revenue (Million), by Country 2025 & 2033
- Figure 31: Middle East and Africa Solid Board Industry Revenue Share (%), by Country 2025 & 2033
List of Tables
- Table 1: Global Solid Board Industry Revenue Million Forecast, by Product Grade 2020 & 2033
- Table 2: Global Solid Board Industry Revenue Million Forecast, by End-User 2020 & 2033
- Table 3: Global Solid Board Industry Revenue Million Forecast, by Region 2020 & 2033
- Table 4: Global Solid Board Industry Revenue Million Forecast, by Product Grade 2020 & 2033
- Table 5: Global Solid Board Industry Revenue Million Forecast, by End-User 2020 & 2033
- Table 6: Global Solid Board Industry Revenue Million Forecast, by Country 2020 & 2033
- Table 7: United States Solid Board Industry Revenue (Million) Forecast, by Application 2020 & 2033
- Table 8: Canada Solid Board Industry Revenue (Million) Forecast, by Application 2020 & 2033
- Table 9: Global Solid Board Industry Revenue Million Forecast, by Product Grade 2020 & 2033
- Table 10: Global Solid Board Industry Revenue Million Forecast, by End-User 2020 & 2033
- Table 11: Global Solid Board Industry Revenue Million Forecast, by Country 2020 & 2033
- Table 12: United Kingdom Solid Board Industry Revenue (Million) Forecast, by Application 2020 & 2033
- Table 13: Germany Solid Board Industry Revenue (Million) Forecast, by Application 2020 & 2033
- Table 14: France Solid Board Industry Revenue (Million) Forecast, by Application 2020 & 2033
- Table 15: Italy Solid Board Industry Revenue (Million) Forecast, by Application 2020 & 2033
- Table 16: Spain Solid Board Industry Revenue (Million) Forecast, by Application 2020 & 2033
- Table 17: Global Solid Board Industry Revenue Million Forecast, by Product Grade 2020 & 2033
- Table 18: Global Solid Board Industry Revenue Million Forecast, by End-User 2020 & 2033
- Table 19: Global Solid Board Industry Revenue Million Forecast, by Country 2020 & 2033
- Table 20: China Solid Board Industry Revenue (Million) Forecast, by Application 2020 & 2033
- Table 21: India Solid Board Industry Revenue (Million) Forecast, by Application 2020 & 2033
- Table 22: Japan Solid Board Industry Revenue (Million) Forecast, by Application 2020 & 2033
- Table 23: Australia and New Zealand Solid Board Industry Revenue (Million) Forecast, by Application 2020 & 2033
- Table 24: Global Solid Board Industry Revenue Million Forecast, by Product Grade 2020 & 2033
- Table 25: Global Solid Board Industry Revenue Million Forecast, by End-User 2020 & 2033
- Table 26: Global Solid Board Industry Revenue Million Forecast, by Country 2020 & 2033
- Table 27: Brazil Solid Board Industry Revenue (Million) Forecast, by Application 2020 & 2033
- Table 28: Argentina Solid Board Industry Revenue (Million) Forecast, by Application 2020 & 2033
- Table 29: Mexico Solid Board Industry Revenue (Million) Forecast, by Application 2020 & 2033
- Table 30: Global Solid Board Industry Revenue Million Forecast, by Product Grade 2020 & 2033
- Table 31: Global Solid Board Industry Revenue Million Forecast, by End-User 2020 & 2033
- Table 32: Global Solid Board Industry Revenue Million Forecast, by Country 2020 & 2033
- Table 33: United Arab Emirates Solid Board Industry Revenue (Million) Forecast, by Application 2020 & 2033
- Table 34: Saudi Arabia Solid Board Industry Revenue (Million) Forecast, by Application 2020 & 2033
- Table 35: South Africa Solid Board Industry Revenue (Million) Forecast, by Application 2020 & 2033
- Table 36: Egypt Solid Board Industry Revenue (Million) Forecast, by Application 2020 & 2033
Frequently Asked Questions
1. What is the projected Compound Annual Growth Rate (CAGR) of the Solid Board Industry?
The projected CAGR is approximately 6.47%.
2. Which companies are prominent players in the Solid Board Industry?
Key companies in the market include Smurfit Kappa Group, Westrock Company, Graphic Packaging Holding Company, Mayr-Melnhof Karton AG (MM Group), Asia Pulp & Paper Group (APP), Pankaboard OYJ*List Not Exhaustive, International Paper Company, Stora Enso OYJ, Metsa Board, Nine Dragons Paper Holdings Limited.
3. What are the main segments of the Solid Board Industry?
The market segments include Product Grade, End-User.
4. Can you provide details about the market size?
The market size is estimated to be USD 71.93 Million as of 2022.
5. What are some drivers contributing to market growth?
Strong Demand from the E-commerce Sector; Growing Demand for Lightweight Materials and Scope for Printing Innovations Propelling Growth in the Personal Care Segment.
6. What are the notable trends driving market growth?
The Beverage Segment is Expected to Record the Fastest Growth.
7. Are there any restraints impacting market growth?
Increasing Operational Costs.
8. Can you provide examples of recent developments in the market?
June 2023: Stora Enso opened a new corrugated board manufacturing facility in De Lier, the Netherlands. The site was part of the De Jong Packaging Group acquisition, later known as the Western Europe business unit within the Packaging Solutions Division. This massive expansion was designed with a strong focus on sustainable operations.
9. What pricing options are available for accessing the report?
Pricing options include single-user, multi-user, and enterprise licenses priced at USD 4750, USD 5250, and USD 8750 respectively.
10. Is the market size provided in terms of value or volume?
The market size is provided in terms of value, measured in Million.
11. Are there any specific market keywords associated with the report?
Yes, the market keyword associated with the report is "Solid Board Industry," which aids in identifying and referencing the specific market segment covered.
12. How do I determine which pricing option suits my needs best?
The pricing options vary based on user requirements and access needs. Individual users may opt for single-user licenses, while businesses requiring broader access may choose multi-user or enterprise licenses for cost-effective access to the report.
13. Are there any additional resources or data provided in the Solid Board Industry report?
While the report offers comprehensive insights, it's advisable to review the specific contents or supplementary materials provided to ascertain if additional resources or data are available.
14. How can I stay updated on further developments or reports in the Solid Board Industry?
To stay informed about further developments, trends, and reports in the Solid Board Industry, consider subscribing to industry newsletters, following relevant companies and organizations, or regularly checking reputable industry news sources and publications.
Methodology
Step 1 - Identification of Relevant Samples Size from Population Database


Step 2 - Approaches for Defining Global Market Size (Value, Volume* & Price*)

Note*: In applicable scenarios
Step 3 - Data Sources
Primary Research
- Web Analytics
- Survey Reports
- Research Institute
- Latest Research Reports
- Opinion Leaders
Secondary Research
- Annual Reports
- White Paper
- Latest Press Release
- Industry Association
- Paid Database
- Investor Presentations

Step 4 - Data Triangulation
Involves using different sources of information in order to increase the validity of a study
These sources are likely to be stakeholders in a program - participants, other researchers, program staff, other community members, and so on.
Then we put all data in single framework & apply various statistical tools to find out the dynamic on the market.
During the analysis stage, feedback from the stakeholder groups would be compared to determine areas of agreement as well as areas of divergence