

Key Insights
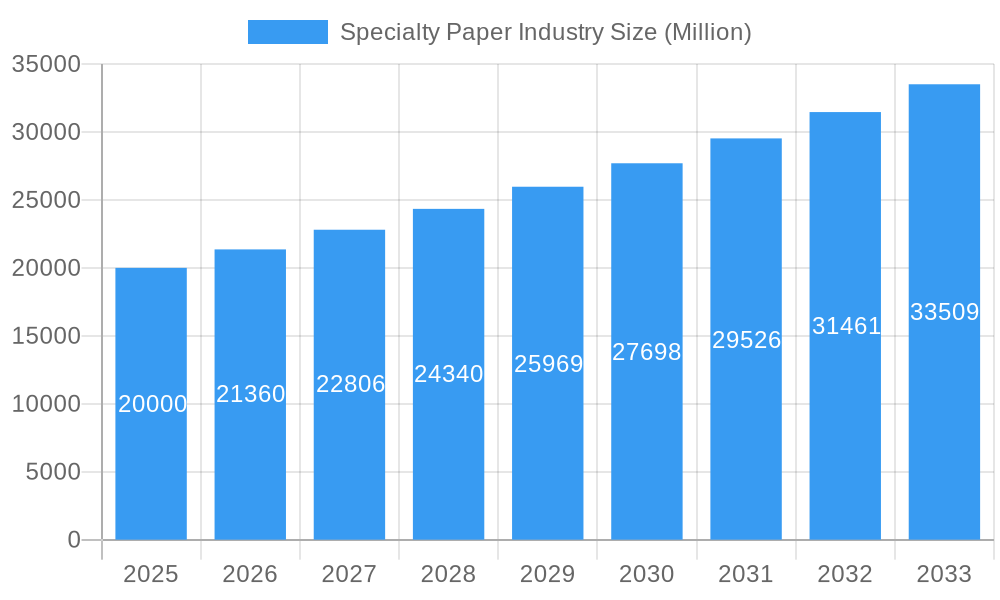
The global specialty paper market, valued at $18 billion in 2025, is projected for significant expansion at a compound annual growth rate (CAGR) of 5.1%. This growth is propelled by increasing demand for sustainable packaging, driven by the widespread adoption of kraft paper and other specialty grades across packaging & labeling, food service, and printing & publication sectors. The construction industry's robust activity and the surge in e-commerce further amplify demand for specialized paper solutions. Within market segments, kraft paper and container board lead due to their versatility and cost-effectiveness, while label and silicon-based papers are gaining traction for high-performance applications. Geographically, North America and Europe currently dominate, with the Asia-Pacific region poised for the fastest growth fueled by industrialization and rising consumer expenditure in China and India.
Specialty Paper Industry Market Size (In Billion)
While the market outlook is positive, potential restraints include raw material price volatility, particularly for pulp, and competition from alternative packaging materials like plastics. Stringent environmental regulations also necessitate investments in sustainable production, impacting operational costs. Despite these challenges, key industry players are strategically focusing on innovation, sustainability, and expansion into emerging markets to capitalize on the sustained growth anticipated for the specialty paper market.
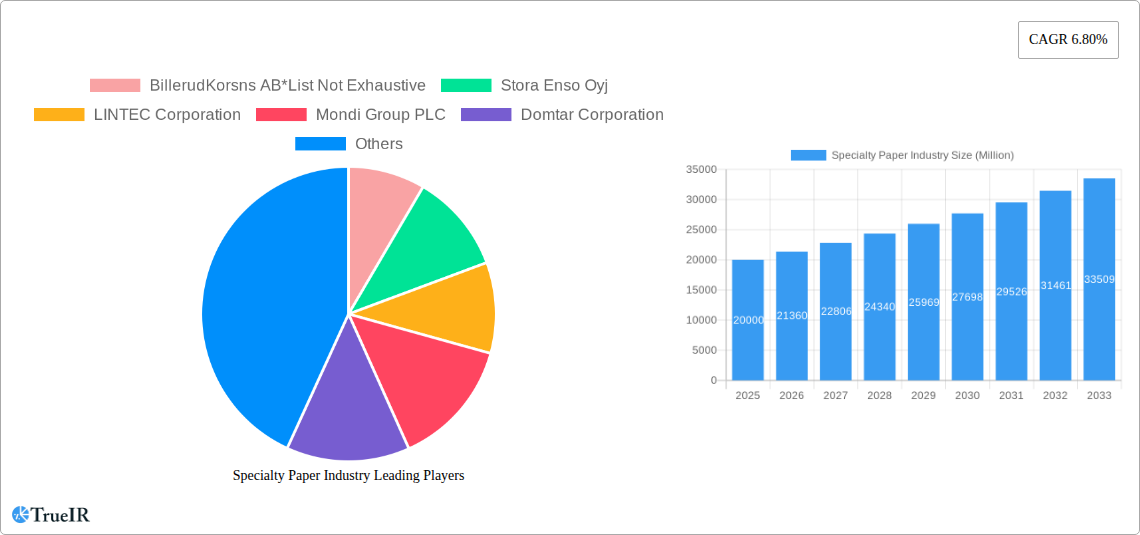
Specialty Paper Industry Company Market Share
Specialty Paper Industry Market Report: 2019-2033
This comprehensive report provides a detailed analysis of the global specialty paper industry, offering invaluable insights for businesses, investors, and researchers. Covering the period from 2019 to 2033, with a focus on 2025, this report examines market size, growth drivers, competitive dynamics, and future trends, presenting a robust forecast for the coming decade. Expect in-depth analysis of key players like BillerudKorsnäs AB, Stora Enso Oyj, and more, along with granular segmentation by end-user and paper type. This report is essential for anyone seeking to navigate the evolving landscape of the specialty paper market.
Specialty Paper Industry Market Structure & Competitive Landscape
The specialty paper industry exhibits a moderately concentrated market structure, with a few major players commanding significant market share. However, the presence of numerous smaller, specialized companies creates a dynamic competitive landscape. The industry is driven by continuous innovation in paper production technologies, particularly those focusing on sustainability and eco-friendly materials. Regulatory pressures, particularly concerning environmental protection and waste management, significantly influence industry practices and investment strategies. Product substitutes, such as plastics and digital alternatives, pose a considerable challenge, necessitating ongoing innovation and diversification.
- Market Concentration: The Herfindahl-Hirschman Index (HHI) for the global specialty paper market is estimated at xx, indicating a moderately concentrated market.
- Innovation Drivers: Growing demand for sustainable packaging, advancements in coating and surface treatment technologies, and the development of specialized paper for niche applications are key drivers.
- Regulatory Impacts: Stringent environmental regulations concerning emissions and waste disposal are shaping industry practices, driving investments in cleaner production methods.
- Product Substitutes: The rise of plastic alternatives and digitalization in printing and publishing presents significant competitive pressures.
- End-User Segmentation: Packaging and labeling constitutes the largest segment, followed by printing and publication, and food service.
- M&A Trends: The past five years have witnessed xx million in M&A activity within the industry, primarily driven by consolidation efforts and expansion into new market segments.
Specialty Paper Industry Market Trends & Opportunities
The global specialty paper market is projected to experience significant growth over the forecast period (2025-2033), with a Compound Annual Growth Rate (CAGR) of xx%. This growth is fueled by several key factors, including the increasing demand for sustainable packaging solutions, the expanding food service sector, and technological advancements in printing and publishing. Consumer preferences are shifting towards eco-friendly products, creating new opportunities for specialty paper manufacturers. The market penetration rate for sustainable specialty paper is expected to reach xx% by 2033. Intense competition necessitates continuous innovation and strategic partnerships to maintain market share.
Dominant Markets & Segments in Specialty Paper Industry
The Packaging & Labelling segment dominates the specialty paper market, driven by strong demand from the food and beverage, pharmaceutical, and consumer goods industries. Within paper types, Container Board/Paper Board and Label Paper are the leading segments, with significant growth projected for both. Geographically, North America and Europe currently hold the largest market shares, although Asia-Pacific is expected to witness rapid growth in the coming years.
- Key Growth Drivers:
- Packaging & Labelling: Rising e-commerce and the growing preference for sustainable packaging are driving demand.
- Food Service: Expanding fast-food and restaurant industries fuel demand for food packaging solutions.
- Printing & Publication: While declining in some areas, demand persists in niche segments like high-quality printing.
- Building & Construction: Specialty papers find applications in insulation, wallpaper, and other niche constructions.
- Asia-Pacific Growth: Rapid economic expansion and growing industrialization are boosting demand.
Specialty Paper Industry Product Analysis
The specialty paper industry is characterized by constant product innovation, focusing on enhanced functionality, sustainability, and cost-effectiveness. Advancements include improved barrier properties, specialized coatings for enhanced printability, and the development of biodegradable and compostable papers. These innovations cater to the growing demand for eco-friendly alternatives and specialized applications in various end-user industries.
Key Drivers, Barriers & Challenges in Specialty Paper Industry
Key Drivers: Growing demand from e-commerce and the food service sector, increasing awareness of sustainable packaging alternatives, and technological advancements in printing and coating techniques are key growth drivers. Government policies promoting sustainability are also playing a crucial role.
Key Challenges: Fluctuations in raw material prices, intense competition from alternative packaging materials (e.g., plastics), and environmental regulations impose significant challenges. Supply chain disruptions can severely impact production and profitability. xx% of manufacturers reported supply chain challenges in 2024.
Growth Drivers in the Specialty Paper Industry Market
The industry's growth is fueled by the increasing demand for sustainable packaging solutions, driven by environmental concerns and stringent regulations. Technological advancements in paper production, allowing for greater efficiency and customized products, are also key drivers. Expanding end-use sectors, such as food service and e-commerce, contribute to the overall market expansion.
Challenges Impacting Specialty Paper Industry Growth
The specialty paper industry faces challenges from fluctuating raw material costs, intense competition from substitute materials, and environmental regulations. Supply chain vulnerabilities and economic downturns can also significantly impact growth. The industry needs to adapt to these challenges through innovation, diversification, and sustainable practices.
Key Players Shaping the Specialty Paper Industry Market
- BillerudKorsnäs AB
- Stora Enso Oyj
- LINTEC Corporation
- Mondi Group PLC
- Domtar Corporation
- Sappi Limited
- Nippon Paper Industries Co Ltd
- ITC Limited
- Twin Rivers Paper Company
- Nordic Paper AS
Significant Specialty Paper Industry Industry Milestones
- November 2022: Sappi North America invested USD 418 million in its Somerset Mill, increasing capacity for solid bleached sulfate board, a sustainable packaging alternative.
- September 2022: Sappi Europe invested millions of Euros in its Gratkorn, Austria mill to expand wet-strength label paper production.
Future Outlook for Specialty Paper Industry Market
The specialty paper industry is poised for continued growth, driven by innovation in sustainable materials and expanding end-use applications. Strategic investments in research and development, coupled with a focus on eco-friendly practices, will shape the industry's future. The market presents significant opportunities for companies that can adapt to changing consumer preferences and regulatory landscapes.
Specialty Paper Industry Segmentation
-
1. Type
- 1.1. Kraft Paper
- 1.2. Container Board/Paper Board
- 1.3. Label Paper
- 1.4. Silicon-based Paper
- 1.5. Others
-
2. End-user Industry
- 2.1. Packaging & Labelling
- 2.2. Food Service
- 2.3. Printing & Publication
- 2.4. Building & Construction
- 2.5. Other En
Specialty Paper Industry Segmentation By Geography
-
1. North America
- 1.1. United States
- 1.2. Canada
-
2. Europe
- 2.1. Germany
- 2.2. United Kingdom
- 2.3. France
- 2.4. Rest of Europe
-
3. Asia Pacific
- 3.1. China
- 3.2. India
- 3.3. Japan
- 3.4. Rest of Asia Pacific
-
4. Latin America
- 4.1. Brazil
- 4.2. Mexico
- 4.3. Rest of Latin America
- 5. Middle East and Africa
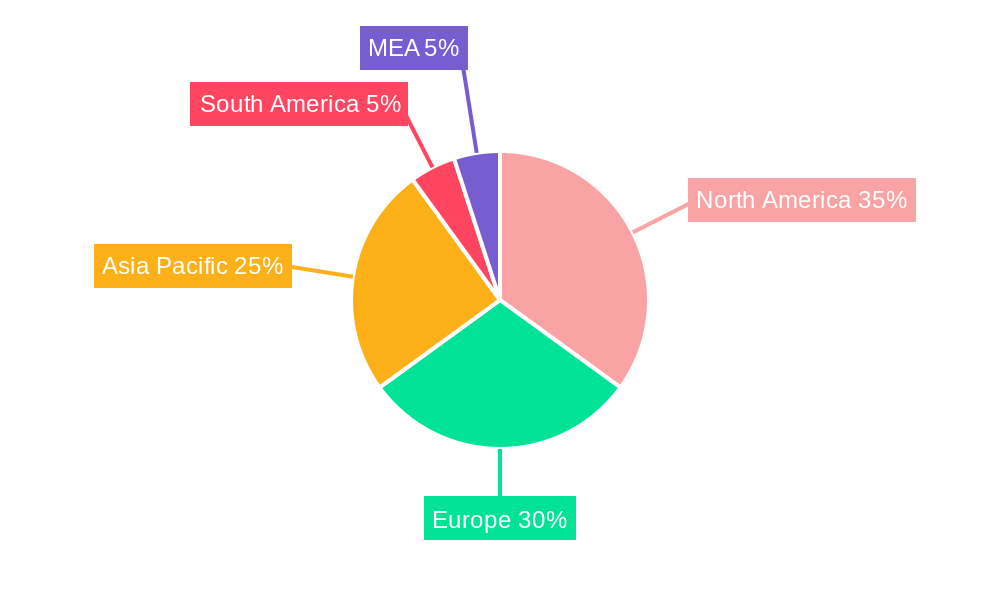
Specialty Paper Industry Regional Market Share
Geographic Coverage of Specialty Paper Industry
Specialty Paper Industry REPORT HIGHLIGHTS
| Aspects | Details |
|---|---|
| Study Period | 2020-2034 |
| Base Year | 2025 |
| Estimated Year | 2026 |
| Forecast Period | 2026-2034 |
| Historical Period | 2020-2025 |
| Growth Rate | CAGR of 5.1% from 2020-2034 |
| Segmentation |
|
Table of Contents
- 1. Introduction
- 1.1. Research Scope
- 1.2. Market Segmentation
- 1.3. Research Objective
- 1.4. Definitions and Assumptions
- 2. Executive Summary
- 2.1. Market Snapshot
- 3. Market Dynamics
- 3.1. Market Drivers
- 3.2. Market Restrains
- 3.3. Market Trends
- 3.4. Market Opportunities
- 4. Market Factor Analysis
- 4.1. Porters Five Forces
- 4.1.1. Bargaining Power of Suppliers
- 4.1.2. Bargaining Power of Buyers
- 4.1.3. Threat of New Entrants
- 4.1.4. Threat of Substitutes
- 4.1.5. Competitive Rivalry
- 4.2. PESTEL analysis
- 4.3. BCG Analysis
- 4.3.1. Stars (High Growth, High Market Share)
- 4.3.2. Cash Cows (Low Growth, High Market Share)
- 4.3.3. Question Mark (High Growth, Low Market Share)
- 4.3.4. Dogs (Low Growth, Low Market Share)
- 4.4. Ansoff Matrix Analysis
- 4.5. Supply Chain Analysis
- 4.6. Regulatory Landscape
- 4.7. Current Market Potential and Opportunity Assessment (TAM–SAM–SOM Framework)
- 4.8. TIR Analyst Note
- 4.1. Porters Five Forces
- 5. Market Analysis, Insights and Forecast 2021-2033
- 5.1. Market Analysis, Insights and Forecast - by Type
- 5.1.1. Kraft Paper
- 5.1.2. Container Board/Paper Board
- 5.1.3. Label Paper
- 5.1.4. Silicon-based Paper
- 5.1.5. Others
- 5.2. Market Analysis, Insights and Forecast - by End-user Industry
- 5.2.1. Packaging & Labelling
- 5.2.2. Food Service
- 5.2.3. Printing & Publication
- 5.2.4. Building & Construction
- 5.2.5. Other En
- 5.3. Market Analysis, Insights and Forecast - by Region
- 5.3.1. North America
- 5.3.2. Europe
- 5.3.3. Asia Pacific
- 5.3.4. Latin America
- 5.3.5. Middle East and Africa
- 5.1. Market Analysis, Insights and Forecast - by Type
- 6. Global Specialty Paper Industry Analysis, Insights and Forecast, 2021-2033
- 6.1. Market Analysis, Insights and Forecast - by Type
- 6.1.1. Kraft Paper
- 6.1.2. Container Board/Paper Board
- 6.1.3. Label Paper
- 6.1.4. Silicon-based Paper
- 6.1.5. Others
- 6.2. Market Analysis, Insights and Forecast - by End-user Industry
- 6.2.1. Packaging & Labelling
- 6.2.2. Food Service
- 6.2.3. Printing & Publication
- 6.2.4. Building & Construction
- 6.2.5. Other En
- 6.1. Market Analysis, Insights and Forecast - by Type
- 7. North America Specialty Paper Industry Analysis, Insights and Forecast, 2020-2032
- 7.1. Market Analysis, Insights and Forecast - by Type
- 7.1.1. Kraft Paper
- 7.1.2. Container Board/Paper Board
- 7.1.3. Label Paper
- 7.1.4. Silicon-based Paper
- 7.1.5. Others
- 7.2. Market Analysis, Insights and Forecast - by End-user Industry
- 7.2.1. Packaging & Labelling
- 7.2.2. Food Service
- 7.2.3. Printing & Publication
- 7.2.4. Building & Construction
- 7.2.5. Other En
- 7.1. Market Analysis, Insights and Forecast - by Type
- 8. Europe Specialty Paper Industry Analysis, Insights and Forecast, 2020-2032
- 8.1. Market Analysis, Insights and Forecast - by Type
- 8.1.1. Kraft Paper
- 8.1.2. Container Board/Paper Board
- 8.1.3. Label Paper
- 8.1.4. Silicon-based Paper
- 8.1.5. Others
- 8.2. Market Analysis, Insights and Forecast - by End-user Industry
- 8.2.1. Packaging & Labelling
- 8.2.2. Food Service
- 8.2.3. Printing & Publication
- 8.2.4. Building & Construction
- 8.2.5. Other En
- 8.1. Market Analysis, Insights and Forecast - by Type
- 9. Asia Pacific Specialty Paper Industry Analysis, Insights and Forecast, 2020-2032
- 9.1. Market Analysis, Insights and Forecast - by Type
- 9.1.1. Kraft Paper
- 9.1.2. Container Board/Paper Board
- 9.1.3. Label Paper
- 9.1.4. Silicon-based Paper
- 9.1.5. Others
- 9.2. Market Analysis, Insights and Forecast - by End-user Industry
- 9.2.1. Packaging & Labelling
- 9.2.2. Food Service
- 9.2.3. Printing & Publication
- 9.2.4. Building & Construction
- 9.2.5. Other En
- 9.1. Market Analysis, Insights and Forecast - by Type
- 10. Latin America Specialty Paper Industry Analysis, Insights and Forecast, 2020-2032
- 10.1. Market Analysis, Insights and Forecast - by Type
- 10.1.1. Kraft Paper
- 10.1.2. Container Board/Paper Board
- 10.1.3. Label Paper
- 10.1.4. Silicon-based Paper
- 10.1.5. Others
- 10.2. Market Analysis, Insights and Forecast - by End-user Industry
- 10.2.1. Packaging & Labelling
- 10.2.2. Food Service
- 10.2.3. Printing & Publication
- 10.2.4. Building & Construction
- 10.2.5. Other En
- 10.1. Market Analysis, Insights and Forecast - by Type
- 11. Middle East and Africa Specialty Paper Industry Analysis, Insights and Forecast, 2020-2032
- 11.1. Market Analysis, Insights and Forecast - by Type
- 11.1.1. Kraft Paper
- 11.1.2. Container Board/Paper Board
- 11.1.3. Label Paper
- 11.1.4. Silicon-based Paper
- 11.1.5. Others
- 11.2. Market Analysis, Insights and Forecast - by End-user Industry
- 11.2.1. Packaging & Labelling
- 11.2.2. Food Service
- 11.2.3. Printing & Publication
- 11.2.4. Building & Construction
- 11.2.5. Other En
- 11.1. Market Analysis, Insights and Forecast - by Type
- 12. Competitive Analysis
- 12.1. Company Profiles
- 12.1.1 BillerudKorsns AB*List Not Exhaustive
- 12.1.1.1. Company Overview
- 12.1.1.2. Products
- 12.1.1.3. Company Financials
- 12.1.1.4. SWOT Analysis
- 12.1.2 Stora Enso Oyj
- 12.1.2.1. Company Overview
- 12.1.2.2. Products
- 12.1.2.3. Company Financials
- 12.1.2.4. SWOT Analysis
- 12.1.3 LINTEC Corporation
- 12.1.3.1. Company Overview
- 12.1.3.2. Products
- 12.1.3.3. Company Financials
- 12.1.3.4. SWOT Analysis
- 12.1.4 Mondi Group PLC
- 12.1.4.1. Company Overview
- 12.1.4.2. Products
- 12.1.4.3. Company Financials
- 12.1.4.4. SWOT Analysis
- 12.1.5 Domtar Corporation
- 12.1.5.1. Company Overview
- 12.1.5.2. Products
- 12.1.5.3. Company Financials
- 12.1.5.4. SWOT Analysis
- 12.1.6 Sappi Limited
- 12.1.6.1. Company Overview
- 12.1.6.2. Products
- 12.1.6.3. Company Financials
- 12.1.6.4. SWOT Analysis
- 12.1.7 Nippon Paper Industries Co Ltd
- 12.1.7.1. Company Overview
- 12.1.7.2. Products
- 12.1.7.3. Company Financials
- 12.1.7.4. SWOT Analysis
- 12.1.8 ITC Limited
- 12.1.8.1. Company Overview
- 12.1.8.2. Products
- 12.1.8.3. Company Financials
- 12.1.8.4. SWOT Analysis
- 12.1.9 Twin Rivers Paper Company
- 12.1.9.1. Company Overview
- 12.1.9.2. Products
- 12.1.9.3. Company Financials
- 12.1.9.4. SWOT Analysis
- 12.1.10 Nordic Paper AS
- 12.1.10.1. Company Overview
- 12.1.10.2. Products
- 12.1.10.3. Company Financials
- 12.1.10.4. SWOT Analysis
- 12.1.1 BillerudKorsns AB*List Not Exhaustive
- 12.2. Market Entropy
- 12.2.1 Company's Key Areas Served
- 12.2.2 Recent Developments
- 12.3. Company Market Share Analysis 2025
- 12.3.1 Top 5 Companies Market Share Analysis
- 12.3.2 Top 3 Companies Market Share Analysis
- 12.4. List of Potential Customers
- 13. Research Methodology
List of Figures
- Figure 1: Global Specialty Paper Industry Revenue Breakdown (billion, %) by Region 2025 & 2033
- Figure 2: North America Specialty Paper Industry Revenue (billion), by Type 2025 & 2033
- Figure 3: North America Specialty Paper Industry Revenue Share (%), by Type 2025 & 2033
- Figure 4: North America Specialty Paper Industry Revenue (billion), by End-user Industry 2025 & 2033
- Figure 5: North America Specialty Paper Industry Revenue Share (%), by End-user Industry 2025 & 2033
- Figure 6: North America Specialty Paper Industry Revenue (billion), by Country 2025 & 2033
- Figure 7: North America Specialty Paper Industry Revenue Share (%), by Country 2025 & 2033
- Figure 8: Europe Specialty Paper Industry Revenue (billion), by Type 2025 & 2033
- Figure 9: Europe Specialty Paper Industry Revenue Share (%), by Type 2025 & 2033
- Figure 10: Europe Specialty Paper Industry Revenue (billion), by End-user Industry 2025 & 2033
- Figure 11: Europe Specialty Paper Industry Revenue Share (%), by End-user Industry 2025 & 2033
- Figure 12: Europe Specialty Paper Industry Revenue (billion), by Country 2025 & 2033
- Figure 13: Europe Specialty Paper Industry Revenue Share (%), by Country 2025 & 2033
- Figure 14: Asia Pacific Specialty Paper Industry Revenue (billion), by Type 2025 & 2033
- Figure 15: Asia Pacific Specialty Paper Industry Revenue Share (%), by Type 2025 & 2033
- Figure 16: Asia Pacific Specialty Paper Industry Revenue (billion), by End-user Industry 2025 & 2033
- Figure 17: Asia Pacific Specialty Paper Industry Revenue Share (%), by End-user Industry 2025 & 2033
- Figure 18: Asia Pacific Specialty Paper Industry Revenue (billion), by Country 2025 & 2033
- Figure 19: Asia Pacific Specialty Paper Industry Revenue Share (%), by Country 2025 & 2033
- Figure 20: Latin America Specialty Paper Industry Revenue (billion), by Type 2025 & 2033
- Figure 21: Latin America Specialty Paper Industry Revenue Share (%), by Type 2025 & 2033
- Figure 22: Latin America Specialty Paper Industry Revenue (billion), by End-user Industry 2025 & 2033
- Figure 23: Latin America Specialty Paper Industry Revenue Share (%), by End-user Industry 2025 & 2033
- Figure 24: Latin America Specialty Paper Industry Revenue (billion), by Country 2025 & 2033
- Figure 25: Latin America Specialty Paper Industry Revenue Share (%), by Country 2025 & 2033
- Figure 26: Middle East and Africa Specialty Paper Industry Revenue (billion), by Type 2025 & 2033
- Figure 27: Middle East and Africa Specialty Paper Industry Revenue Share (%), by Type 2025 & 2033
- Figure 28: Middle East and Africa Specialty Paper Industry Revenue (billion), by End-user Industry 2025 & 2033
- Figure 29: Middle East and Africa Specialty Paper Industry Revenue Share (%), by End-user Industry 2025 & 2033
- Figure 30: Middle East and Africa Specialty Paper Industry Revenue (billion), by Country 2025 & 2033
- Figure 31: Middle East and Africa Specialty Paper Industry Revenue Share (%), by Country 2025 & 2033
List of Tables
- Table 1: Global Specialty Paper Industry Revenue billion Forecast, by Type 2020 & 2033
- Table 2: Global Specialty Paper Industry Revenue billion Forecast, by End-user Industry 2020 & 2033
- Table 3: Global Specialty Paper Industry Revenue billion Forecast, by Region 2020 & 2033
- Table 4: Global Specialty Paper Industry Revenue billion Forecast, by Type 2020 & 2033
- Table 5: Global Specialty Paper Industry Revenue billion Forecast, by End-user Industry 2020 & 2033
- Table 6: Global Specialty Paper Industry Revenue billion Forecast, by Country 2020 & 2033
- Table 7: United States Specialty Paper Industry Revenue (billion) Forecast, by Application 2020 & 2033
- Table 8: Canada Specialty Paper Industry Revenue (billion) Forecast, by Application 2020 & 2033
- Table 9: Global Specialty Paper Industry Revenue billion Forecast, by Type 2020 & 2033
- Table 10: Global Specialty Paper Industry Revenue billion Forecast, by End-user Industry 2020 & 2033
- Table 11: Global Specialty Paper Industry Revenue billion Forecast, by Country 2020 & 2033
- Table 12: Germany Specialty Paper Industry Revenue (billion) Forecast, by Application 2020 & 2033
- Table 13: United Kingdom Specialty Paper Industry Revenue (billion) Forecast, by Application 2020 & 2033
- Table 14: France Specialty Paper Industry Revenue (billion) Forecast, by Application 2020 & 2033
- Table 15: Rest of Europe Specialty Paper Industry Revenue (billion) Forecast, by Application 2020 & 2033
- Table 16: Global Specialty Paper Industry Revenue billion Forecast, by Type 2020 & 2033
- Table 17: Global Specialty Paper Industry Revenue billion Forecast, by End-user Industry 2020 & 2033
- Table 18: Global Specialty Paper Industry Revenue billion Forecast, by Country 2020 & 2033
- Table 19: China Specialty Paper Industry Revenue (billion) Forecast, by Application 2020 & 2033
- Table 20: India Specialty Paper Industry Revenue (billion) Forecast, by Application 2020 & 2033
- Table 21: Japan Specialty Paper Industry Revenue (billion) Forecast, by Application 2020 & 2033
- Table 22: Rest of Asia Pacific Specialty Paper Industry Revenue (billion) Forecast, by Application 2020 & 2033
- Table 23: Global Specialty Paper Industry Revenue billion Forecast, by Type 2020 & 2033
- Table 24: Global Specialty Paper Industry Revenue billion Forecast, by End-user Industry 2020 & 2033
- Table 25: Global Specialty Paper Industry Revenue billion Forecast, by Country 2020 & 2033
- Table 26: Brazil Specialty Paper Industry Revenue (billion) Forecast, by Application 2020 & 2033
- Table 27: Mexico Specialty Paper Industry Revenue (billion) Forecast, by Application 2020 & 2033
- Table 28: Rest of Latin America Specialty Paper Industry Revenue (billion) Forecast, by Application 2020 & 2033
- Table 29: Global Specialty Paper Industry Revenue billion Forecast, by Type 2020 & 2033
- Table 30: Global Specialty Paper Industry Revenue billion Forecast, by End-user Industry 2020 & 2033
- Table 31: Global Specialty Paper Industry Revenue billion Forecast, by Country 2020 & 2033
Frequently Asked Questions
1. What is the projected Compound Annual Growth Rate (CAGR) of the Specialty Paper Industry?
The projected CAGR is approximately 5.1%.
2. Which companies are prominent players in the Specialty Paper Industry?
Key companies in the market include BillerudKorsns AB*List Not Exhaustive, Stora Enso Oyj, LINTEC Corporation, Mondi Group PLC, Domtar Corporation, Sappi Limited, Nippon Paper Industries Co Ltd, ITC Limited, Twin Rivers Paper Company, Nordic Paper AS.
3. What are the main segments of the Specialty Paper Industry?
The market segments include Type, End-user Industry.
4. Can you provide details about the market size?
The market size is estimated to be USD 18 billion as of 2022.
5. What are some drivers contributing to market growth?
Rising Trend of Online Food Ordering; Changing Consumer Preference to Adopt Sustainable Decorative Lamination.
6. What are the notable trends driving market growth?
Food Service Industry is Expected to hold Significant Share.
7. Are there any restraints impacting market growth?
Greenhouse Gas Emission Due To Dairy Activities Leading To Legislative Issues.
8. Can you provide examples of recent developments in the market?
November 2022: Sappi North America announced the investment of USD 418 million in paper machine rebuilds at its Somerset Mill in Skowhegan. With this investment, the company is focusing on increasing Paper Machine No. 2's capacity to produce solid bleached sulfate board products, a sustainable alternative to plastic packaging. This move of the company indicates its long-term Thrive25 strategy, which focuses on growing its portfolio in packaging and speciality papers, pulp, and biomaterials.
9. What pricing options are available for accessing the report?
Pricing options include single-user, multi-user, and enterprise licenses priced at USD 4750, USD 5250, and USD 8750 respectively.
10. Is the market size provided in terms of value or volume?
The market size is provided in terms of value, measured in billion.
11. Are there any specific market keywords associated with the report?
Yes, the market keyword associated with the report is "Specialty Paper Industry," which aids in identifying and referencing the specific market segment covered.
12. How do I determine which pricing option suits my needs best?
The pricing options vary based on user requirements and access needs. Individual users may opt for single-user licenses, while businesses requiring broader access may choose multi-user or enterprise licenses for cost-effective access to the report.
13. Are there any additional resources or data provided in the Specialty Paper Industry report?
While the report offers comprehensive insights, it's advisable to review the specific contents or supplementary materials provided to ascertain if additional resources or data are available.
14. How can I stay updated on further developments or reports in the Specialty Paper Industry?
To stay informed about further developments, trends, and reports in the Specialty Paper Industry, consider subscribing to industry newsletters, following relevant companies and organizations, or regularly checking reputable industry news sources and publications.
Methodology
Step 1 - Identification of Relevant Samples Size from Population Database


Step 2 - Approaches for Defining Global Market Size (Value, Volume* & Price*)

Note*: In applicable scenarios
Step 3 - Data Sources
Primary Research
- Web Analytics
- Survey Reports
- Research Institute
- Latest Research Reports
- Opinion Leaders
Secondary Research
- Annual Reports
- White Paper
- Latest Press Release
- Industry Association
- Paid Database
- Investor Presentations

Step 4 - Data Triangulation
Involves using different sources of information in order to increase the validity of a study
These sources are likely to be stakeholders in a program - participants, other researchers, program staff, other community members, and so on.
Then we put all data in single framework & apply various statistical tools to find out the dynamic on the market.
During the analysis stage, feedback from the stakeholder groups would be compared to determine areas of agreement as well as areas of divergence