

Key Insights
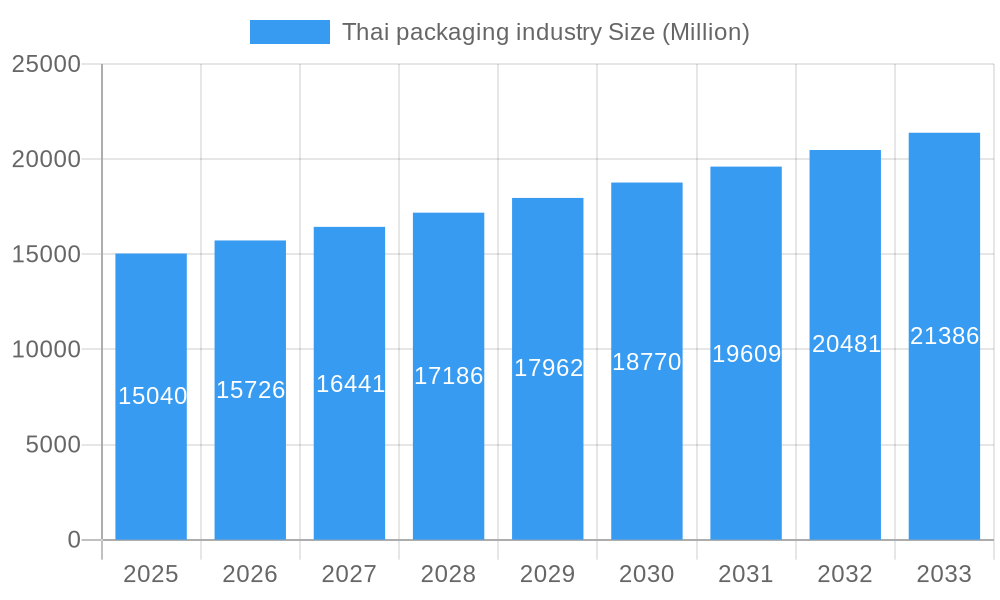
The Thai packaging industry, valued at $15.04 billion in 2025, is projected to experience robust growth, exhibiting a compound annual growth rate (CAGR) of 4.46% from 2025 to 2033. This expansion is driven by several key factors. The burgeoning food and beverage sector, coupled with a rising consumer base and increasing demand for convenient, aesthetically pleasing packaging, significantly fuels market growth. Furthermore, the expanding e-commerce landscape necessitates efficient and protective packaging solutions, contributing to market expansion. The preference for sustainable packaging materials, such as recycled paper and biodegradable plastics, presents a significant trend, influencing manufacturers to adopt eco-friendly practices. However, fluctuating raw material prices and stringent environmental regulations pose challenges to industry players. Segmentation reveals a diverse market, with plastic remaining a dominant packaging material, followed by paper and paperboard. Key applications are concentrated in the food and beverage, beauty and personal care, and pharmaceutical sectors. Leading players like Amcor PLC, SCG Packaging, and Huhtamaki Flexible Packaging are driving innovation and competition, while smaller local businesses cater to niche demands. The Asia-Pacific region, including Thailand, dominates global market share due to its substantial manufacturing base and burgeoning consumer markets.
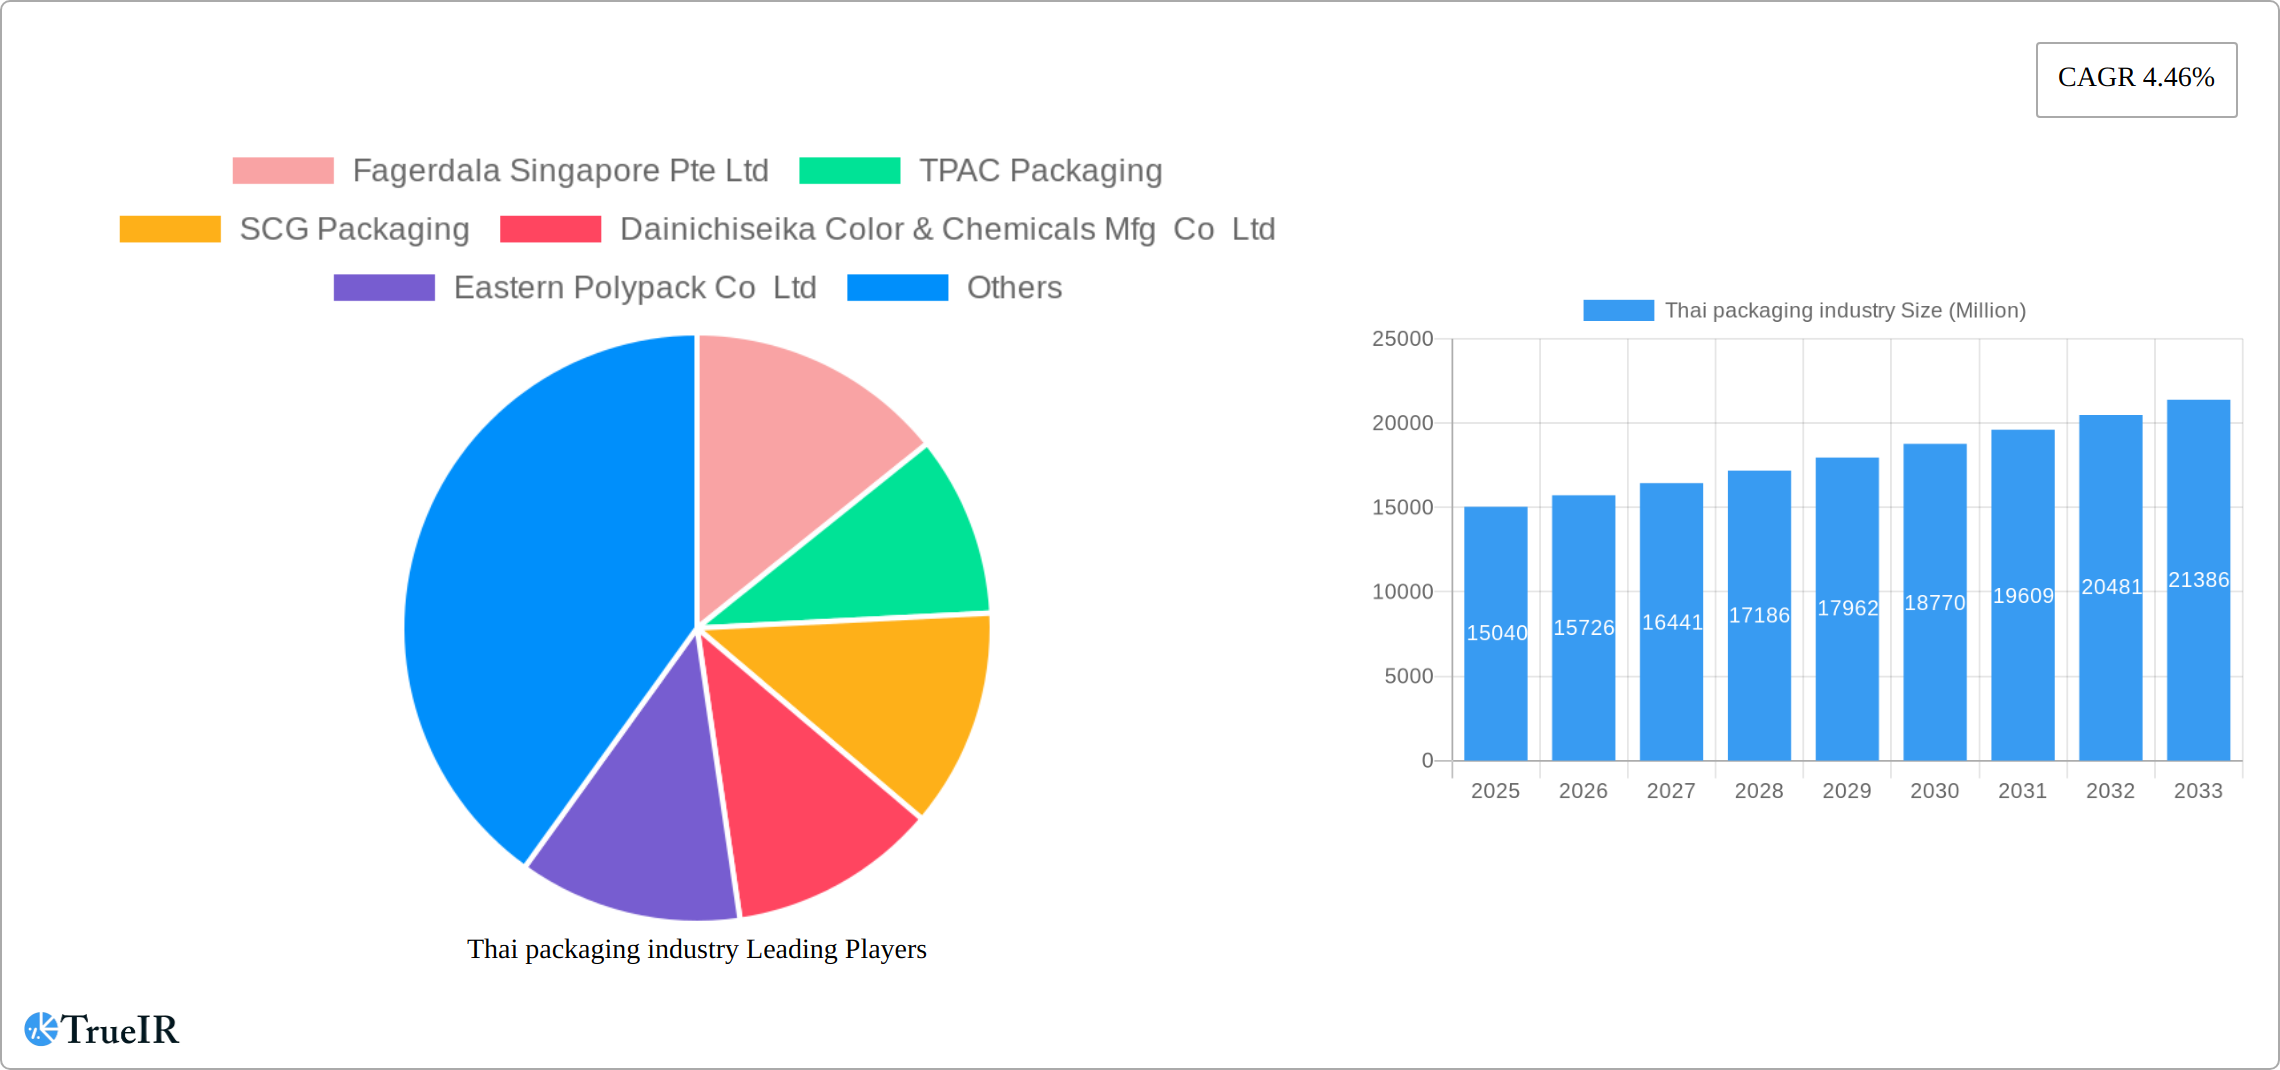
Thai packaging industry Market Size (In Billion)
The forecast for the Thai packaging industry remains positive. Continued economic growth, rising disposable incomes, and increasing urbanization are likely to bolster demand for diverse packaging solutions. The industry’s responsiveness to sustainable practices and technological advancements (e.g., improved printing techniques, automated packaging lines) will shape its future trajectory. While challenges persist in terms of raw material costs and environmental regulations, strategic investments in innovation and sustainable practices will enable Thai packaging companies to maintain their competitive edge and capitalize on the expanding global market. The continued emphasis on food safety and hygiene standards will also play a crucial role in shaping future demand, pushing for advanced packaging technologies and enhanced quality control.
Thai packaging industry Company Market Share
Dynamic Thai Packaging Industry Report: 2019-2033
This comprehensive report provides a detailed analysis of the Thai packaging industry, offering invaluable insights for businesses, investors, and stakeholders. With a focus on market trends, competitive landscapes, and future growth projections, this report utilizes data from the historical period (2019-2024), base year (2025), and forecast period (2025-2033) to deliver a robust and actionable overview. The report's value is enhanced by its incorporation of high-volume keywords, ensuring maximum visibility within search engine results. The market size is projected to reach xx Million USD by 2033.
Thai packaging industry Market Structure & Competitive Landscape
The Thai packaging industry presents a moderately concentrated market structure, characterized by a dynamic interplay between established multinational corporations and agile domestic players vying for market share. While precise figures require ongoing analysis, the industry's Herfindahl-Hirschman Index (HHI) suggests a moderately concentrated landscape, reflecting both the presence of significant players and opportunities for smaller businesses. Key drivers of innovation include the increasing adoption of sustainable packaging solutions, the integration of automation technologies in manufacturing processes, and ongoing advancements in materials science. This competitive landscape is further shaped by stringent regulatory frameworks governing material composition and waste management, significantly impacting operational strategies and investment decisions. Competition from substitute materials is also notable, particularly within specific niche segments. Mergers and acquisitions (M&A) activity has shown moderate levels of activity in recent years, with a significant number of transactions recorded between 2019 and 2024, predominantly focused on expanding product portfolios and geographical reach, thereby consolidating market positions and driving further consolidation.
End-user segmentation is diverse and robust, with significant demand emanating from key sectors including food & beverage, pharmaceutical, and industrial applications. The interplay of these factors creates a complex and evolving market requiring adaptability and strategic foresight.
- Market Concentration: Moderately concentrated (HHI: *requires update with current data*)
- Innovation Drivers: Sustainable packaging, automation, advanced materials science
- Regulatory Impacts: Stringent regulations on material composition and waste management, impacting operational costs and sustainability initiatives.
- Product Substitutes: Competitive pressure from alternative materials is evident in specific market niches.
- End-User Segmentation: Food & Beverage, Pharmaceutical, and Industrial sectors are primary demand drivers.
- M&A Trends: Significant transactions (2019-2024) demonstrate consolidation trends focused on expansion and market share enhancement. *requires update with precise number of transactions*
Thai packaging industry Market Trends & Opportunities
The Thai packaging market exhibits robust growth, projected to maintain a healthy Compound Annual Growth Rate (CAGR) of *requires update with current CAGR* from 2025 to 2033. This sustained expansion is fueled by several key factors: rising consumer spending, a corresponding increase in demand for packaged goods across various sectors, and the explosive growth of e-commerce, significantly boosting demand for protective and efficient packaging solutions. Technological advancements, including the increasing adoption of flexible packaging and the emergence of smart packaging solutions, are fundamentally reshaping the industry's landscape. Growing consumer preference for sustainable and convenient packaging options presents a major opportunity, driving innovation in eco-friendly materials, design, and supply chain optimization. The highly competitive nature of the market necessitates continuous innovation, operational efficiency improvements, and a proactive approach to sustainability to maintain profitability and market share. Market penetration rates vary significantly across different packaging types, with flexible packaging demonstrating substantial growth potential while rigid packaging remains a cornerstone of the industry.
Dominant Markets & Segments in Thai packaging industry
The Thai packaging industry displays strong growth across various segments, though dominance varies by category.
- By End User: The food and beverage sector holds the largest market share, followed by the pharmaceutical and industrial sectors. Growth in these segments is primarily fueled by rising incomes and evolving consumer lifestyles.
- By Packaging Material: Plastic remains the most dominant material due to its versatility and affordability. However, increasing environmental concerns are driving a shift towards more sustainable alternatives like paper and paperboard.
- By Packaging Type: Flexible packaging is experiencing significant growth due to its cost-effectiveness and adaptability, while rigid packaging maintains a substantial presence due to its protective qualities.
Key Growth Drivers (by segment):
- Food & Beverage: Rising disposable incomes, changing consumer preferences, increasing food processing.
- Pharmaceutical: Strict regulations, focus on product safety and hygiene, growing healthcare sector.
- Plastic Packaging: Low cost, versatility, and ease of manufacturing.
- Paper & Paperboard Packaging: Growing environmental consciousness, government regulations favoring sustainable materials.
Thai packaging industry Product Analysis
The Thai packaging industry showcases a diverse range of product innovations, focusing on enhanced functionality, sustainability, and cost-effectiveness. Advancements in flexible packaging materials, such as biodegradable plastics and compostable films, address growing environmental concerns. Smart packaging solutions incorporating features like RFID tags and temperature sensors enhance supply chain management and product traceability. These innovations are strategically aligned to meet diverse consumer needs, providing competitive advantages in terms of functionality and sustainability.
Key Drivers, Barriers & Challenges in Thai packaging industry
Key Drivers:
- Economic growth and rising disposable incomes: An expanding consumer base fuels demand for packaged goods.
- Technological advancements: Automation and innovative packaging solutions enhance efficiency and sustainability, reducing costs and environmental impact.
- Supportive government initiatives: Policies promoting sustainable packaging and waste management create a favorable regulatory environment.
- E-commerce expansion: The booming e-commerce sector drives demand for protective and convenient packaging.
Key Challenges:
- Supply chain disruptions and volatility: Global supply chain instability impacts raw material availability and costs, necessitating robust risk management strategies. *requires update with current data on price increases*
- Regulatory complexities and compliance costs: Navigating evolving environmental regulations requires significant investment in compliance and sustainable practices.
- Intense competition and market saturation: The highly competitive landscape necessitates continuous innovation and operational excellence to maintain profitability.
Growth Drivers in the Thai packaging industry Market
The sustained growth trajectory of the Thai packaging market is propelled by a confluence of factors. Significantly, rising consumption, particularly within the food and beverage sector, plays a crucial role. Technological advancements, including automation and the adoption of sustainable materials, are fundamentally reshaping the industry. Supportive government policies that promote environmentally responsible practices further contribute to the positive growth outlook. The rapidly expanding e-commerce sector continues to inject significant demand for innovative packaging solutions tailored to the unique needs of online retail.
Challenges Impacting Thai packaging industry Growth
Challenges include fluctuating raw material prices, stringent environmental regulations requiring substantial investments in compliance, and intense competition from both domestic and international players. Supply chain disruptions can also significantly impact production and delivery timelines.
Key Players Shaping the Thai packaging industry Market
- Fagerdala Singapore Pte Ltd
- TPAC Packaging
- SCG Packaging
- Dainichiseika Color & Chemicals Mfg Co Ltd
- Eastern Polypack Co Ltd
- Amcor PLC
- TBPI Public Company Limited
- Toppan (Thailand) Co Ltd
- Huhtamaki Flexible Packaging
- Sealed Air Corporation
Significant Thai packaging industry Industry Milestones
- February 2024: BMW Group Thailand announced the construction of a battery packaging plant in Rayong, signaling a growing demand for specialized packaging in the burgeoning electric vehicle market.
Future Outlook for Thai packaging industry Market
The Thai packaging industry's future is bright, with sustained growth projected driven by continued economic expansion, evolving consumer preferences, and increasing adoption of innovative packaging technologies. Strategic opportunities lie in sustainable packaging solutions, advanced material science, and automation, positioning the industry for further expansion and diversification.
Thai packaging industry Segmentation
-
1. Packaging Material
- 1.1. Plastic
- 1.2. Paper and Paperboard
- 1.3. Glass
- 1.4. Metal
-
2. Packaging Type
-
2.1. Flexible Packaging
- 2.1.1. Pouches
- 2.1.2. Bags
- 2.1.3. Packaging Films
- 2.1.4. Other Product Types
-
2.2. Rigid Packaging
- 2.2.1. Bottles and Jars
- 2.2.2. Corrugated Boxes and Folding Cartons
- 2.2.3. Metal Cans
- 2.2.4. Drums
- 2.2.5. Bulk Containers
-
2.1. Flexible Packaging
-
3. End User
- 3.1. Food
- 3.2. Beverage
- 3.3. Beauty and Personal Care
- 3.4. Industrial
- 3.5. Pharmaceutical
- 3.6. Other End Users
Thai packaging industry Segmentation By Geography
-
1. North America
- 1.1. United States
- 1.2. Canada
- 1.3. Mexico
-
2. South America
- 2.1. Brazil
- 2.2. Argentina
- 2.3. Rest of South America
-
3. Europe
- 3.1. United Kingdom
- 3.2. Germany
- 3.3. France
- 3.4. Italy
- 3.5. Spain
- 3.6. Russia
- 3.7. Benelux
- 3.8. Nordics
- 3.9. Rest of Europe
-
4. Middle East & Africa
- 4.1. Turkey
- 4.2. Israel
- 4.3. GCC
- 4.4. North Africa
- 4.5. South Africa
- 4.6. Rest of Middle East & Africa
-
5. Asia Pacific
- 5.1. China
- 5.2. India
- 5.3. Japan
- 5.4. South Korea
- 5.5. ASEAN
- 5.6. Oceania
- 5.7. Rest of Asia Pacific
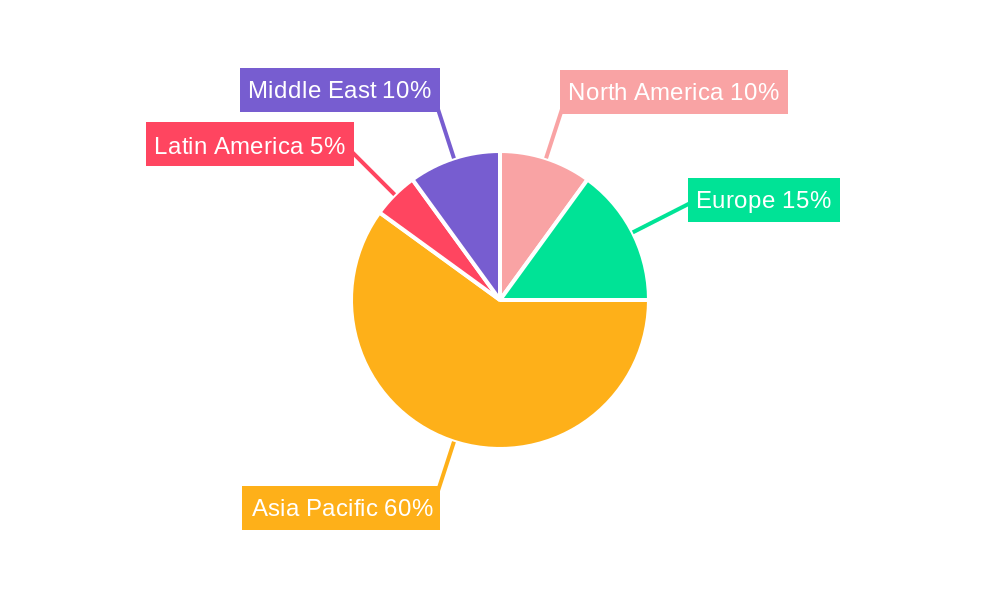
Thai packaging industry Regional Market Share
Geographic Coverage of Thai packaging industry
Thai packaging industry REPORT HIGHLIGHTS
| Aspects | Details |
|---|---|
| Study Period | 2020-2034 |
| Base Year | 2025 |
| Estimated Year | 2026 |
| Forecast Period | 2026-2034 |
| Historical Period | 2020-2025 |
| Growth Rate | CAGR of 4.46% from 2020-2034 |
| Segmentation |
|
Table of Contents
- 1. Introduction
- 1.1. Research Scope
- 1.2. Market Segmentation
- 1.3. Research Objective
- 1.4. Definitions and Assumptions
- 2. Executive Summary
- 2.1. Market Snapshot
- 3. Market Dynamics
- 3.1. Market Drivers
- 3.2. Market Restrains
- 3.3. Market Trends
- 3.4. Market Opportunities
- 4. Market Factor Analysis
- 4.1. Porters Five Forces
- 4.1.1. Bargaining Power of Suppliers
- 4.1.2. Bargaining Power of Buyers
- 4.1.3. Threat of New Entrants
- 4.1.4. Threat of Substitutes
- 4.1.5. Competitive Rivalry
- 4.2. PESTEL analysis
- 4.3. BCG Analysis
- 4.3.1. Stars (High Growth, High Market Share)
- 4.3.2. Cash Cows (Low Growth, High Market Share)
- 4.3.3. Question Mark (High Growth, Low Market Share)
- 4.3.4. Dogs (Low Growth, Low Market Share)
- 4.4. Ansoff Matrix Analysis
- 4.5. Supply Chain Analysis
- 4.6. Regulatory Landscape
- 4.7. Current Market Potential and Opportunity Assessment (TAM–SAM–SOM Framework)
- 4.8. TIR Analyst Note
- 4.1. Porters Five Forces
- 5. Market Analysis, Insights and Forecast 2021-2033
- 5.1. Market Analysis, Insights and Forecast - by Packaging Material
- 5.1.1. Plastic
- 5.1.2. Paper and Paperboard
- 5.1.3. Glass
- 5.1.4. Metal
- 5.2. Market Analysis, Insights and Forecast - by Packaging Type
- 5.2.1. Flexible Packaging
- 5.2.1.1. Pouches
- 5.2.1.2. Bags
- 5.2.1.3. Packaging Films
- 5.2.1.4. Other Product Types
- 5.2.2. Rigid Packaging
- 5.2.2.1. Bottles and Jars
- 5.2.2.2. Corrugated Boxes and Folding Cartons
- 5.2.2.3. Metal Cans
- 5.2.2.4. Drums
- 5.2.2.5. Bulk Containers
- 5.2.1. Flexible Packaging
- 5.3. Market Analysis, Insights and Forecast - by End User
- 5.3.1. Food
- 5.3.2. Beverage
- 5.3.3. Beauty and Personal Care
- 5.3.4. Industrial
- 5.3.5. Pharmaceutical
- 5.3.6. Other End Users
- 5.4. Market Analysis, Insights and Forecast - by Region
- 5.4.1. North America
- 5.4.2. South America
- 5.4.3. Europe
- 5.4.4. Middle East & Africa
- 5.4.5. Asia Pacific
- 5.1. Market Analysis, Insights and Forecast - by Packaging Material
- 6. Global Thai packaging industry Analysis, Insights and Forecast, 2021-2033
- 6.1. Market Analysis, Insights and Forecast - by Packaging Material
- 6.1.1. Plastic
- 6.1.2. Paper and Paperboard
- 6.1.3. Glass
- 6.1.4. Metal
- 6.2. Market Analysis, Insights and Forecast - by Packaging Type
- 6.2.1. Flexible Packaging
- 6.2.1.1. Pouches
- 6.2.1.2. Bags
- 6.2.1.3. Packaging Films
- 6.2.1.4. Other Product Types
- 6.2.2. Rigid Packaging
- 6.2.2.1. Bottles and Jars
- 6.2.2.2. Corrugated Boxes and Folding Cartons
- 6.2.2.3. Metal Cans
- 6.2.2.4. Drums
- 6.2.2.5. Bulk Containers
- 6.2.1. Flexible Packaging
- 6.3. Market Analysis, Insights and Forecast - by End User
- 6.3.1. Food
- 6.3.2. Beverage
- 6.3.3. Beauty and Personal Care
- 6.3.4. Industrial
- 6.3.5. Pharmaceutical
- 6.3.6. Other End Users
- 6.1. Market Analysis, Insights and Forecast - by Packaging Material
- 7. North America Thai packaging industry Analysis, Insights and Forecast, 2020-2032
- 7.1. Market Analysis, Insights and Forecast - by Packaging Material
- 7.1.1. Plastic
- 7.1.2. Paper and Paperboard
- 7.1.3. Glass
- 7.1.4. Metal
- 7.2. Market Analysis, Insights and Forecast - by Packaging Type
- 7.2.1. Flexible Packaging
- 7.2.1.1. Pouches
- 7.2.1.2. Bags
- 7.2.1.3. Packaging Films
- 7.2.1.4. Other Product Types
- 7.2.2. Rigid Packaging
- 7.2.2.1. Bottles and Jars
- 7.2.2.2. Corrugated Boxes and Folding Cartons
- 7.2.2.3. Metal Cans
- 7.2.2.4. Drums
- 7.2.2.5. Bulk Containers
- 7.2.1. Flexible Packaging
- 7.3. Market Analysis, Insights and Forecast - by End User
- 7.3.1. Food
- 7.3.2. Beverage
- 7.3.3. Beauty and Personal Care
- 7.3.4. Industrial
- 7.3.5. Pharmaceutical
- 7.3.6. Other End Users
- 7.1. Market Analysis, Insights and Forecast - by Packaging Material
- 8. South America Thai packaging industry Analysis, Insights and Forecast, 2020-2032
- 8.1. Market Analysis, Insights and Forecast - by Packaging Material
- 8.1.1. Plastic
- 8.1.2. Paper and Paperboard
- 8.1.3. Glass
- 8.1.4. Metal
- 8.2. Market Analysis, Insights and Forecast - by Packaging Type
- 8.2.1. Flexible Packaging
- 8.2.1.1. Pouches
- 8.2.1.2. Bags
- 8.2.1.3. Packaging Films
- 8.2.1.4. Other Product Types
- 8.2.2. Rigid Packaging
- 8.2.2.1. Bottles and Jars
- 8.2.2.2. Corrugated Boxes and Folding Cartons
- 8.2.2.3. Metal Cans
- 8.2.2.4. Drums
- 8.2.2.5. Bulk Containers
- 8.2.1. Flexible Packaging
- 8.3. Market Analysis, Insights and Forecast - by End User
- 8.3.1. Food
- 8.3.2. Beverage
- 8.3.3. Beauty and Personal Care
- 8.3.4. Industrial
- 8.3.5. Pharmaceutical
- 8.3.6. Other End Users
- 8.1. Market Analysis, Insights and Forecast - by Packaging Material
- 9. Europe Thai packaging industry Analysis, Insights and Forecast, 2020-2032
- 9.1. Market Analysis, Insights and Forecast - by Packaging Material
- 9.1.1. Plastic
- 9.1.2. Paper and Paperboard
- 9.1.3. Glass
- 9.1.4. Metal
- 9.2. Market Analysis, Insights and Forecast - by Packaging Type
- 9.2.1. Flexible Packaging
- 9.2.1.1. Pouches
- 9.2.1.2. Bags
- 9.2.1.3. Packaging Films
- 9.2.1.4. Other Product Types
- 9.2.2. Rigid Packaging
- 9.2.2.1. Bottles and Jars
- 9.2.2.2. Corrugated Boxes and Folding Cartons
- 9.2.2.3. Metal Cans
- 9.2.2.4. Drums
- 9.2.2.5. Bulk Containers
- 9.2.1. Flexible Packaging
- 9.3. Market Analysis, Insights and Forecast - by End User
- 9.3.1. Food
- 9.3.2. Beverage
- 9.3.3. Beauty and Personal Care
- 9.3.4. Industrial
- 9.3.5. Pharmaceutical
- 9.3.6. Other End Users
- 9.1. Market Analysis, Insights and Forecast - by Packaging Material
- 10. Middle East & Africa Thai packaging industry Analysis, Insights and Forecast, 2020-2032
- 10.1. Market Analysis, Insights and Forecast - by Packaging Material
- 10.1.1. Plastic
- 10.1.2. Paper and Paperboard
- 10.1.3. Glass
- 10.1.4. Metal
- 10.2. Market Analysis, Insights and Forecast - by Packaging Type
- 10.2.1. Flexible Packaging
- 10.2.1.1. Pouches
- 10.2.1.2. Bags
- 10.2.1.3. Packaging Films
- 10.2.1.4. Other Product Types
- 10.2.2. Rigid Packaging
- 10.2.2.1. Bottles and Jars
- 10.2.2.2. Corrugated Boxes and Folding Cartons
- 10.2.2.3. Metal Cans
- 10.2.2.4. Drums
- 10.2.2.5. Bulk Containers
- 10.2.1. Flexible Packaging
- 10.3. Market Analysis, Insights and Forecast - by End User
- 10.3.1. Food
- 10.3.2. Beverage
- 10.3.3. Beauty and Personal Care
- 10.3.4. Industrial
- 10.3.5. Pharmaceutical
- 10.3.6. Other End Users
- 10.1. Market Analysis, Insights and Forecast - by Packaging Material
- 11. Asia Pacific Thai packaging industry Analysis, Insights and Forecast, 2020-2032
- 11.1. Market Analysis, Insights and Forecast - by Packaging Material
- 11.1.1. Plastic
- 11.1.2. Paper and Paperboard
- 11.1.3. Glass
- 11.1.4. Metal
- 11.2. Market Analysis, Insights and Forecast - by Packaging Type
- 11.2.1. Flexible Packaging
- 11.2.1.1. Pouches
- 11.2.1.2. Bags
- 11.2.1.3. Packaging Films
- 11.2.1.4. Other Product Types
- 11.2.2. Rigid Packaging
- 11.2.2.1. Bottles and Jars
- 11.2.2.2. Corrugated Boxes and Folding Cartons
- 11.2.2.3. Metal Cans
- 11.2.2.4. Drums
- 11.2.2.5. Bulk Containers
- 11.2.1. Flexible Packaging
- 11.3. Market Analysis, Insights and Forecast - by End User
- 11.3.1. Food
- 11.3.2. Beverage
- 11.3.3. Beauty and Personal Care
- 11.3.4. Industrial
- 11.3.5. Pharmaceutical
- 11.3.6. Other End Users
- 11.1. Market Analysis, Insights and Forecast - by Packaging Material
- 12. Competitive Analysis
- 12.1. Company Profiles
- 12.1.1 Fagerdala Singapore Pte Ltd
- 12.1.1.1. Company Overview
- 12.1.1.2. Products
- 12.1.1.3. Company Financials
- 12.1.1.4. SWOT Analysis
- 12.1.2 TPAC Packaging
- 12.1.2.1. Company Overview
- 12.1.2.2. Products
- 12.1.2.3. Company Financials
- 12.1.2.4. SWOT Analysis
- 12.1.3 SCG Packaging
- 12.1.3.1. Company Overview
- 12.1.3.2. Products
- 12.1.3.3. Company Financials
- 12.1.3.4. SWOT Analysis
- 12.1.4 Dainichiseika Color & Chemicals Mfg Co Ltd
- 12.1.4.1. Company Overview
- 12.1.4.2. Products
- 12.1.4.3. Company Financials
- 12.1.4.4. SWOT Analysis
- 12.1.5 Eastern Polypack Co Ltd
- 12.1.5.1. Company Overview
- 12.1.5.2. Products
- 12.1.5.3. Company Financials
- 12.1.5.4. SWOT Analysis
- 12.1.6 Amcor PLC
- 12.1.6.1. Company Overview
- 12.1.6.2. Products
- 12.1.6.3. Company Financials
- 12.1.6.4. SWOT Analysis
- 12.1.7 TBPI Public Company Limited
- 12.1.7.1. Company Overview
- 12.1.7.2. Products
- 12.1.7.3. Company Financials
- 12.1.7.4. SWOT Analysis
- 12.1.8 Toppan (Thailand) Co Ltd*List Not Exhaustive
- 12.1.8.1. Company Overview
- 12.1.8.2. Products
- 12.1.8.3. Company Financials
- 12.1.8.4. SWOT Analysis
- 12.1.9 Huhtamaki Flexible Packaging
- 12.1.9.1. Company Overview
- 12.1.9.2. Products
- 12.1.9.3. Company Financials
- 12.1.9.4. SWOT Analysis
- 12.1.10 Sealed Air Corporation
- 12.1.10.1. Company Overview
- 12.1.10.2. Products
- 12.1.10.3. Company Financials
- 12.1.10.4. SWOT Analysis
- 12.1.1 Fagerdala Singapore Pte Ltd
- 12.2. Market Entropy
- 12.2.1 Company's Key Areas Served
- 12.2.2 Recent Developments
- 12.3. Company Market Share Analysis 2025
- 12.3.1 Top 5 Companies Market Share Analysis
- 12.3.2 Top 3 Companies Market Share Analysis
- 12.4. List of Potential Customers
- 13. Research Methodology
List of Figures
- Figure 1: Global Thai packaging industry Revenue Breakdown (Million, %) by Region 2025 & 2033
- Figure 2: North America Thai packaging industry Revenue (Million), by Packaging Material 2025 & 2033
- Figure 3: North America Thai packaging industry Revenue Share (%), by Packaging Material 2025 & 2033
- Figure 4: North America Thai packaging industry Revenue (Million), by Packaging Type 2025 & 2033
- Figure 5: North America Thai packaging industry Revenue Share (%), by Packaging Type 2025 & 2033
- Figure 6: North America Thai packaging industry Revenue (Million), by End User 2025 & 2033
- Figure 7: North America Thai packaging industry Revenue Share (%), by End User 2025 & 2033
- Figure 8: North America Thai packaging industry Revenue (Million), by Country 2025 & 2033
- Figure 9: North America Thai packaging industry Revenue Share (%), by Country 2025 & 2033
- Figure 10: South America Thai packaging industry Revenue (Million), by Packaging Material 2025 & 2033
- Figure 11: South America Thai packaging industry Revenue Share (%), by Packaging Material 2025 & 2033
- Figure 12: South America Thai packaging industry Revenue (Million), by Packaging Type 2025 & 2033
- Figure 13: South America Thai packaging industry Revenue Share (%), by Packaging Type 2025 & 2033
- Figure 14: South America Thai packaging industry Revenue (Million), by End User 2025 & 2033
- Figure 15: South America Thai packaging industry Revenue Share (%), by End User 2025 & 2033
- Figure 16: South America Thai packaging industry Revenue (Million), by Country 2025 & 2033
- Figure 17: South America Thai packaging industry Revenue Share (%), by Country 2025 & 2033
- Figure 18: Europe Thai packaging industry Revenue (Million), by Packaging Material 2025 & 2033
- Figure 19: Europe Thai packaging industry Revenue Share (%), by Packaging Material 2025 & 2033
- Figure 20: Europe Thai packaging industry Revenue (Million), by Packaging Type 2025 & 2033
- Figure 21: Europe Thai packaging industry Revenue Share (%), by Packaging Type 2025 & 2033
- Figure 22: Europe Thai packaging industry Revenue (Million), by End User 2025 & 2033
- Figure 23: Europe Thai packaging industry Revenue Share (%), by End User 2025 & 2033
- Figure 24: Europe Thai packaging industry Revenue (Million), by Country 2025 & 2033
- Figure 25: Europe Thai packaging industry Revenue Share (%), by Country 2025 & 2033
- Figure 26: Middle East & Africa Thai packaging industry Revenue (Million), by Packaging Material 2025 & 2033
- Figure 27: Middle East & Africa Thai packaging industry Revenue Share (%), by Packaging Material 2025 & 2033
- Figure 28: Middle East & Africa Thai packaging industry Revenue (Million), by Packaging Type 2025 & 2033
- Figure 29: Middle East & Africa Thai packaging industry Revenue Share (%), by Packaging Type 2025 & 2033
- Figure 30: Middle East & Africa Thai packaging industry Revenue (Million), by End User 2025 & 2033
- Figure 31: Middle East & Africa Thai packaging industry Revenue Share (%), by End User 2025 & 2033
- Figure 32: Middle East & Africa Thai packaging industry Revenue (Million), by Country 2025 & 2033
- Figure 33: Middle East & Africa Thai packaging industry Revenue Share (%), by Country 2025 & 2033
- Figure 34: Asia Pacific Thai packaging industry Revenue (Million), by Packaging Material 2025 & 2033
- Figure 35: Asia Pacific Thai packaging industry Revenue Share (%), by Packaging Material 2025 & 2033
- Figure 36: Asia Pacific Thai packaging industry Revenue (Million), by Packaging Type 2025 & 2033
- Figure 37: Asia Pacific Thai packaging industry Revenue Share (%), by Packaging Type 2025 & 2033
- Figure 38: Asia Pacific Thai packaging industry Revenue (Million), by End User 2025 & 2033
- Figure 39: Asia Pacific Thai packaging industry Revenue Share (%), by End User 2025 & 2033
- Figure 40: Asia Pacific Thai packaging industry Revenue (Million), by Country 2025 & 2033
- Figure 41: Asia Pacific Thai packaging industry Revenue Share (%), by Country 2025 & 2033
List of Tables
- Table 1: Global Thai packaging industry Revenue Million Forecast, by Packaging Material 2020 & 2033
- Table 2: Global Thai packaging industry Revenue Million Forecast, by Packaging Type 2020 & 2033
- Table 3: Global Thai packaging industry Revenue Million Forecast, by End User 2020 & 2033
- Table 4: Global Thai packaging industry Revenue Million Forecast, by Region 2020 & 2033
- Table 5: Global Thai packaging industry Revenue Million Forecast, by Packaging Material 2020 & 2033
- Table 6: Global Thai packaging industry Revenue Million Forecast, by Packaging Type 2020 & 2033
- Table 7: Global Thai packaging industry Revenue Million Forecast, by End User 2020 & 2033
- Table 8: Global Thai packaging industry Revenue Million Forecast, by Country 2020 & 2033
- Table 9: United States Thai packaging industry Revenue (Million) Forecast, by Application 2020 & 2033
- Table 10: Canada Thai packaging industry Revenue (Million) Forecast, by Application 2020 & 2033
- Table 11: Mexico Thai packaging industry Revenue (Million) Forecast, by Application 2020 & 2033
- Table 12: Global Thai packaging industry Revenue Million Forecast, by Packaging Material 2020 & 2033
- Table 13: Global Thai packaging industry Revenue Million Forecast, by Packaging Type 2020 & 2033
- Table 14: Global Thai packaging industry Revenue Million Forecast, by End User 2020 & 2033
- Table 15: Global Thai packaging industry Revenue Million Forecast, by Country 2020 & 2033
- Table 16: Brazil Thai packaging industry Revenue (Million) Forecast, by Application 2020 & 2033
- Table 17: Argentina Thai packaging industry Revenue (Million) Forecast, by Application 2020 & 2033
- Table 18: Rest of South America Thai packaging industry Revenue (Million) Forecast, by Application 2020 & 2033
- Table 19: Global Thai packaging industry Revenue Million Forecast, by Packaging Material 2020 & 2033
- Table 20: Global Thai packaging industry Revenue Million Forecast, by Packaging Type 2020 & 2033
- Table 21: Global Thai packaging industry Revenue Million Forecast, by End User 2020 & 2033
- Table 22: Global Thai packaging industry Revenue Million Forecast, by Country 2020 & 2033
- Table 23: United Kingdom Thai packaging industry Revenue (Million) Forecast, by Application 2020 & 2033
- Table 24: Germany Thai packaging industry Revenue (Million) Forecast, by Application 2020 & 2033
- Table 25: France Thai packaging industry Revenue (Million) Forecast, by Application 2020 & 2033
- Table 26: Italy Thai packaging industry Revenue (Million) Forecast, by Application 2020 & 2033
- Table 27: Spain Thai packaging industry Revenue (Million) Forecast, by Application 2020 & 2033
- Table 28: Russia Thai packaging industry Revenue (Million) Forecast, by Application 2020 & 2033
- Table 29: Benelux Thai packaging industry Revenue (Million) Forecast, by Application 2020 & 2033
- Table 30: Nordics Thai packaging industry Revenue (Million) Forecast, by Application 2020 & 2033
- Table 31: Rest of Europe Thai packaging industry Revenue (Million) Forecast, by Application 2020 & 2033
- Table 32: Global Thai packaging industry Revenue Million Forecast, by Packaging Material 2020 & 2033
- Table 33: Global Thai packaging industry Revenue Million Forecast, by Packaging Type 2020 & 2033
- Table 34: Global Thai packaging industry Revenue Million Forecast, by End User 2020 & 2033
- Table 35: Global Thai packaging industry Revenue Million Forecast, by Country 2020 & 2033
- Table 36: Turkey Thai packaging industry Revenue (Million) Forecast, by Application 2020 & 2033
- Table 37: Israel Thai packaging industry Revenue (Million) Forecast, by Application 2020 & 2033
- Table 38: GCC Thai packaging industry Revenue (Million) Forecast, by Application 2020 & 2033
- Table 39: North Africa Thai packaging industry Revenue (Million) Forecast, by Application 2020 & 2033
- Table 40: South Africa Thai packaging industry Revenue (Million) Forecast, by Application 2020 & 2033
- Table 41: Rest of Middle East & Africa Thai packaging industry Revenue (Million) Forecast, by Application 2020 & 2033
- Table 42: Global Thai packaging industry Revenue Million Forecast, by Packaging Material 2020 & 2033
- Table 43: Global Thai packaging industry Revenue Million Forecast, by Packaging Type 2020 & 2033
- Table 44: Global Thai packaging industry Revenue Million Forecast, by End User 2020 & 2033
- Table 45: Global Thai packaging industry Revenue Million Forecast, by Country 2020 & 2033
- Table 46: China Thai packaging industry Revenue (Million) Forecast, by Application 2020 & 2033
- Table 47: India Thai packaging industry Revenue (Million) Forecast, by Application 2020 & 2033
- Table 48: Japan Thai packaging industry Revenue (Million) Forecast, by Application 2020 & 2033
- Table 49: South Korea Thai packaging industry Revenue (Million) Forecast, by Application 2020 & 2033
- Table 50: ASEAN Thai packaging industry Revenue (Million) Forecast, by Application 2020 & 2033
- Table 51: Oceania Thai packaging industry Revenue (Million) Forecast, by Application 2020 & 2033
- Table 52: Rest of Asia Pacific Thai packaging industry Revenue (Million) Forecast, by Application 2020 & 2033
Frequently Asked Questions
1. What is the projected Compound Annual Growth Rate (CAGR) of the Thai packaging industry?
The projected CAGR is approximately 4.46%.
2. Which companies are prominent players in the Thai packaging industry?
Key companies in the market include Fagerdala Singapore Pte Ltd, TPAC Packaging, SCG Packaging, Dainichiseika Color & Chemicals Mfg Co Ltd, Eastern Polypack Co Ltd, Amcor PLC, TBPI Public Company Limited, Toppan (Thailand) Co Ltd*List Not Exhaustive, Huhtamaki Flexible Packaging, Sealed Air Corporation.
3. What are the main segments of the Thai packaging industry?
The market segments include Packaging Material, Packaging Type, End User.
4. Can you provide details about the market size?
The market size is estimated to be USD 15.04 Million as of 2022.
5. What are some drivers contributing to market growth?
Increasing Demand from End-user Industries; Increased Demand for Convenient Packaging.
6. What are the notable trends driving market growth?
Plastic is Expected to Hold a Significant Share in the Market.
7. Are there any restraints impacting market growth?
Concerns Regarding the Environment and Recycling.
8. Can you provide examples of recent developments in the market?
February 2024: BMW Group Thailand announced its plans to construct a battery packaging plant in Rayong, Thailand. The facility will support the sales of BMW's electric and plug-in hybrid vehicles in Thailand and Southeast Asia.
9. What pricing options are available for accessing the report?
Pricing options include single-user, multi-user, and enterprise licenses priced at USD 3800, USD 4500, and USD 5800 respectively.
10. Is the market size provided in terms of value or volume?
The market size is provided in terms of value, measured in Million.
11. Are there any specific market keywords associated with the report?
Yes, the market keyword associated with the report is "Thai packaging industry," which aids in identifying and referencing the specific market segment covered.
12. How do I determine which pricing option suits my needs best?
The pricing options vary based on user requirements and access needs. Individual users may opt for single-user licenses, while businesses requiring broader access may choose multi-user or enterprise licenses for cost-effective access to the report.
13. Are there any additional resources or data provided in the Thai packaging industry report?
While the report offers comprehensive insights, it's advisable to review the specific contents or supplementary materials provided to ascertain if additional resources or data are available.
14. How can I stay updated on further developments or reports in the Thai packaging industry?
To stay informed about further developments, trends, and reports in the Thai packaging industry, consider subscribing to industry newsletters, following relevant companies and organizations, or regularly checking reputable industry news sources and publications.
Methodology
Step 1 - Identification of Relevant Samples Size from Population Database


Step 2 - Approaches for Defining Global Market Size (Value, Volume* & Price*)

Note*: In applicable scenarios
Step 3 - Data Sources
Primary Research
- Web Analytics
- Survey Reports
- Research Institute
- Latest Research Reports
- Opinion Leaders
Secondary Research
- Annual Reports
- White Paper
- Latest Press Release
- Industry Association
- Paid Database
- Investor Presentations

Step 4 - Data Triangulation
Involves using different sources of information in order to increase the validity of a study
These sources are likely to be stakeholders in a program - participants, other researchers, program staff, other community members, and so on.
Then we put all data in single framework & apply various statistical tools to find out the dynamic on the market.
During the analysis stage, feedback from the stakeholder groups would be compared to determine areas of agreement as well as areas of divergence