

Key Insights
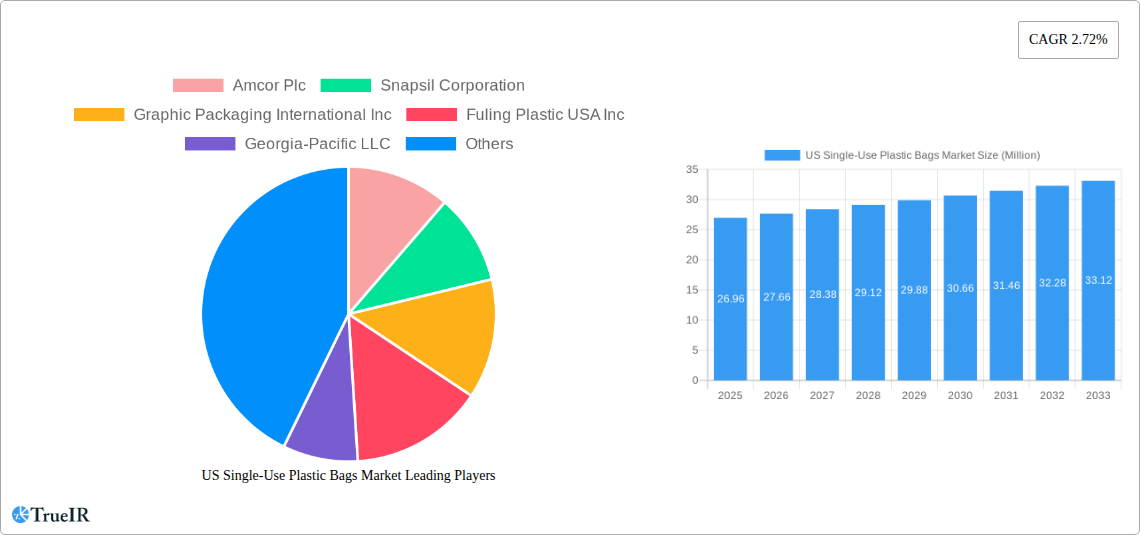
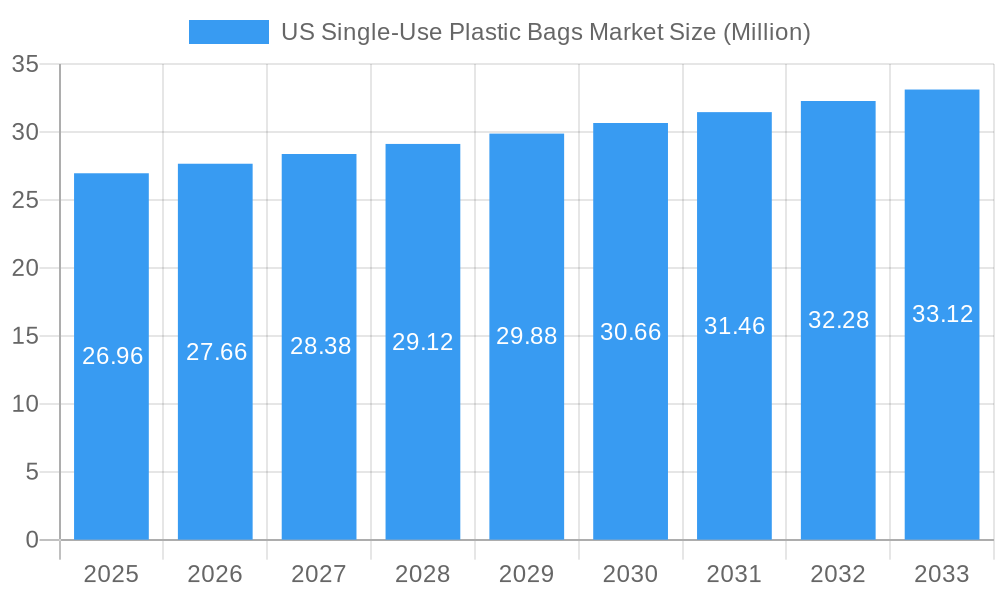
The US single-use plastic bag market, valued at $26.96 million in 2025, is projected to experience steady growth, driven primarily by the continued demand across various end-user industries. The food and beverage sector remains a significant contributor, with increasing reliance on convenient packaging solutions for takeout and grocery items. Growth in the e-commerce sector also fuels demand, particularly for protective packaging during shipping. The healthcare and pharmaceutical industry utilizes single-use plastic bags for sterile packaging and hygiene purposes, further bolstering market demand. While a CAGR of 2.72% indicates moderate growth, several factors influence the market trajectory. The increasing consumer awareness regarding environmental impact and the push towards sustainable alternatives present a significant restraint. However, innovations in biodegradable and compostable plastic bag materials are partially offsetting this concern. Market segmentation reveals that plastic remains the dominant material, owing to its cost-effectiveness and versatility, while paper and paperboard alternatives are gaining traction due to growing eco-consciousness. Regional variations exist, with regions like the Northeast and West potentially showing higher growth rates due to higher population density and stronger environmental regulations, leading to a push for sustainable alternatives. The competitive landscape is marked by both large multinational corporations and smaller regional players. Amcor Plc, Graphic Packaging International Inc., and Berry Global Inc. are key players, continuously innovating to meet evolving consumer demands and regulations. Looking ahead, the market's future growth will depend significantly on the balance between the need for convenient, affordable packaging and the increasing pressure for environmentally responsible alternatives.
US Single-Use Plastic Bags Market Market Size (In Million)
The forecast period (2025-2033) anticipates continued growth, albeit at a moderate pace. This projection accounts for the aforementioned drivers and restraints, including advancements in sustainable packaging materials and the influence of government regulations regarding plastic waste. Growth will likely be uneven across different segments and regions. The "Other Materials" segment, encompassing innovative bioplastics and recycled materials, is expected to witness the fastest growth rate. Further regional analysis will highlight the impact of specific state-level policies and consumer preferences. This dynamic interplay of factors contributes to a complex yet predictable trajectory for the US single-use plastic bag market over the next decade.
US Single-Use Plastic Bags Market Company Market Share
US Single-Use Plastic Bags Market Report: 2019-2033
This comprehensive report provides a detailed analysis of the US single-use plastic bags market, offering invaluable insights for stakeholders across the value chain. The study period covers 2019-2033, with a base year of 2025 and a forecast period of 2025-2033. The report leverages rigorous research methodologies to deliver accurate market sizing, segment-specific growth analysis, and competitive landscape assessments. Discover key trends, opportunities, and challenges impacting this dynamic market, empowering strategic decision-making and competitive advantage.
US Single-Use Plastic Bags Market Market Structure & Competitive Landscape
The US single-use plastic bag market is characterized by a moderately concentrated structure, with a few prominent players holding a significant portion of the market share. The Herfindahl-Hirschman Index (HHI) for 2024 is estimated at **[Insert HHI Value Here]**, reinforcing its status as a moderately consolidated market. Key drivers of innovation revolve around the development of more sustainable alternatives and advancements in material science. Concurrently, regulatory pressures, particularly those aimed at reducing plastic waste, exert a substantial influence on market dynamics and strategic decision-making. The primary product substitutes available to consumers and businesses include durable reusable bags, traditional paper bags, and increasingly, compostable alternatives.
The market is strategically segmented by end-user industry, encompassing sectors such as Food & Beverage, Healthcare & Pharmaceutical, Personal Care, and Other diverse applications. Material-wise, segmentation includes Paper & Paperboard, various types of Plastics, Aluminum, and other specialized materials. Merger and acquisition (M&A) activity has been observed at a moderate pace in recent years, with approximately **[Insert M&A Deal Count Here]** deals recorded between 2019 and 2024. These transactions have predominantly focused on expanding market reach, acquiring advanced technological capabilities, and consolidating market positions.
- Market Concentration: Moderately concentrated, with an estimated HHI of **[Insert HHI Value Here]** in 2024, indicating a competitive yet consolidated landscape.
- Innovation Drivers: A strong emphasis on developing sustainable alternatives and leveraging advancements in material science to create more eco-friendly products.
- Regulatory Impacts: Stringent government regulations and policies concerning plastic waste reduction are significantly influencing market strategies and product development.
- Product Substitutes: A growing availability and consumer preference for reusable bags, paper bags, and compostable alternatives are reshaping the competitive environment.
- End-User Segmentation: Significant variations in demand patterns and requirements are observed across different end-user industries, necessitating tailored product offerings.
- M&A Trends: Moderate M&A activity, primarily driven by strategic objectives such as market expansion, technology acquisition, and strengthening competitive positions.
US Single-Use Plastic Bags Market Market Trends & Opportunities
The US single-use plastic bag market is projected to experience a Compound Annual Growth Rate (CAGR) of xx% during the forecast period (2025-2033). This growth is fueled by several key factors. Market size is estimated at $xx Million in 2025 and is expected to reach $xx Million by 2033. Technological advancements, such as the development of biodegradable and compostable alternatives, are reshaping the market landscape. Consumer preferences are increasingly shifting towards environmentally friendly options, putting pressure on manufacturers to innovate and adapt. The competitive landscape is characterized by intense rivalry among established players and emerging startups, driving innovation and price competition. Market penetration rates vary significantly across different end-user segments and geographic regions.
Dominant Markets & Segments in US Single-Use Plastic Bags Market
The Food and Beverage sector is the dominant end-user industry for single-use plastic bags, accounting for approximately xx% of total market value in 2024. The Plastics material segment holds the largest share within the material type segmentation, driven by its cost-effectiveness and versatility. The Northeast region of the United States exhibits the highest market share, driven by factors including high population density and robust consumer demand.
- Key Growth Drivers (Food & Beverage Segment):
- High demand from supermarkets and restaurants.
- Increasing packaged food consumption.
- Extensive distribution networks.
- Key Growth Drivers (Plastics Segment):
- Cost-effectiveness.
- Versatility and ease of manufacturing.
- Established supply chains.
- Key Growth Drivers (Northeast Region):
- High population density.
- Strong consumer spending.
- Developed infrastructure.
US Single-Use Plastic Bags Market Product Analysis
Product innovation within the US single-use plastic bag market is increasingly driven by the imperative for enhanced sustainability and improved functional performance. Manufacturers are actively investing in research and development to create biodegradable, compostable, and bags incorporating recycled content, aiming to address growing environmental concerns. Technological advancements are at the forefront, with the integration of advanced materials such as oxo-biodegradable plastics and plant-based polymers to elevate both the performance and environmental profile of these bags. These innovations are strategically designed to optimize product life cycles, minimize environmental impact, and provide enhanced convenience and user experience for consumers and businesses alike.
Key Drivers, Barriers & Challenges in US Single-Use Plastic Bags Market
Key Drivers:
- Growing demand from various end-user industries.
- Increasing consumer convenience.
- Cost-effectiveness of plastic bags compared to alternatives.
Key Challenges and Restraints:
- Stringent environmental regulations targeting plastic waste, leading to increased manufacturing costs and potential market limitations.
- Growing consumer preference for sustainable alternatives, impacting market share.
- Fluctuations in raw material prices, potentially increasing production costs.
Growth Drivers in the US Single-Use Plastic Bags Market Market
The growth trajectory of the US single-use plastic bags market is primarily propelled by the sustained demand from a diverse range of industries, including the pivotal food and beverage, healthcare, and retail sectors. Economic indicators such as rising disposable incomes also contribute positively to market expansion. However, the escalating influence of regulatory pressures, particularly those focusing on environmental sustainability and waste reduction, presents significant challenges that necessitate strategic adaptation and innovation from market participants.
Challenges Impacting US Single-Use Plastic Bags Market Growth
The US single-use plastic bag market faces significant challenges, including stricter environmental regulations, leading to production cost increases and limitations on certain bag types. Fluctuating raw material prices and increased consumer preference for sustainable alternatives represent substantial barriers to market expansion. These factors pose a considerable threat to consistent market growth and the profitability of companies operating within this space.
Key Players Shaping the US Single-Use Plastic Bags Market Market
- Amcor Plc
- Snapsil Corporation
- Graphic Packaging International Inc
- Fuling Plastic USA Inc
- Georgia-Pacific LLC
- PPC Flexible Packaging LLC
- Pactiv LLC
- Novolex
- Berry Global Inc
- Dart Container Corporation
Significant US Single-Use Plastic Bags Market Industry Milestones
- September 2022: Novolex invested USD 10 Million to expand its Indiana recycling facility, increasing capacity for plastic bag and PE film recycling to 28 million lbs (12,698 MT) annually.
- July 2022: Novolex launched a new stand for its Cutlerease single-use utensil dispenser, enhancing placement flexibility for food service businesses.
Future Outlook for US Single-Use Plastic Bags Market Market
The future landscape of the US single-use plastic bag market is poised to be shaped by a complex interplay of growth catalysts and formidable challenges. While demand from specific sectors is expected to persist, the accelerating adoption of sustainable alternatives and the implementation of increasingly stringent environmental regulations will fundamentally redefine the market's trajectory. Significant opportunities lie ahead for companies that can effectively lead in the innovation of sustainable materials and advanced recycling technologies. Strategic investments in eco-friendly solutions and the development of efficient recycling infrastructure will be paramount for achieving sustained success and competitive advantage in this dynamic and evolving market.
US Single-Use Plastic Bags Market Segmentation
-
1. Material
- 1.1. Paper and Paperboard
- 1.2. Plastics
- 1.3. Aluminium
- 1.4. Other Materials
-
2. End-user Industry
- 2.1. Food
- 2.2. Beverage
- 2.3. Healthcare and Pharmaceutical
- 2.4. Personal Care
- 2.5. Other End-user Industries
US Single-Use Plastic Bags Market Segmentation By Geography
-
1. North America
- 1.1. United States
- 1.2. Canada
- 1.3. Mexico
-
2. South America
- 2.1. Brazil
- 2.2. Argentina
- 2.3. Rest of South America
-
3. Europe
- 3.1. United Kingdom
- 3.2. Germany
- 3.3. France
- 3.4. Italy
- 3.5. Spain
- 3.6. Russia
- 3.7. Benelux
- 3.8. Nordics
- 3.9. Rest of Europe
-
4. Middle East & Africa
- 4.1. Turkey
- 4.2. Israel
- 4.3. GCC
- 4.4. North Africa
- 4.5. South Africa
- 4.6. Rest of Middle East & Africa
-
5. Asia Pacific
- 5.1. China
- 5.2. India
- 5.3. Japan
- 5.4. South Korea
- 5.5. ASEAN
- 5.6. Oceania
- 5.7. Rest of Asia Pacific
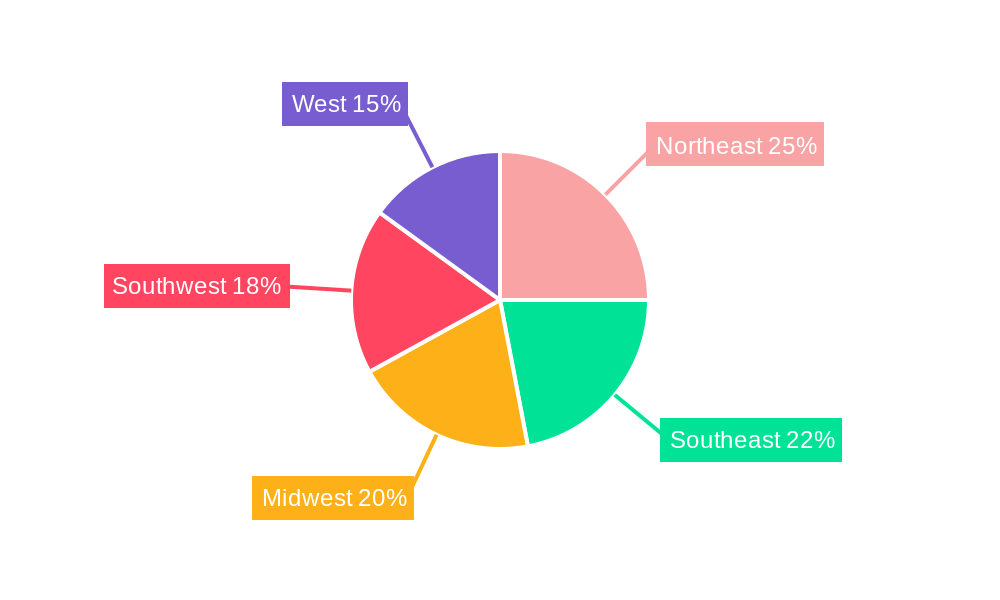
US Single-Use Plastic Bags Market Regional Market Share
Geographic Coverage of US Single-Use Plastic Bags Market
US Single-Use Plastic Bags Market REPORT HIGHLIGHTS
| Aspects | Details |
|---|---|
| Study Period | 2020-2034 |
| Base Year | 2025 |
| Estimated Year | 2026 |
| Forecast Period | 2026-2034 |
| Historical Period | 2020-2025 |
| Growth Rate | CAGR of 2.72% from 2020-2034 |
| Segmentation |
|
Table of Contents
- 1. Introduction
- 1.1. Research Scope
- 1.2. Market Segmentation
- 1.3. Research Objective
- 1.4. Definitions and Assumptions
- 2. Executive Summary
- 2.1. Market Snapshot
- 3. Market Dynamics
- 3.1. Market Drivers
- 3.2. Market Restrains
- 3.3. Market Trends
- 3.4. Market Opportunities
- 4. Market Factor Analysis
- 4.1. Porters Five Forces
- 4.1.1. Bargaining Power of Suppliers
- 4.1.2. Bargaining Power of Buyers
- 4.1.3. Threat of New Entrants
- 4.1.4. Threat of Substitutes
- 4.1.5. Competitive Rivalry
- 4.2. PESTEL analysis
- 4.3. BCG Analysis
- 4.3.1. Stars (High Growth, High Market Share)
- 4.3.2. Cash Cows (Low Growth, High Market Share)
- 4.3.3. Question Mark (High Growth, Low Market Share)
- 4.3.4. Dogs (Low Growth, Low Market Share)
- 4.4. Ansoff Matrix Analysis
- 4.5. Supply Chain Analysis
- 4.6. Regulatory Landscape
- 4.7. Current Market Potential and Opportunity Assessment (TAM–SAM–SOM Framework)
- 4.8. TIR Analyst Note
- 4.1. Porters Five Forces
- 5. Market Analysis, Insights and Forecast 2021-2033
- 5.1. Market Analysis, Insights and Forecast - by Material
- 5.1.1. Paper and Paperboard
- 5.1.2. Plastics
- 5.1.3. Aluminium
- 5.1.4. Other Materials
- 5.2. Market Analysis, Insights and Forecast - by End-user Industry
- 5.2.1. Food
- 5.2.2. Beverage
- 5.2.3. Healthcare and Pharmaceutical
- 5.2.4. Personal Care
- 5.2.5. Other End-user Industries
- 5.3. Market Analysis, Insights and Forecast - by Region
- 5.3.1. North America
- 5.3.2. South America
- 5.3.3. Europe
- 5.3.4. Middle East & Africa
- 5.3.5. Asia Pacific
- 5.1. Market Analysis, Insights and Forecast - by Material
- 6. Global US Single-Use Plastic Bags Market Analysis, Insights and Forecast, 2021-2033
- 6.1. Market Analysis, Insights and Forecast - by Material
- 6.1.1. Paper and Paperboard
- 6.1.2. Plastics
- 6.1.3. Aluminium
- 6.1.4. Other Materials
- 6.2. Market Analysis, Insights and Forecast - by End-user Industry
- 6.2.1. Food
- 6.2.2. Beverage
- 6.2.3. Healthcare and Pharmaceutical
- 6.2.4. Personal Care
- 6.2.5. Other End-user Industries
- 6.1. Market Analysis, Insights and Forecast - by Material
- 7. North America US Single-Use Plastic Bags Market Analysis, Insights and Forecast, 2020-2032
- 7.1. Market Analysis, Insights and Forecast - by Material
- 7.1.1. Paper and Paperboard
- 7.1.2. Plastics
- 7.1.3. Aluminium
- 7.1.4. Other Materials
- 7.2. Market Analysis, Insights and Forecast - by End-user Industry
- 7.2.1. Food
- 7.2.2. Beverage
- 7.2.3. Healthcare and Pharmaceutical
- 7.2.4. Personal Care
- 7.2.5. Other End-user Industries
- 7.1. Market Analysis, Insights and Forecast - by Material
- 8. South America US Single-Use Plastic Bags Market Analysis, Insights and Forecast, 2020-2032
- 8.1. Market Analysis, Insights and Forecast - by Material
- 8.1.1. Paper and Paperboard
- 8.1.2. Plastics
- 8.1.3. Aluminium
- 8.1.4. Other Materials
- 8.2. Market Analysis, Insights and Forecast - by End-user Industry
- 8.2.1. Food
- 8.2.2. Beverage
- 8.2.3. Healthcare and Pharmaceutical
- 8.2.4. Personal Care
- 8.2.5. Other End-user Industries
- 8.1. Market Analysis, Insights and Forecast - by Material
- 9. Europe US Single-Use Plastic Bags Market Analysis, Insights and Forecast, 2020-2032
- 9.1. Market Analysis, Insights and Forecast - by Material
- 9.1.1. Paper and Paperboard
- 9.1.2. Plastics
- 9.1.3. Aluminium
- 9.1.4. Other Materials
- 9.2. Market Analysis, Insights and Forecast - by End-user Industry
- 9.2.1. Food
- 9.2.2. Beverage
- 9.2.3. Healthcare and Pharmaceutical
- 9.2.4. Personal Care
- 9.2.5. Other End-user Industries
- 9.1. Market Analysis, Insights and Forecast - by Material
- 10. Middle East & Africa US Single-Use Plastic Bags Market Analysis, Insights and Forecast, 2020-2032
- 10.1. Market Analysis, Insights and Forecast - by Material
- 10.1.1. Paper and Paperboard
- 10.1.2. Plastics
- 10.1.3. Aluminium
- 10.1.4. Other Materials
- 10.2. Market Analysis, Insights and Forecast - by End-user Industry
- 10.2.1. Food
- 10.2.2. Beverage
- 10.2.3. Healthcare and Pharmaceutical
- 10.2.4. Personal Care
- 10.2.5. Other End-user Industries
- 10.1. Market Analysis, Insights and Forecast - by Material
- 11. Asia Pacific US Single-Use Plastic Bags Market Analysis, Insights and Forecast, 2020-2032
- 11.1. Market Analysis, Insights and Forecast - by Material
- 11.1.1. Paper and Paperboard
- 11.1.2. Plastics
- 11.1.3. Aluminium
- 11.1.4. Other Materials
- 11.2. Market Analysis, Insights and Forecast - by End-user Industry
- 11.2.1. Food
- 11.2.2. Beverage
- 11.2.3. Healthcare and Pharmaceutical
- 11.2.4. Personal Care
- 11.2.5. Other End-user Industries
- 11.1. Market Analysis, Insights and Forecast - by Material
- 12. Competitive Analysis
- 12.1. Company Profiles
- 12.1.1 Amcor Plc
- 12.1.1.1. Company Overview
- 12.1.1.2. Products
- 12.1.1.3. Company Financials
- 12.1.1.4. SWOT Analysis
- 12.1.2 Snapsil Corporation
- 12.1.2.1. Company Overview
- 12.1.2.2. Products
- 12.1.2.3. Company Financials
- 12.1.2.4. SWOT Analysis
- 12.1.3 Graphic Packaging International Inc
- 12.1.3.1. Company Overview
- 12.1.3.2. Products
- 12.1.3.3. Company Financials
- 12.1.3.4. SWOT Analysis
- 12.1.4 Fuling Plastic USA Inc
- 12.1.4.1. Company Overview
- 12.1.4.2. Products
- 12.1.4.3. Company Financials
- 12.1.4.4. SWOT Analysis
- 12.1.5 Georgia-Pacific LLC
- 12.1.5.1. Company Overview
- 12.1.5.2. Products
- 12.1.5.3. Company Financials
- 12.1.5.4. SWOT Analysis
- 12.1.6 PPC Flexible Packaging LLC
- 12.1.6.1. Company Overview
- 12.1.6.2. Products
- 12.1.6.3. Company Financials
- 12.1.6.4. SWOT Analysis
- 12.1.7 Pactiv LLC
- 12.1.7.1. Company Overview
- 12.1.7.2. Products
- 12.1.7.3. Company Financials
- 12.1.7.4. SWOT Analysis
- 12.1.8 Novolex
- 12.1.8.1. Company Overview
- 12.1.8.2. Products
- 12.1.8.3. Company Financials
- 12.1.8.4. SWOT Analysis
- 12.1.9 Berry Global Inc
- 12.1.9.1. Company Overview
- 12.1.9.2. Products
- 12.1.9.3. Company Financials
- 12.1.9.4. SWOT Analysis
- 12.1.10 Dart Container Corporation
- 12.1.10.1. Company Overview
- 12.1.10.2. Products
- 12.1.10.3. Company Financials
- 12.1.10.4. SWOT Analysis
- 12.1.1 Amcor Plc
- 12.2. Market Entropy
- 12.2.1 Company's Key Areas Served
- 12.2.2 Recent Developments
- 12.3. Company Market Share Analysis 2025
- 12.3.1 Top 5 Companies Market Share Analysis
- 12.3.2 Top 3 Companies Market Share Analysis
- 12.4. List of Potential Customers
- 13. Research Methodology
List of Figures
- Figure 1: Global US Single-Use Plastic Bags Market Revenue Breakdown (Million, %) by Region 2025 & 2033
- Figure 2: North America US Single-Use Plastic Bags Market Revenue (Million), by Material 2025 & 2033
- Figure 3: North America US Single-Use Plastic Bags Market Revenue Share (%), by Material 2025 & 2033
- Figure 4: North America US Single-Use Plastic Bags Market Revenue (Million), by End-user Industry 2025 & 2033
- Figure 5: North America US Single-Use Plastic Bags Market Revenue Share (%), by End-user Industry 2025 & 2033
- Figure 6: North America US Single-Use Plastic Bags Market Revenue (Million), by Country 2025 & 2033
- Figure 7: North America US Single-Use Plastic Bags Market Revenue Share (%), by Country 2025 & 2033
- Figure 8: South America US Single-Use Plastic Bags Market Revenue (Million), by Material 2025 & 2033
- Figure 9: South America US Single-Use Plastic Bags Market Revenue Share (%), by Material 2025 & 2033
- Figure 10: South America US Single-Use Plastic Bags Market Revenue (Million), by End-user Industry 2025 & 2033
- Figure 11: South America US Single-Use Plastic Bags Market Revenue Share (%), by End-user Industry 2025 & 2033
- Figure 12: South America US Single-Use Plastic Bags Market Revenue (Million), by Country 2025 & 2033
- Figure 13: South America US Single-Use Plastic Bags Market Revenue Share (%), by Country 2025 & 2033
- Figure 14: Europe US Single-Use Plastic Bags Market Revenue (Million), by Material 2025 & 2033
- Figure 15: Europe US Single-Use Plastic Bags Market Revenue Share (%), by Material 2025 & 2033
- Figure 16: Europe US Single-Use Plastic Bags Market Revenue (Million), by End-user Industry 2025 & 2033
- Figure 17: Europe US Single-Use Plastic Bags Market Revenue Share (%), by End-user Industry 2025 & 2033
- Figure 18: Europe US Single-Use Plastic Bags Market Revenue (Million), by Country 2025 & 2033
- Figure 19: Europe US Single-Use Plastic Bags Market Revenue Share (%), by Country 2025 & 2033
- Figure 20: Middle East & Africa US Single-Use Plastic Bags Market Revenue (Million), by Material 2025 & 2033
- Figure 21: Middle East & Africa US Single-Use Plastic Bags Market Revenue Share (%), by Material 2025 & 2033
- Figure 22: Middle East & Africa US Single-Use Plastic Bags Market Revenue (Million), by End-user Industry 2025 & 2033
- Figure 23: Middle East & Africa US Single-Use Plastic Bags Market Revenue Share (%), by End-user Industry 2025 & 2033
- Figure 24: Middle East & Africa US Single-Use Plastic Bags Market Revenue (Million), by Country 2025 & 2033
- Figure 25: Middle East & Africa US Single-Use Plastic Bags Market Revenue Share (%), by Country 2025 & 2033
- Figure 26: Asia Pacific US Single-Use Plastic Bags Market Revenue (Million), by Material 2025 & 2033
- Figure 27: Asia Pacific US Single-Use Plastic Bags Market Revenue Share (%), by Material 2025 & 2033
- Figure 28: Asia Pacific US Single-Use Plastic Bags Market Revenue (Million), by End-user Industry 2025 & 2033
- Figure 29: Asia Pacific US Single-Use Plastic Bags Market Revenue Share (%), by End-user Industry 2025 & 2033
- Figure 30: Asia Pacific US Single-Use Plastic Bags Market Revenue (Million), by Country 2025 & 2033
- Figure 31: Asia Pacific US Single-Use Plastic Bags Market Revenue Share (%), by Country 2025 & 2033
List of Tables
- Table 1: Global US Single-Use Plastic Bags Market Revenue Million Forecast, by Material 2020 & 2033
- Table 2: Global US Single-Use Plastic Bags Market Revenue Million Forecast, by End-user Industry 2020 & 2033
- Table 3: Global US Single-Use Plastic Bags Market Revenue Million Forecast, by Region 2020 & 2033
- Table 4: Global US Single-Use Plastic Bags Market Revenue Million Forecast, by Material 2020 & 2033
- Table 5: Global US Single-Use Plastic Bags Market Revenue Million Forecast, by End-user Industry 2020 & 2033
- Table 6: Global US Single-Use Plastic Bags Market Revenue Million Forecast, by Country 2020 & 2033
- Table 7: United States US Single-Use Plastic Bags Market Revenue (Million) Forecast, by Application 2020 & 2033
- Table 8: Canada US Single-Use Plastic Bags Market Revenue (Million) Forecast, by Application 2020 & 2033
- Table 9: Mexico US Single-Use Plastic Bags Market Revenue (Million) Forecast, by Application 2020 & 2033
- Table 10: Global US Single-Use Plastic Bags Market Revenue Million Forecast, by Material 2020 & 2033
- Table 11: Global US Single-Use Plastic Bags Market Revenue Million Forecast, by End-user Industry 2020 & 2033
- Table 12: Global US Single-Use Plastic Bags Market Revenue Million Forecast, by Country 2020 & 2033
- Table 13: Brazil US Single-Use Plastic Bags Market Revenue (Million) Forecast, by Application 2020 & 2033
- Table 14: Argentina US Single-Use Plastic Bags Market Revenue (Million) Forecast, by Application 2020 & 2033
- Table 15: Rest of South America US Single-Use Plastic Bags Market Revenue (Million) Forecast, by Application 2020 & 2033
- Table 16: Global US Single-Use Plastic Bags Market Revenue Million Forecast, by Material 2020 & 2033
- Table 17: Global US Single-Use Plastic Bags Market Revenue Million Forecast, by End-user Industry 2020 & 2033
- Table 18: Global US Single-Use Plastic Bags Market Revenue Million Forecast, by Country 2020 & 2033
- Table 19: United Kingdom US Single-Use Plastic Bags Market Revenue (Million) Forecast, by Application 2020 & 2033
- Table 20: Germany US Single-Use Plastic Bags Market Revenue (Million) Forecast, by Application 2020 & 2033
- Table 21: France US Single-Use Plastic Bags Market Revenue (Million) Forecast, by Application 2020 & 2033
- Table 22: Italy US Single-Use Plastic Bags Market Revenue (Million) Forecast, by Application 2020 & 2033
- Table 23: Spain US Single-Use Plastic Bags Market Revenue (Million) Forecast, by Application 2020 & 2033
- Table 24: Russia US Single-Use Plastic Bags Market Revenue (Million) Forecast, by Application 2020 & 2033
- Table 25: Benelux US Single-Use Plastic Bags Market Revenue (Million) Forecast, by Application 2020 & 2033
- Table 26: Nordics US Single-Use Plastic Bags Market Revenue (Million) Forecast, by Application 2020 & 2033
- Table 27: Rest of Europe US Single-Use Plastic Bags Market Revenue (Million) Forecast, by Application 2020 & 2033
- Table 28: Global US Single-Use Plastic Bags Market Revenue Million Forecast, by Material 2020 & 2033
- Table 29: Global US Single-Use Plastic Bags Market Revenue Million Forecast, by End-user Industry 2020 & 2033
- Table 30: Global US Single-Use Plastic Bags Market Revenue Million Forecast, by Country 2020 & 2033
- Table 31: Turkey US Single-Use Plastic Bags Market Revenue (Million) Forecast, by Application 2020 & 2033
- Table 32: Israel US Single-Use Plastic Bags Market Revenue (Million) Forecast, by Application 2020 & 2033
- Table 33: GCC US Single-Use Plastic Bags Market Revenue (Million) Forecast, by Application 2020 & 2033
- Table 34: North Africa US Single-Use Plastic Bags Market Revenue (Million) Forecast, by Application 2020 & 2033
- Table 35: South Africa US Single-Use Plastic Bags Market Revenue (Million) Forecast, by Application 2020 & 2033
- Table 36: Rest of Middle East & Africa US Single-Use Plastic Bags Market Revenue (Million) Forecast, by Application 2020 & 2033
- Table 37: Global US Single-Use Plastic Bags Market Revenue Million Forecast, by Material 2020 & 2033
- Table 38: Global US Single-Use Plastic Bags Market Revenue Million Forecast, by End-user Industry 2020 & 2033
- Table 39: Global US Single-Use Plastic Bags Market Revenue Million Forecast, by Country 2020 & 2033
- Table 40: China US Single-Use Plastic Bags Market Revenue (Million) Forecast, by Application 2020 & 2033
- Table 41: India US Single-Use Plastic Bags Market Revenue (Million) Forecast, by Application 2020 & 2033
- Table 42: Japan US Single-Use Plastic Bags Market Revenue (Million) Forecast, by Application 2020 & 2033
- Table 43: South Korea US Single-Use Plastic Bags Market Revenue (Million) Forecast, by Application 2020 & 2033
- Table 44: ASEAN US Single-Use Plastic Bags Market Revenue (Million) Forecast, by Application 2020 & 2033
- Table 45: Oceania US Single-Use Plastic Bags Market Revenue (Million) Forecast, by Application 2020 & 2033
- Table 46: Rest of Asia Pacific US Single-Use Plastic Bags Market Revenue (Million) Forecast, by Application 2020 & 2033
Frequently Asked Questions
1. What is the projected Compound Annual Growth Rate (CAGR) of the US Single-Use Plastic Bags Market?
The projected CAGR is approximately 2.72%.
2. Which companies are prominent players in the US Single-Use Plastic Bags Market?
Key companies in the market include Amcor Plc, Snapsil Corporation, Graphic Packaging International Inc, Fuling Plastic USA Inc, Georgia-Pacific LLC, PPC Flexible Packaging LLC, Pactiv LLC, Novolex, Berry Global Inc, Dart Container Corporation.
3. What are the main segments of the US Single-Use Plastic Bags Market?
The market segments include Material, End-user Industry.
4. Can you provide details about the market size?
The market size is estimated to be USD 26.96 Million as of 2022.
5. What are some drivers contributing to market growth?
Ongoing Trend Toward Lightweight and Use of Sustainable Solutions (such as Paper-based Cups); Flexible Single-use Packaging Products Offering Increased Convenience and Utility.
6. What are the notable trends driving market growth?
Flexible Single-use Plastic Packaging Products Offering Increased Convenience and Utility.
7. Are there any restraints impacting market growth?
High upfront and operational cost for deploying coding and making equipment.
8. Can you provide examples of recent developments in the market?
September 2022: Novolex, a North American company, invested USD 10 million to expand the Indiana, United States, recycling facility's capacity, enabling the recycling of plastic bags and other PE films. After the procurement of mechanical recycling equipment, the plant will be able to produce up to 28 million lbs (12,698 MT) of recycled material yearly to generate new goods made from post-consumer or post-industrial recycled material.
9. What pricing options are available for accessing the report?
Pricing options include single-user, multi-user, and enterprise licenses priced at USD 3800, USD 4500, and USD 5800 respectively.
10. Is the market size provided in terms of value or volume?
The market size is provided in terms of value, measured in Million.
11. Are there any specific market keywords associated with the report?
Yes, the market keyword associated with the report is "US Single-Use Plastic Bags Market," which aids in identifying and referencing the specific market segment covered.
12. How do I determine which pricing option suits my needs best?
The pricing options vary based on user requirements and access needs. Individual users may opt for single-user licenses, while businesses requiring broader access may choose multi-user or enterprise licenses for cost-effective access to the report.
13. Are there any additional resources or data provided in the US Single-Use Plastic Bags Market report?
While the report offers comprehensive insights, it's advisable to review the specific contents or supplementary materials provided to ascertain if additional resources or data are available.
14. How can I stay updated on further developments or reports in the US Single-Use Plastic Bags Market?
To stay informed about further developments, trends, and reports in the US Single-Use Plastic Bags Market, consider subscribing to industry newsletters, following relevant companies and organizations, or regularly checking reputable industry news sources and publications.
Methodology
Step 1 - Identification of Relevant Samples Size from Population Database


Step 2 - Approaches for Defining Global Market Size (Value, Volume* & Price*)

Note*: In applicable scenarios
Step 3 - Data Sources
Primary Research
- Web Analytics
- Survey Reports
- Research Institute
- Latest Research Reports
- Opinion Leaders
Secondary Research
- Annual Reports
- White Paper
- Latest Press Release
- Industry Association
- Paid Database
- Investor Presentations

Step 4 - Data Triangulation
Involves using different sources of information in order to increase the validity of a study
These sources are likely to be stakeholders in a program - participants, other researchers, program staff, other community members, and so on.
Then we put all data in single framework & apply various statistical tools to find out the dynamic on the market.
During the analysis stage, feedback from the stakeholder groups would be compared to determine areas of agreement as well as areas of divergence