

Key Insights
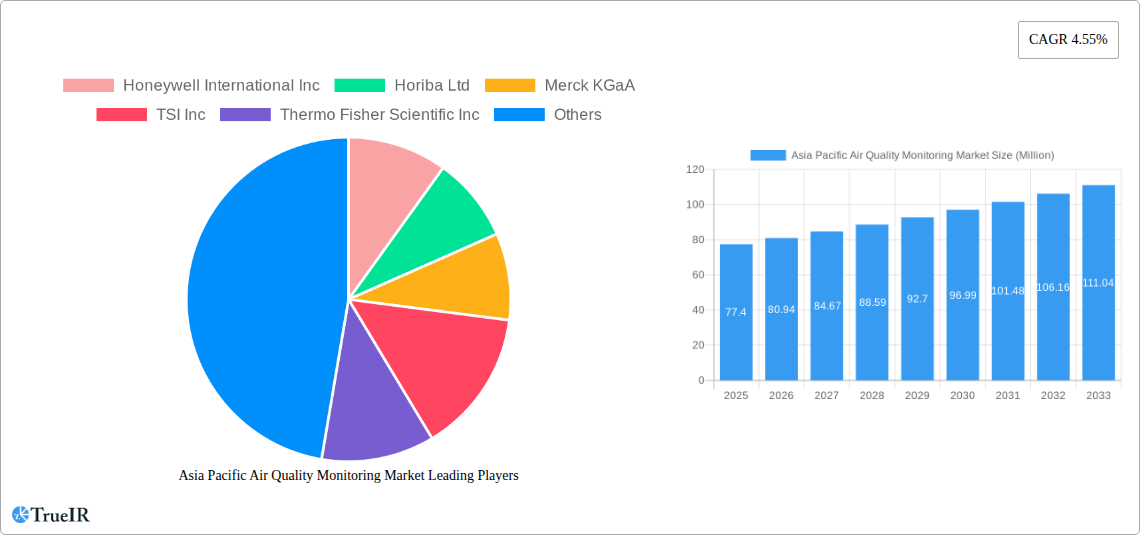
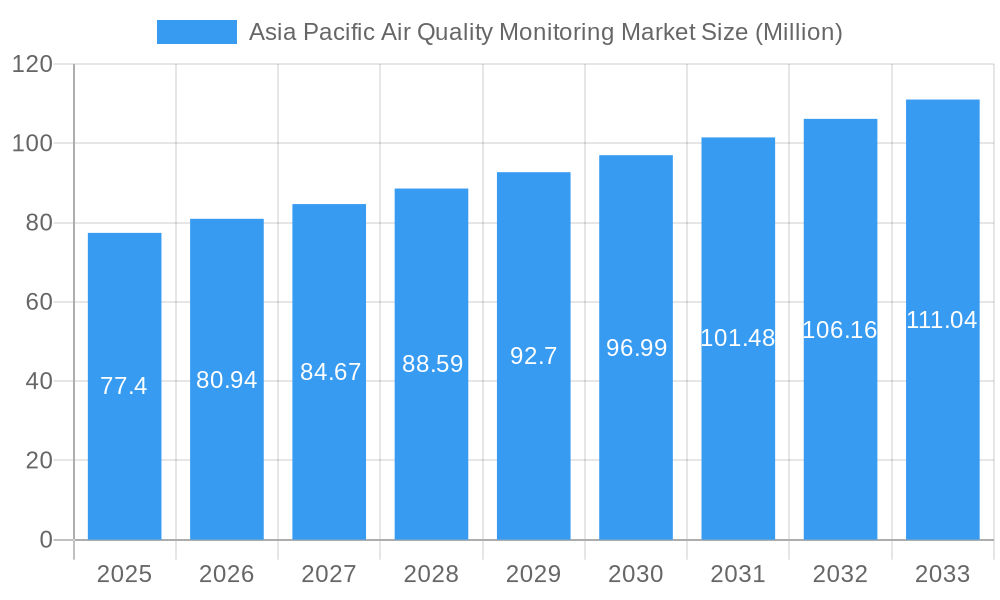
The Asia Pacific air quality monitoring market, valued at $77.40 million in 2025, is projected to experience robust growth, driven by increasing environmental concerns, stringent government regulations, and rapid industrialization across the region. A compound annual growth rate (CAGR) of 4.55% from 2025 to 2033 indicates a significant expansion in market size. Key growth drivers include rising air pollution levels in major cities like Delhi, Mumbai, and Beijing, coupled with increasing public awareness and demand for cleaner air. The market is segmented by sampling method (continuous, manual, intermittent), pollutant type (chemical, physical, biological), end-user (residential & commercial, power generation, petrochemicals, others), and product type (indoor and outdoor monitors). Continuous monitoring systems are gaining traction due to their real-time data provision for effective pollution control. The demand for chemical pollutant monitoring is especially high, driven by concerns regarding industrial emissions and vehicle exhaust. China, India, and Japan are expected to dominate the regional market due to their high population density, significant industrial activity, and growing investments in air quality management infrastructure. While technological advancements are pushing the market forward, factors like high initial investment costs for sophisticated monitoring equipment and a lack of awareness in certain regions could pose challenges to market growth. The presence of major players such as Honeywell, Horiba, and Thermo Fisher Scientific indicates a competitive landscape characterized by technological innovation and strategic partnerships.
Asia Pacific Air Quality Monitoring Market Market Size (In Million)
The forecast period of 2025-2033 suggests a substantial market expansion fueled by government initiatives promoting cleaner air, increased adoption of advanced monitoring technologies, and the expanding awareness of air quality's impact on public health. The rising demand for accurate and reliable data to inform effective pollution control strategies further enhances the growth trajectory. The Asia Pacific region's diverse geographic landscape and varying levels of industrial development will influence the adoption rates of different monitoring technologies across specific segments. Specific market segments like continuous monitoring and chemical pollutant detection are anticipated to demonstrate higher growth rates than other segments due to their critical role in comprehensive air quality management. As technological advancements continue and awareness grows, the market is positioned for continued growth and development throughout the forecast period.
Asia Pacific Air Quality Monitoring Market Company Market Share
This comprehensive report provides an in-depth analysis of the Asia Pacific Air Quality Monitoring Market, offering valuable insights for businesses, investors, and policymakers. The study period spans from 2019 to 2033, with 2025 serving as the base and estimated year. The report covers market size, segmentation, key players, growth drivers, challenges, and future outlook, offering a 360-degree view of this dynamic market expected to reach xx Million by 2033.
Asia Pacific Air Quality Monitoring Market Market Structure & Competitive Landscape
The Asia Pacific air quality monitoring market is characterized by a moderately concentrated structure, with several major players holding significant market share. The market concentration ratio (CR4) is estimated at xx%, indicating a mix of large multinational corporations and specialized regional players. Innovation is a key driver, with companies continuously developing advanced technologies such as IoT-enabled sensors and AI-powered analytics to improve monitoring accuracy and efficiency. Stringent government regulations aimed at improving air quality across the region are also significant market drivers, compelling industries to adopt advanced monitoring solutions. Product substitutes, such as traditional manual methods, exist but are rapidly losing ground to more sophisticated technologies. The market exhibits substantial end-user segmentation, with significant demand from power generation, petrochemicals, and residential and commercial sectors. The market has also seen a moderate level of mergers and acquisitions (M&A) activity in recent years, with xx M&A deals valued at approximately xx Million recorded between 2019 and 2024. This activity reflects the increasing consolidation and strategic expansion within the industry.
- Market Concentration: CR4 estimated at xx%
- Innovation Drivers: IoT-enabled sensors, AI-powered analytics
- Regulatory Impacts: Stringent government regulations driving adoption
- Product Substitutes: Traditional manual methods facing decline
- End-User Segmentation: Power generation, petrochemicals, residential & commercial dominating.
- M&A Trends: xx M&A deals between 2019 and 2024, valued at approximately xx Million.
Asia Pacific Air Quality Monitoring Market Market Trends & Opportunities
The Asia Pacific air quality monitoring market is experiencing robust growth, with a Compound Annual Growth Rate (CAGR) of xx% projected from 2025 to 2033. This growth is fueled by several key factors. Rising concerns about air pollution and its adverse health impacts are driving increased demand for effective monitoring solutions. Technological advancements, such as the development of more accurate and cost-effective sensors, are expanding market opportunities. Shifting consumer preferences towards healthier living environments are also boosting the demand for both indoor and outdoor air quality monitors. Competitive dynamics are intense, with companies focusing on product differentiation, technological innovation, and strategic partnerships to gain a competitive edge. Market penetration rates are increasing across various segments, particularly in urban areas with high pollution levels. The market is also witnessing the emergence of new business models, such as air quality monitoring-as-a-service, which offer flexible and cost-effective solutions to businesses and governments. Government initiatives promoting clean air and sustainable development are further driving market expansion.
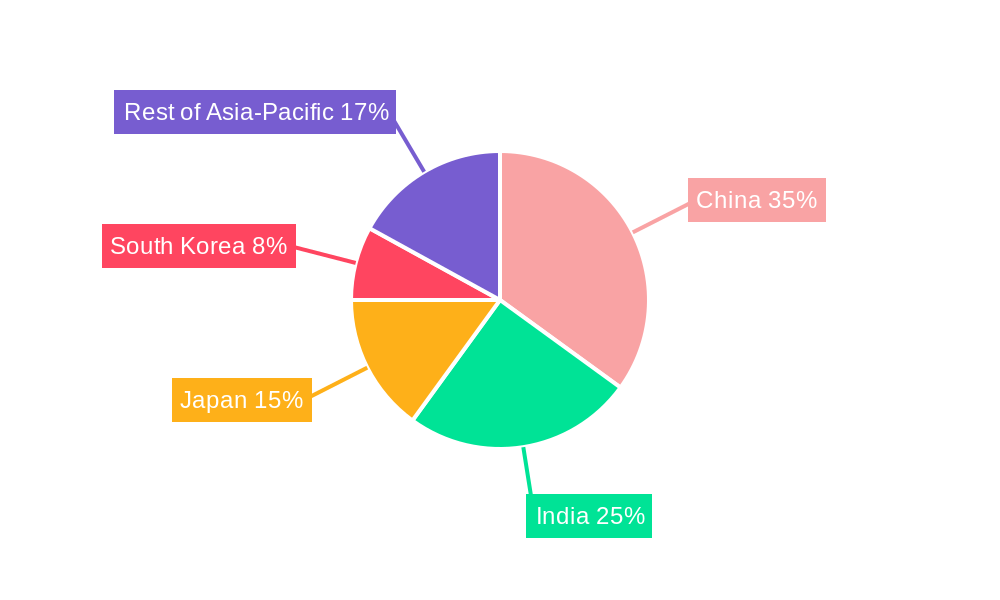
Dominant Markets & Segments in Asia Pacific Air Quality Monitoring Market
China and India are currently the dominant markets within the Asia Pacific region, driven by rapid urbanization, industrialization, and increasing awareness of air pollution issues. Within market segmentation:
- Sampling Method: Continuous monitoring systems hold the largest market share, followed by intermittent and manual methods. The continuous segment is experiencing the fastest growth due to its ability to provide real-time data.
- Pollutant Type: Chemical pollutants (PM2.5, PM10, SO2, NOx) currently dominate the market, but the demand for biological pollutant monitoring is growing rapidly.
- End User: The power generation and industrial sectors are major consumers, followed by the residential and commercial sectors. Government investments in infrastructure projects are a key growth driver.
- Product Type: Outdoor monitors hold a larger market share compared to indoor monitors, reflecting the greater focus on ambient air quality monitoring.
Key Growth Drivers:
- Stringent Government Regulations: Increased investment in air quality improvement initiatives.
- Rising Air Pollution Levels: Driving demand for effective monitoring solutions across major cities.
- Technological Advancements: Miniaturization, improved accuracy and lower costs.
- Growing Environmental Awareness: Increasing public and private sector investment in better air quality management.
Asia Pacific Air Quality Monitoring Market Product Analysis
The Asia Pacific air quality monitoring market is characterized by continuous innovation in product design and functionality. Miniaturization of sensors, advanced data analytics capabilities, and the integration of IoT technologies are enhancing the performance and usability of air quality monitoring systems. This allows for real-time data acquisition and remote monitoring, which improves the overall effectiveness of air quality management programs. The market is seeing the emergence of integrated solutions that combine multiple sensors to measure a wider range of pollutants, providing a more comprehensive picture of air quality. The success of these products depends on their accuracy, reliability, affordability, and ease of use.
Key Drivers, Barriers & Challenges in Asia Pacific Air Quality Monitoring Market
Key Drivers:
- Government Regulations: Stringent environmental regulations and mandates are compelling industries to adopt air quality monitoring.
- Technological Advancements: More accurate and cost-effective sensors, IoT integration, and AI-driven data analytics.
- Rising Environmental Awareness: Growing public concern about air pollution is driving demand.
Key Challenges and Restraints:
- High Initial Investment Costs: The cost of implementing advanced monitoring systems can be prohibitive for some users.
- Data Management and Analysis: Handling and interpreting large datasets can be complex.
- Lack of Skilled Professionals: Shortage of trained personnel to operate and maintain the systems.
- Supply Chain Disruptions: Global supply chain issues can impact the availability and cost of monitoring equipment.
Growth Drivers in the Asia Pacific Air Quality Monitoring Market Market
The market is propelled by increased government investments in infrastructure development, stringent environmental regulations, technological advancements, and a growing awareness of air pollution's health impacts. The implementation of smart city initiatives further boosts demand for advanced monitoring systems. The rising adoption of industrial IoT (IIoT) solutions in various sectors is also contributing to the market's growth.
Challenges Impacting Asia Pacific Air Quality Monitoring Market Growth
Challenges include high initial investment costs, the complexity of data management and analysis, a shortage of skilled professionals, and potential supply chain disruptions. Regulatory complexities and varying standards across the region also pose obstacles.
Key Players Shaping the Asia Pacific Air Quality Monitoring Market Market
- Honeywell International Inc
- Horiba Ltd
- Merck KGaA
- TSI Inc
- Thermo Fisher Scientific Inc
- Aeroqual Limited
- Emerson Electric Co
- Siemens AG
- Agilent Technologies Inc
- 3M Co
- Teledyne Technologies Inc
Significant Asia Pacific Air Quality Monitoring Market Industry Milestones
- January 2023: The Indian government launched the AI-AQMS v1.0 air quality monitoring system.
- September 2022: The Asian Development Bank launched the Asia Clean Blue Skies Program (ACBSP) to improve air quality across the Asia-Pacific region.
Future Outlook for Asia Pacific Air Quality Monitoring Market Market
The Asia Pacific air quality monitoring market is poised for significant growth driven by government initiatives, technological advancements, and increasing environmental awareness. Strategic partnerships, product innovations, and expansion into emerging markets will create opportunities for key players. The market is expected to witness continued consolidation and the emergence of new business models, promising a dynamic and lucrative future.
Asia Pacific Air Quality Monitoring Market Segmentation
-
1. Product Type
- 1.1. Indoor Monitor
- 1.2. Outdoor Monitor
-
2. Sampling Method
- 2.1. Continuous
- 2.2. Manual
- 2.3. Intermittent
-
3. Pollutant Type
- 3.1. Chemical Pollutants
- 3.2. Physical Pollutants
- 3.3. Biological Pollutants
-
4. End User
- 4.1. Residential and Commercial
- 4.2. Power Generation
- 4.3. Petrochemicals
- 4.4. Other End Users
-
5. Geography
- 5.1. China
- 5.2. India
- 5.3. Japan
- 5.4. Singapore
- 5.5. Rest of Asia-Pacific
Asia Pacific Air Quality Monitoring Market Segmentation By Geography
- 1. China
- 2. India
- 3. Japan
- 4. Singapore
- 5. Rest of Asia Pacific
Asia Pacific Air Quality Monitoring Market Regional Market Share
Geographic Coverage of Asia Pacific Air Quality Monitoring Market
Asia Pacific Air Quality Monitoring Market REPORT HIGHLIGHTS
| Aspects | Details |
|---|---|
| Study Period | 2020-2034 |
| Base Year | 2025 |
| Estimated Year | 2026 |
| Forecast Period | 2026-2034 |
| Historical Period | 2020-2025 |
| Growth Rate | CAGR of 4.55% from 2020-2034 |
| Segmentation |
|
Table of Contents
- 1. Introduction
- 1.1. Research Scope
- 1.2. Market Segmentation
- 1.3. Research Objective
- 1.4. Definitions and Assumptions
- 2. Executive Summary
- 2.1. Market Snapshot
- 3. Market Dynamics
- 3.1. Market Drivers
- 3.2. Market Restrains
- 3.3. Market Trends
- 3.4. Market Opportunities
- 4. Market Factor Analysis
- 4.1. Porters Five Forces
- 4.1.1. Bargaining Power of Suppliers
- 4.1.2. Bargaining Power of Buyers
- 4.1.3. Threat of New Entrants
- 4.1.4. Threat of Substitutes
- 4.1.5. Competitive Rivalry
- 4.2. PESTEL analysis
- 4.3. BCG Analysis
- 4.3.1. Stars (High Growth, High Market Share)
- 4.3.2. Cash Cows (Low Growth, High Market Share)
- 4.3.3. Question Mark (High Growth, Low Market Share)
- 4.3.4. Dogs (Low Growth, Low Market Share)
- 4.4. Ansoff Matrix Analysis
- 4.5. Supply Chain Analysis
- 4.6. Regulatory Landscape
- 4.7. Current Market Potential and Opportunity Assessment (TAM–SAM–SOM Framework)
- 4.8. TIR Analyst Note
- 4.1. Porters Five Forces
- 5. Market Analysis, Insights and Forecast 2021-2033
- 5.1. Market Analysis, Insights and Forecast - by Product Type
- 5.1.1. Indoor Monitor
- 5.1.2. Outdoor Monitor
- 5.2. Market Analysis, Insights and Forecast - by Sampling Method
- 5.2.1. Continuous
- 5.2.2. Manual
- 5.2.3. Intermittent
- 5.3. Market Analysis, Insights and Forecast - by Pollutant Type
- 5.3.1. Chemical Pollutants
- 5.3.2. Physical Pollutants
- 5.3.3. Biological Pollutants
- 5.4. Market Analysis, Insights and Forecast - by End User
- 5.4.1. Residential and Commercial
- 5.4.2. Power Generation
- 5.4.3. Petrochemicals
- 5.4.4. Other End Users
- 5.5. Market Analysis, Insights and Forecast - by Geography
- 5.5.1. China
- 5.5.2. India
- 5.5.3. Japan
- 5.5.4. Singapore
- 5.5.5. Rest of Asia-Pacific
- 5.6. Market Analysis, Insights and Forecast - by Region
- 5.6.1. China
- 5.6.2. India
- 5.6.3. Japan
- 5.6.4. Singapore
- 5.6.5. Rest of Asia Pacific
- 5.1. Market Analysis, Insights and Forecast - by Product Type
- 6. Asia Pacific Air Quality Monitoring Market Analysis, Insights and Forecast, 2021-2033
- 6.1. Market Analysis, Insights and Forecast - by Product Type
- 6.1.1. Indoor Monitor
- 6.1.2. Outdoor Monitor
- 6.2. Market Analysis, Insights and Forecast - by Sampling Method
- 6.2.1. Continuous
- 6.2.2. Manual
- 6.2.3. Intermittent
- 6.3. Market Analysis, Insights and Forecast - by Pollutant Type
- 6.3.1. Chemical Pollutants
- 6.3.2. Physical Pollutants
- 6.3.3. Biological Pollutants
- 6.4. Market Analysis, Insights and Forecast - by End User
- 6.4.1. Residential and Commercial
- 6.4.2. Power Generation
- 6.4.3. Petrochemicals
- 6.4.4. Other End Users
- 6.5. Market Analysis, Insights and Forecast - by Geography
- 6.5.1. China
- 6.5.2. India
- 6.5.3. Japan
- 6.5.4. Singapore
- 6.5.5. Rest of Asia-Pacific
- 6.1. Market Analysis, Insights and Forecast - by Product Type
- 7. China Asia Pacific Air Quality Monitoring Market Analysis, Insights and Forecast, 2020-2032
- 7.1. Market Analysis, Insights and Forecast - by Product Type
- 7.1.1. Indoor Monitor
- 7.1.2. Outdoor Monitor
- 7.2. Market Analysis, Insights and Forecast - by Sampling Method
- 7.2.1. Continuous
- 7.2.2. Manual
- 7.2.3. Intermittent
- 7.3. Market Analysis, Insights and Forecast - by Pollutant Type
- 7.3.1. Chemical Pollutants
- 7.3.2. Physical Pollutants
- 7.3.3. Biological Pollutants
- 7.4. Market Analysis, Insights and Forecast - by End User
- 7.4.1. Residential and Commercial
- 7.4.2. Power Generation
- 7.4.3. Petrochemicals
- 7.4.4. Other End Users
- 7.5. Market Analysis, Insights and Forecast - by Geography
- 7.5.1. China
- 7.5.2. India
- 7.5.3. Japan
- 7.5.4. Singapore
- 7.5.5. Rest of Asia-Pacific
- 7.1. Market Analysis, Insights and Forecast - by Product Type
- 8. India Asia Pacific Air Quality Monitoring Market Analysis, Insights and Forecast, 2020-2032
- 8.1. Market Analysis, Insights and Forecast - by Product Type
- 8.1.1. Indoor Monitor
- 8.1.2. Outdoor Monitor
- 8.2. Market Analysis, Insights and Forecast - by Sampling Method
- 8.2.1. Continuous
- 8.2.2. Manual
- 8.2.3. Intermittent
- 8.3. Market Analysis, Insights and Forecast - by Pollutant Type
- 8.3.1. Chemical Pollutants
- 8.3.2. Physical Pollutants
- 8.3.3. Biological Pollutants
- 8.4. Market Analysis, Insights and Forecast - by End User
- 8.4.1. Residential and Commercial
- 8.4.2. Power Generation
- 8.4.3. Petrochemicals
- 8.4.4. Other End Users
- 8.5. Market Analysis, Insights and Forecast - by Geography
- 8.5.1. China
- 8.5.2. India
- 8.5.3. Japan
- 8.5.4. Singapore
- 8.5.5. Rest of Asia-Pacific
- 8.1. Market Analysis, Insights and Forecast - by Product Type
- 9. Japan Asia Pacific Air Quality Monitoring Market Analysis, Insights and Forecast, 2020-2032
- 9.1. Market Analysis, Insights and Forecast - by Product Type
- 9.1.1. Indoor Monitor
- 9.1.2. Outdoor Monitor
- 9.2. Market Analysis, Insights and Forecast - by Sampling Method
- 9.2.1. Continuous
- 9.2.2. Manual
- 9.2.3. Intermittent
- 9.3. Market Analysis, Insights and Forecast - by Pollutant Type
- 9.3.1. Chemical Pollutants
- 9.3.2. Physical Pollutants
- 9.3.3. Biological Pollutants
- 9.4. Market Analysis, Insights and Forecast - by End User
- 9.4.1. Residential and Commercial
- 9.4.2. Power Generation
- 9.4.3. Petrochemicals
- 9.4.4. Other End Users
- 9.5. Market Analysis, Insights and Forecast - by Geography
- 9.5.1. China
- 9.5.2. India
- 9.5.3. Japan
- 9.5.4. Singapore
- 9.5.5. Rest of Asia-Pacific
- 9.1. Market Analysis, Insights and Forecast - by Product Type
- 10. Singapore Asia Pacific Air Quality Monitoring Market Analysis, Insights and Forecast, 2020-2032
- 10.1. Market Analysis, Insights and Forecast - by Product Type
- 10.1.1. Indoor Monitor
- 10.1.2. Outdoor Monitor
- 10.2. Market Analysis, Insights and Forecast - by Sampling Method
- 10.2.1. Continuous
- 10.2.2. Manual
- 10.2.3. Intermittent
- 10.3. Market Analysis, Insights and Forecast - by Pollutant Type
- 10.3.1. Chemical Pollutants
- 10.3.2. Physical Pollutants
- 10.3.3. Biological Pollutants
- 10.4. Market Analysis, Insights and Forecast - by End User
- 10.4.1. Residential and Commercial
- 10.4.2. Power Generation
- 10.4.3. Petrochemicals
- 10.4.4. Other End Users
- 10.5. Market Analysis, Insights and Forecast - by Geography
- 10.5.1. China
- 10.5.2. India
- 10.5.3. Japan
- 10.5.4. Singapore
- 10.5.5. Rest of Asia-Pacific
- 10.1. Market Analysis, Insights and Forecast - by Product Type
- 11. Rest of Asia Pacific Asia Pacific Air Quality Monitoring Market Analysis, Insights and Forecast, 2020-2032
- 11.1. Market Analysis, Insights and Forecast - by Product Type
- 11.1.1. Indoor Monitor
- 11.1.2. Outdoor Monitor
- 11.2. Market Analysis, Insights and Forecast - by Sampling Method
- 11.2.1. Continuous
- 11.2.2. Manual
- 11.2.3. Intermittent
- 11.3. Market Analysis, Insights and Forecast - by Pollutant Type
- 11.3.1. Chemical Pollutants
- 11.3.2. Physical Pollutants
- 11.3.3. Biological Pollutants
- 11.4. Market Analysis, Insights and Forecast - by End User
- 11.4.1. Residential and Commercial
- 11.4.2. Power Generation
- 11.4.3. Petrochemicals
- 11.4.4. Other End Users
- 11.5. Market Analysis, Insights and Forecast - by Geography
- 11.5.1. China
- 11.5.2. India
- 11.5.3. Japan
- 11.5.4. Singapore
- 11.5.5. Rest of Asia-Pacific
- 11.1. Market Analysis, Insights and Forecast - by Product Type
- 12. Competitive Analysis
- 12.1. Company Profiles
- 12.1.1 Honeywell International Inc
- 12.1.1.1. Company Overview
- 12.1.1.2. Products
- 12.1.1.3. Company Financials
- 12.1.1.4. SWOT Analysis
- 12.1.2 Horiba Ltd
- 12.1.2.1. Company Overview
- 12.1.2.2. Products
- 12.1.2.3. Company Financials
- 12.1.2.4. SWOT Analysis
- 12.1.3 Merck KGaA
- 12.1.3.1. Company Overview
- 12.1.3.2. Products
- 12.1.3.3. Company Financials
- 12.1.3.4. SWOT Analysis
- 12.1.4 TSI Inc
- 12.1.4.1. Company Overview
- 12.1.4.2. Products
- 12.1.4.3. Company Financials
- 12.1.4.4. SWOT Analysis
- 12.1.5 Thermo Fisher Scientific Inc
- 12.1.5.1. Company Overview
- 12.1.5.2. Products
- 12.1.5.3. Company Financials
- 12.1.5.4. SWOT Analysis
- 12.1.6 Aeroqual Limited*List Not Exhaustive
- 12.1.6.1. Company Overview
- 12.1.6.2. Products
- 12.1.6.3. Company Financials
- 12.1.6.4. SWOT Analysis
- 12.1.7 Emerson Electric Co
- 12.1.7.1. Company Overview
- 12.1.7.2. Products
- 12.1.7.3. Company Financials
- 12.1.7.4. SWOT Analysis
- 12.1.8 Siemens AG
- 12.1.8.1. Company Overview
- 12.1.8.2. Products
- 12.1.8.3. Company Financials
- 12.1.8.4. SWOT Analysis
- 12.1.9 Agilent Technologies Inc
- 12.1.9.1. Company Overview
- 12.1.9.2. Products
- 12.1.9.3. Company Financials
- 12.1.9.4. SWOT Analysis
- 12.1.10 3M Co
- 12.1.10.1. Company Overview
- 12.1.10.2. Products
- 12.1.10.3. Company Financials
- 12.1.10.4. SWOT Analysis
- 12.1.11 Teledyne Technologies Inc
- 12.1.11.1. Company Overview
- 12.1.11.2. Products
- 12.1.11.3. Company Financials
- 12.1.11.4. SWOT Analysis
- 12.1.1 Honeywell International Inc
- 12.2. Market Entropy
- 12.2.1 Company's Key Areas Served
- 12.2.2 Recent Developments
- 12.3. Company Market Share Analysis 2025
- 12.3.1 Top 5 Companies Market Share Analysis
- 12.3.2 Top 3 Companies Market Share Analysis
- 12.4. List of Potential Customers
- 13. Research Methodology
List of Figures
- Figure 1: Asia Pacific Air Quality Monitoring Market Revenue Breakdown (Million, %) by Product 2025 & 2033
- Figure 2: Asia Pacific Air Quality Monitoring Market Share (%) by Company 2025
List of Tables
- Table 1: Asia Pacific Air Quality Monitoring Market Revenue Million Forecast, by Product Type 2020 & 2033
- Table 2: Asia Pacific Air Quality Monitoring Market Revenue Million Forecast, by Sampling Method 2020 & 2033
- Table 3: Asia Pacific Air Quality Monitoring Market Revenue Million Forecast, by Pollutant Type 2020 & 2033
- Table 4: Asia Pacific Air Quality Monitoring Market Revenue Million Forecast, by End User 2020 & 2033
- Table 5: Asia Pacific Air Quality Monitoring Market Revenue Million Forecast, by Geography 2020 & 2033
- Table 6: Asia Pacific Air Quality Monitoring Market Revenue Million Forecast, by Region 2020 & 2033
- Table 7: Asia Pacific Air Quality Monitoring Market Revenue Million Forecast, by Product Type 2020 & 2033
- Table 8: Asia Pacific Air Quality Monitoring Market Revenue Million Forecast, by Sampling Method 2020 & 2033
- Table 9: Asia Pacific Air Quality Monitoring Market Revenue Million Forecast, by Pollutant Type 2020 & 2033
- Table 10: Asia Pacific Air Quality Monitoring Market Revenue Million Forecast, by End User 2020 & 2033
- Table 11: Asia Pacific Air Quality Monitoring Market Revenue Million Forecast, by Geography 2020 & 2033
- Table 12: Asia Pacific Air Quality Monitoring Market Revenue Million Forecast, by Country 2020 & 2033
- Table 13: Asia Pacific Air Quality Monitoring Market Revenue Million Forecast, by Product Type 2020 & 2033
- Table 14: Asia Pacific Air Quality Monitoring Market Revenue Million Forecast, by Sampling Method 2020 & 2033
- Table 15: Asia Pacific Air Quality Monitoring Market Revenue Million Forecast, by Pollutant Type 2020 & 2033
- Table 16: Asia Pacific Air Quality Monitoring Market Revenue Million Forecast, by End User 2020 & 2033
- Table 17: Asia Pacific Air Quality Monitoring Market Revenue Million Forecast, by Geography 2020 & 2033
- Table 18: Asia Pacific Air Quality Monitoring Market Revenue Million Forecast, by Country 2020 & 2033
- Table 19: Asia Pacific Air Quality Monitoring Market Revenue Million Forecast, by Product Type 2020 & 2033
- Table 20: Asia Pacific Air Quality Monitoring Market Revenue Million Forecast, by Sampling Method 2020 & 2033
- Table 21: Asia Pacific Air Quality Monitoring Market Revenue Million Forecast, by Pollutant Type 2020 & 2033
- Table 22: Asia Pacific Air Quality Monitoring Market Revenue Million Forecast, by End User 2020 & 2033
- Table 23: Asia Pacific Air Quality Monitoring Market Revenue Million Forecast, by Geography 2020 & 2033
- Table 24: Asia Pacific Air Quality Monitoring Market Revenue Million Forecast, by Country 2020 & 2033
- Table 25: Asia Pacific Air Quality Monitoring Market Revenue Million Forecast, by Product Type 2020 & 2033
- Table 26: Asia Pacific Air Quality Monitoring Market Revenue Million Forecast, by Sampling Method 2020 & 2033
- Table 27: Asia Pacific Air Quality Monitoring Market Revenue Million Forecast, by Pollutant Type 2020 & 2033
- Table 28: Asia Pacific Air Quality Monitoring Market Revenue Million Forecast, by End User 2020 & 2033
- Table 29: Asia Pacific Air Quality Monitoring Market Revenue Million Forecast, by Geography 2020 & 2033
- Table 30: Asia Pacific Air Quality Monitoring Market Revenue Million Forecast, by Country 2020 & 2033
- Table 31: Asia Pacific Air Quality Monitoring Market Revenue Million Forecast, by Product Type 2020 & 2033
- Table 32: Asia Pacific Air Quality Monitoring Market Revenue Million Forecast, by Sampling Method 2020 & 2033
- Table 33: Asia Pacific Air Quality Monitoring Market Revenue Million Forecast, by Pollutant Type 2020 & 2033
- Table 34: Asia Pacific Air Quality Monitoring Market Revenue Million Forecast, by End User 2020 & 2033
- Table 35: Asia Pacific Air Quality Monitoring Market Revenue Million Forecast, by Geography 2020 & 2033
- Table 36: Asia Pacific Air Quality Monitoring Market Revenue Million Forecast, by Country 2020 & 2033
Frequently Asked Questions
1. What is the projected Compound Annual Growth Rate (CAGR) of the Asia Pacific Air Quality Monitoring Market?
The projected CAGR is approximately 4.55%.
2. Which companies are prominent players in the Asia Pacific Air Quality Monitoring Market?
Key companies in the market include Honeywell International Inc, Horiba Ltd, Merck KGaA, TSI Inc, Thermo Fisher Scientific Inc, Aeroqual Limited*List Not Exhaustive, Emerson Electric Co, Siemens AG, Agilent Technologies Inc, 3M Co, Teledyne Technologies Inc.
3. What are the main segments of the Asia Pacific Air Quality Monitoring Market?
The market segments include Product Type, Sampling Method, Pollutant Type, End User, Geography.
4. Can you provide details about the market size?
The market size is estimated to be USD 77.40 Million as of 2022.
5. What are some drivers contributing to market growth?
4.; Increasing Awareness and Favorable Government Policies and Non-government Initiatives for Curbing Air Pollution.
6. What are the notable trends driving market growth?
Outdoor Segment to Witness Significant Growth.
7. Are there any restraints impacting market growth?
4.; High Costs of Air Quality Monitoring Systems.
8. Can you provide examples of recent developments in the market?
Januaru 2023: The government of India launched the Technology for Air Quality Monitoring System (AI-AQMS v1.0) developed under MeitY-supported projects. The Centre for Development of Advanced Computing (C-DAC), Kolkata, in partnership with TeXMIN, ISM, Dhanbad under the ‘National program on Electronics and ICT applications in Agriculture and Environment (AgriEnIcs)’ has developed an outdoor air quality monitoring station to monitor environmental pollutants which includes parameters like PM 1.0, PM 2.5, PM 10.0, SO2, NO2, CO, O2, ambient temperature, relative humidity etc., for continuous air quality analysis of the environment.
9. What pricing options are available for accessing the report?
Pricing options include single-user, multi-user, and enterprise licenses priced at USD 4750, USD 5250, and USD 8750 respectively.
10. Is the market size provided in terms of value or volume?
The market size is provided in terms of value, measured in Million.
11. Are there any specific market keywords associated with the report?
Yes, the market keyword associated with the report is "Asia Pacific Air Quality Monitoring Market," which aids in identifying and referencing the specific market segment covered.
12. How do I determine which pricing option suits my needs best?
The pricing options vary based on user requirements and access needs. Individual users may opt for single-user licenses, while businesses requiring broader access may choose multi-user or enterprise licenses for cost-effective access to the report.
13. Are there any additional resources or data provided in the Asia Pacific Air Quality Monitoring Market report?
While the report offers comprehensive insights, it's advisable to review the specific contents or supplementary materials provided to ascertain if additional resources or data are available.
14. How can I stay updated on further developments or reports in the Asia Pacific Air Quality Monitoring Market?
To stay informed about further developments, trends, and reports in the Asia Pacific Air Quality Monitoring Market, consider subscribing to industry newsletters, following relevant companies and organizations, or regularly checking reputable industry news sources and publications.
Methodology
Step 1 - Identification of Relevant Samples Size from Population Database


Step 2 - Approaches for Defining Global Market Size (Value, Volume* & Price*)

Note*: In applicable scenarios
Step 3 - Data Sources
Primary Research
- Web Analytics
- Survey Reports
- Research Institute
- Latest Research Reports
- Opinion Leaders
Secondary Research
- Annual Reports
- White Paper
- Latest Press Release
- Industry Association
- Paid Database
- Investor Presentations

Step 4 - Data Triangulation
Involves using different sources of information in order to increase the validity of a study
These sources are likely to be stakeholders in a program - participants, other researchers, program staff, other community members, and so on.
Then we put all data in single framework & apply various statistical tools to find out the dynamic on the market.
During the analysis stage, feedback from the stakeholder groups would be compared to determine areas of agreement as well as areas of divergence