

Key Insights
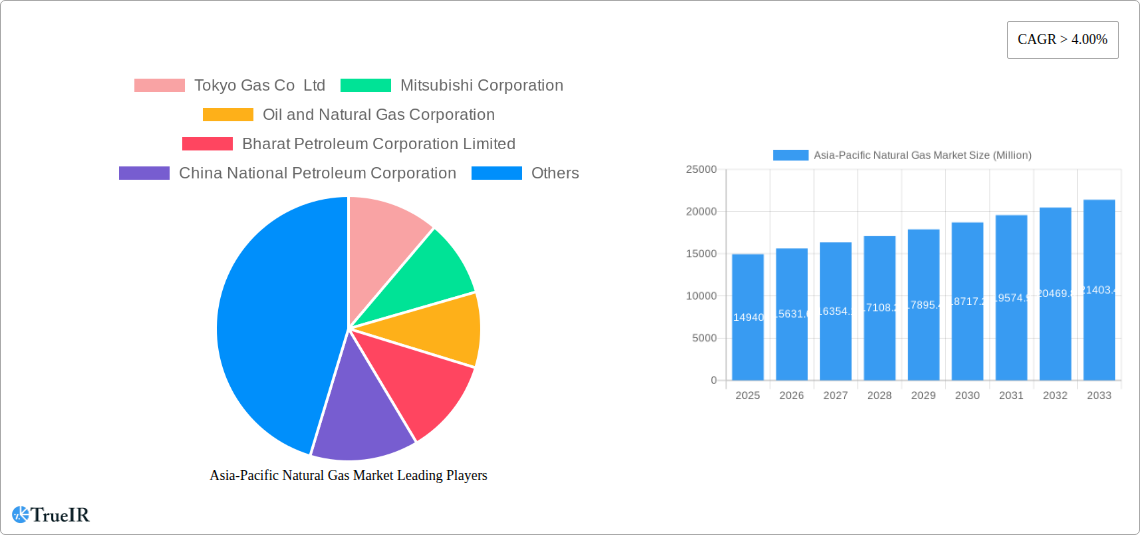
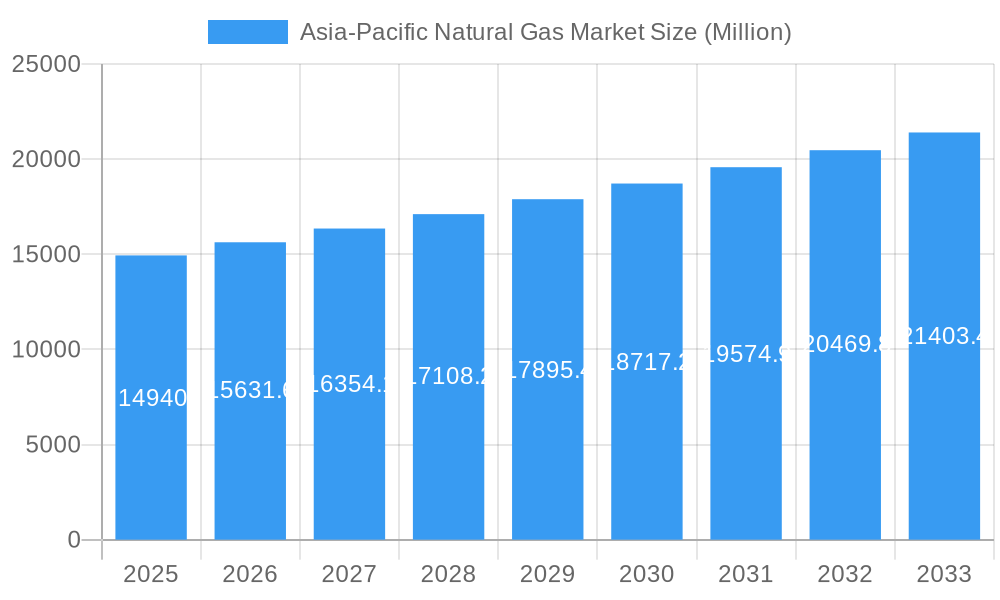
The Asia-Pacific natural gas market, valued at $14,940 million in 2025, is projected to experience robust growth, driven by increasing energy demand across the region, particularly in rapidly developing economies like India and China. This growth is fueled by several factors: the rising adoption of natural gas in power generation, replacing coal-fired plants to meet stricter emission regulations; its increasing utilization in industrial processes, where it offers a cleaner and more efficient energy source; and the expanding residential sector's preference for natural gas for heating and cooking. The shift towards cleaner energy sources, coupled with government initiatives promoting natural gas infrastructure development, further contributes to the market's expansion. While the market faces challenges such as price volatility tied to global energy markets and potential supply chain disruptions, the long-term outlook remains positive due to consistent demand growth and ongoing investments in exploration and production activities. The market is segmented by type (conventional, unconventional, LNG), application (power generation, industrial, residential, transportation), and end-user industry (utilities, industrial, residential, transportation). Key players include Tokyo Gas, Mitsubishi Corporation, Oil and Natural Gas Corporation, and others, competing intensely to capture market share in this dynamic and lucrative sector. The Asia-Pacific region's diverse geographical landscape and varying levels of economic development present unique opportunities and challenges, with countries like China and India expected to be significant contributors to future market growth.
Asia-Pacific Natural Gas Market Market Size (In Billion)
The dominance of LNG imports in certain countries within the Asia-Pacific region underscores the importance of global supply chains. However, increasing focus on domestic production and regional energy cooperation aims to mitigate reliance on imports and ensure energy security. Furthermore, technological advancements in gas exploration and extraction techniques, particularly in unconventional natural gas resources, are likely to improve supply and boost the market. Ongoing investments in pipeline infrastructure and LNG terminals are crucial for facilitating efficient transportation and distribution, enhancing the market’s accessibility. Continuous regulatory support and policy changes aimed at promoting clean energy adoption in the region are expected to further strengthen the Asia-Pacific natural gas market's trajectory in the coming years, leading to a sustained compound annual growth rate (CAGR) exceeding 4% through 2033.
Asia-Pacific Natural Gas Market Company Market Share
This comprehensive report provides an in-depth analysis of the Asia-Pacific natural gas market, covering market size, growth drivers, competitive landscape, and future outlook from 2019 to 2033. With a focus on key segments like LNG, conventional and unconventional natural gas, and applications across power generation, industrial, residential, and transportation sectors, this report is an essential resource for industry professionals, investors, and policymakers. The report leverages extensive data analysis to provide actionable insights and forecasts, empowering informed decision-making in this dynamic market.
Asia-Pacific Natural Gas Market Structure & Competitive Landscape
The Asia-Pacific natural gas market is characterized by a diverse landscape of major players and varying levels of market concentration across different segments and regions. The market is largely consolidated in certain areas, with a few dominant players controlling significant market share, particularly in LNG. However, the presence of numerous smaller players adds to the complexity and dynamism of the market.
Market Concentration: The Herfindahl-Hirschman Index (HHI) for the overall Asia-Pacific natural gas market is estimated at xx, indicating a moderately concentrated market. This varies significantly across segments, with the LNG sector showing a higher degree of concentration than the conventional natural gas segment.
Innovation Drivers: Technological advancements in exploration, extraction, and transportation of natural gas are significant drivers. This includes the development of unconventional gas resources (shale gas, tight gas) and improvements in LNG liquefaction and regasification technologies.
Regulatory Impacts: Government regulations related to environmental protection, energy security, and pricing policies significantly influence market dynamics. These policies range from promoting renewable energy to incentivizing natural gas usage.
Product Substitutes: The natural gas market faces competition from other energy sources such as coal, renewable energy (solar, wind), and nuclear power. The competitiveness of these substitutes varies based on price, availability, and environmental concerns.
End-User Segmentation: The market is segmented by end-user industries including Utilities (xx Million), Industrial (xx Million), Residential (xx Million), and Transportation (xx Million), with significant variations in demand and growth rates across sectors.
M&A Trends: The past five years have witnessed xx billion in M&A activity in the Asia-Pacific natural gas sector. These activities have primarily focused on expanding upstream operations, securing access to resources, and integrating downstream operations.
Asia-Pacific Natural Gas Market Market Trends & Opportunities
The Asia-Pacific natural gas market exhibits robust growth, driven by increasing energy demand, industrialization, and urbanization across the region. The market is expected to witness a Compound Annual Growth Rate (CAGR) of xx% during the forecast period (2025-2033). This growth is underpinned by several key trends and opportunities:
- Rising Energy Demand: The consistently growing populations and economies across the Asia-Pacific region, particularly in developing nations, fuel the increasing demand for energy, driving natural gas consumption.
- Shifting Energy Mix: Governments in many countries are actively promoting natural gas as a transition fuel, recognizing its relatively lower carbon emissions compared to coal. This policy shift is creating favorable conditions for natural gas market expansion.
- Technological Advancements: Continued advancements in exploration and production technologies, particularly for unconventional gas resources, are unlocking new supplies and enhancing efficiency.
- Infrastructure Development: Significant investments in pipeline infrastructure and LNG terminals are expanding access to natural gas in previously underserved areas, thus facilitating market penetration.
- Competitive Dynamics: The interplay of international and domestic players, fluctuating global prices, and government regulations create a dynamic competitive environment influencing market growth trajectories.
- Regional Variations: Growth rates and market dynamics vary significantly across different countries within the Asia-Pacific region due to factors like economic development levels, energy policies, and resource availability.
Dominant Markets & Segments in Asia-Pacific Natural Gas Market
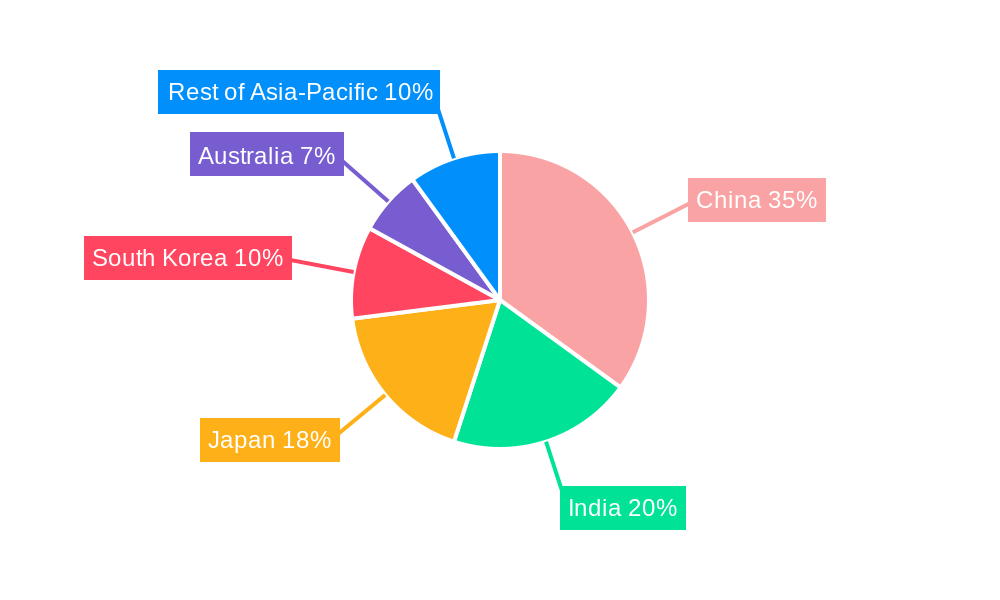
Leading Region/Country: China and India represent the largest markets in the Asia-Pacific natural gas sector, driven by their enormous energy demands, industrial growth, and supportive government policies. Other key markets include Australia, Japan, South Korea, and several Southeast Asian nations.
Dominant Segments:
By Type: Liquefied Natural Gas (LNG) is currently the dominant segment due to its ease of transportation and growing global trade. However, conventional natural gas continues to hold a substantial share, particularly in regions with extensive pipeline infrastructure. Unconventional natural gas is poised for significant growth, driven by technological advancements and resource exploration.
By Application: Power generation is the leading application segment due to the increasing reliance on natural gas for electricity generation. The industrial sector is another large consumer, employing natural gas as a feedstock and fuel source. Residential and transportation sectors, while currently smaller, are also exhibiting growth driven by expanding infrastructure and government incentives.
By End User Industry: Utilities, industrial users, and residential consumers represent the key end-user segments in the natural gas market, with the relative significance of each segment varying by region and country.
Key Growth Drivers (by region/segment):
- China: Government policies supporting natural gas development, rapid industrialization, and investments in infrastructure.
- India: Increasing energy demand, government targets for raising natural gas share in energy mix, and expansion of city gas distribution networks.
- LNG Segment: Growth in global LNG trade, development of new LNG import terminals, and increasing demand from countries lacking domestic supplies.
- Power Generation Segment: Growing electricity demand, increasing use of natural gas for power plants, and government incentives for cleaner energy sources.
Asia-Pacific Natural Gas Market Product Analysis
The Asia-Pacific natural gas market is experiencing significant product evolution, driven by a confluence of technological breakthroughs and an increasing demand for cleaner energy solutions. Innovations in exploration and extraction are unlocking new reserves and enhancing recovery rates, making natural gas more economically viable. Parallel advancements in pipeline infrastructure are expanding reach and improving delivery efficiency, while cutting-edge LNG liquefaction and regasification technologies are facilitating global trade and ensuring greater supply flexibility. The integration of data analytics and artificial intelligence is proving transformative, optimizing operational processes from upstream production to downstream distribution, thereby reducing costs and bolstering market competitiveness. This heightened operational efficiency fuels further product innovation, leading to the development of more sophisticated gas utilization technologies and tailored solutions for diverse industrial and residential needs.
Key Drivers, Barriers & Challenges in Asia-Pacific Natural Gas Market
Key Drivers:
- Robust Energy Demand Growth: Rapid economic expansion and industrialization in emerging Asia-Pacific economies are creating an insatiable appetite for energy, with natural gas increasingly favored as a cleaner alternative to coal and oil.
- Governmental Support and Policy Initiatives: Many governments in the region are actively promoting natural gas as a crucial "transition fuel" to meet climate targets while ensuring energy security, offering incentives for its adoption and infrastructure development.
- Strategic Infrastructure Investments: Significant capital is being channeled into expanding and upgrading gas pipeline networks, LNG terminals, and storage facilities, thereby enhancing accessibility and reliability of supply across diverse geographical areas.
- Technological Advancements in Upstream Operations: Continuous innovation in exploration, drilling, and extraction techniques, including enhanced oil recovery (EOR) methods and the development of unconventional gas reserves, are boosting production and reducing costs.
- Growing Environmental Consciousness: Increasing awareness of climate change and air pollution is driving a shift towards lower-carbon energy sources, positioning natural gas favorably against more polluting fossil fuels.
Barriers:
- Price Volatility and Market Fluctuations: The Asia-Pacific natural gas market is susceptible to significant price swings driven by global supply and demand dynamics, geopolitical events, and the cost of competing fuels. This volatility can range from 15% to 30% year on year, impacting investment decisions and economic predictability.
- Environmental Concerns and Methane Emissions: Despite being cleaner than coal or oil, natural gas still contributes to greenhouse gas emissions, particularly methane, a potent short-term warming agent. Addressing fugitive emissions throughout the value chain is a critical environmental challenge.
- Infrastructure Deficiencies: While investments are ongoing, certain regions within Asia-Pacific still face limitations in their gas pipeline networks and distribution systems, hindering widespread access and market penetration.
- Intensifying Competition from Renewable Energy Sources: The rapidly falling costs and increasing efficiency of renewable energy technologies, such as solar and wind power, present a growing competitive challenge to natural gas, especially in power generation.
- Geopolitical Risks and Supply Chain Disruptions: The reliance on imported LNG makes the region vulnerable to geopolitical tensions, trade disputes, and disruptions in shipping routes, which can impact supply security and price stability.
Growth Drivers in the Asia-Pacific Natural Gas Market Market
The Asia-Pacific natural gas market's growth is propelled by increasing energy demand from rapidly developing economies, government policies promoting gas as a cleaner fuel, and rising investments in infrastructure. Technological innovations like improved extraction techniques and LNG technologies also contribute. Furthermore, regional initiatives to enhance energy security are driving market expansion.
Challenges Impacting Asia-Pacific Natural Gas Market Growth
The Asia-Pacific natural gas market's trajectory is shaped by a complex interplay of factors. Persistent price volatility, exacerbated by global supply chain disruptions and evolving geopolitical landscapes, presents a significant hurdle for long-term planning and investment. Environmental stewardship, particularly concerning methane emissions and the broader greenhouse gas footprint of natural gas, demands continuous technological and operational improvements. Furthermore, infrastructural disparities across the vast and diverse region remain a barrier to widespread and equitable distribution. The dynamic growth of renewable energy sources, coupled with advancements in energy storage, intensifies competition for market share. Effectively navigating these challenges necessitates robust collaborative frameworks involving governments, industry stakeholders, research institutions, and environmental organizations to foster sustainable development and ensure energy security.
Key Players Shaping the Asia-Pacific Natural Gas Market Market
- Tokyo Gas Co Ltd
- Mitsubishi Corporation
- Oil and Natural Gas Corporation (ONGC)
- Bharat Petroleum Corporation Limited (BPCL)
- China National Petroleum Corporation (CNPC)
- Korea Gas Corporation (KOGAS)
- China Petroleum & Chemical Corporation (SINOPEC)
- Chevron Corporation
- GAIL (India) Limited
- ENN Energy Holdings Limited
- Woodside Energy Ltd.
- Santos Ltd.
- PetroChina Company Limited
- PTT Public Company Limited
- Pertamina (Persero)
- *This list is not exhaustive and represents a selection of prominent players contributing to the market's dynamism.
Significant Asia-Pacific Natural Gas Market Industry Milestones
- July 2022: India targets 15% natural gas share in energy mix by 2030, with 95.21 lakh PNG connections and 4531 CNG stations by May 2022. This indicates a significant push for natural gas adoption within the country.
- May 2022: CNOOC awards USD 2.42 billion contract for 12 LNG tankers, signifying expansion in LNG transport capacity and indicating a strong outlook for LNG demand in China.
- January 2022: GAIL commences hydrogen blending in natural gas, showcasing a move towards cleaner energy solutions and diversifying natural gas applications.
Future Outlook for Asia-Pacific Natural Gas Market Market
The Asia-Pacific natural gas market is projected for robust and sustained growth in the coming years, propelled by a multifaceted set of factors. The region's burgeoning economies will continue to drive up energy consumption, with natural gas positioned as a vital component of their diversified energy portfolios. Supportive government policies and an increasing commitment to decarbonization efforts further solidify its role as a transition fuel. Strategic investments in state-of-the-art infrastructure, including expanded LNG import and export terminals and enhanced distribution networks, will be pivotal in meeting this escalating demand and ensuring supply chain resilience. The exploration and development of both conventional and unconventional gas resources, coupled with advancements in gas processing and transportation technologies, will bolster domestic production and enhance market accessibility. As the world increasingly prioritizes cleaner energy solutions, the Asia-Pacific natural gas market presents a landscape ripe with significant opportunities for established energy giants and innovative new entrants alike, particularly in the evolving spheres of LNG trade, distributed gas systems, and the integration of cleaner gas technologies.
Asia-Pacific Natural Gas Market Segmentation
- 1. China
- 2. India
- 3. Japan
- 4. South Korea
- 5. Rest of Asia-Pacific
Asia-Pacific Natural Gas Market Segmentation By Geography
-
1. Asia Pacific
- 1.1. China
- 1.2. Japan
- 1.3. South Korea
- 1.4. India
- 1.5. Australia
- 1.6. New Zealand
- 1.7. Indonesia
- 1.8. Malaysia
- 1.9. Singapore
- 1.10. Thailand
- 1.11. Vietnam
- 1.12. Philippines
Asia-Pacific Natural Gas Market Regional Market Share
Geographic Coverage of Asia-Pacific Natural Gas Market
Asia-Pacific Natural Gas Market REPORT HIGHLIGHTS
| Aspects | Details |
|---|---|
| Study Period | 2020-2034 |
| Base Year | 2025 |
| Estimated Year | 2026 |
| Forecast Period | 2026-2034 |
| Historical Period | 2020-2025 |
| Growth Rate | CAGR of > 4.00% from 2020-2034 |
| Segmentation |
|
Table of Contents
- 1. Introduction
- 1.1. Research Scope
- 1.2. Market Segmentation
- 1.3. Research Objective
- 1.4. Definitions and Assumptions
- 2. Executive Summary
- 2.1. Market Snapshot
- 3. Market Dynamics
- 3.1. Market Drivers
- 3.2. Market Restrains
- 3.3. Market Trends
- 3.4. Market Opportunities
- 4. Market Factor Analysis
- 4.1. Porters Five Forces
- 4.1.1. Bargaining Power of Suppliers
- 4.1.2. Bargaining Power of Buyers
- 4.1.3. Threat of New Entrants
- 4.1.4. Threat of Substitutes
- 4.1.5. Competitive Rivalry
- 4.2. PESTEL analysis
- 4.3. BCG Analysis
- 4.3.1. Stars (High Growth, High Market Share)
- 4.3.2. Cash Cows (Low Growth, High Market Share)
- 4.3.3. Question Mark (High Growth, Low Market Share)
- 4.3.4. Dogs (Low Growth, Low Market Share)
- 4.4. Ansoff Matrix Analysis
- 4.5. Supply Chain Analysis
- 4.6. Regulatory Landscape
- 4.7. Current Market Potential and Opportunity Assessment (TAM–SAM–SOM Framework)
- 4.8. TIR Analyst Note
- 4.1. Porters Five Forces
- 5. Market Analysis, Insights and Forecast 2021-2033
- 5.1. Market Analysis, Insights and Forecast - by China
- 5.2. Market Analysis, Insights and Forecast - by India
- 5.3. Market Analysis, Insights and Forecast - by Japan
- 5.4. Market Analysis, Insights and Forecast - by South Korea
- 5.5. Market Analysis, Insights and Forecast - by Rest of Asia-Pacific
- 5.6. Market Analysis, Insights and Forecast - by Region
- 5.6.1. Asia Pacific
- 6. Asia-Pacific Natural Gas Market Analysis, Insights and Forecast, 2021-2033
- 6.1. Market Analysis, Insights and Forecast - by China
- 6.2. Market Analysis, Insights and Forecast - by India
- 6.3. Market Analysis, Insights and Forecast - by Japan
- 6.4. Market Analysis, Insights and Forecast - by South Korea
- 6.5. Market Analysis, Insights and Forecast - by Rest of Asia-Pacific
- 7. Competitive Analysis
- 7.1. Company Profiles
- 7.1.1 Tokyo Gas Co Ltd
- 7.1.1.1. Company Overview
- 7.1.1.2. Products
- 7.1.1.3. Company Financials
- 7.1.1.4. SWOT Analysis
- 7.1.2 Mitsubishi Corporation
- 7.1.2.1. Company Overview
- 7.1.2.2. Products
- 7.1.2.3. Company Financials
- 7.1.2.4. SWOT Analysis
- 7.1.3 Oil and Natural Gas Corporation
- 7.1.3.1. Company Overview
- 7.1.3.2. Products
- 7.1.3.3. Company Financials
- 7.1.3.4. SWOT Analysis
- 7.1.4 Bharat Petroleum Corporation Limited
- 7.1.4.1. Company Overview
- 7.1.4.2. Products
- 7.1.4.3. Company Financials
- 7.1.4.4. SWOT Analysis
- 7.1.5 China National Petroleum Corporation
- 7.1.5.1. Company Overview
- 7.1.5.2. Products
- 7.1.5.3. Company Financials
- 7.1.5.4. SWOT Analysis
- 7.1.6 Korea Gas Corporation
- 7.1.6.1. Company Overview
- 7.1.6.2. Products
- 7.1.6.3. Company Financials
- 7.1.6.4. SWOT Analysis
- 7.1.7 China Petroleum & Chemical Corporation
- 7.1.7.1. Company Overview
- 7.1.7.2. Products
- 7.1.7.3. Company Financials
- 7.1.7.4. SWOT Analysis
- 7.1.8 Chevron Corporation
- 7.1.8.1. Company Overview
- 7.1.8.2. Products
- 7.1.8.3. Company Financials
- 7.1.8.4. SWOT Analysis
- 7.1.9 GAIL Limited
- 7.1.9.1. Company Overview
- 7.1.9.2. Products
- 7.1.9.3. Company Financials
- 7.1.9.4. SWOT Analysis
- 7.1.10 ENN Energy Holdings Limited*List Not Exhaustive
- 7.1.10.1. Company Overview
- 7.1.10.2. Products
- 7.1.10.3. Company Financials
- 7.1.10.4. SWOT Analysis
- 7.1.1 Tokyo Gas Co Ltd
- 7.2. Market Entropy
- 7.2.1 Company's Key Areas Served
- 7.2.2 Recent Developments
- 7.3. Company Market Share Analysis 2025
- 7.3.1 Top 5 Companies Market Share Analysis
- 7.3.2 Top 3 Companies Market Share Analysis
- 7.4. List of Potential Customers
- 8. Research Methodology
List of Figures
- Figure 1: Asia-Pacific Natural Gas Market Revenue Breakdown (Million, %) by Product 2025 & 2033
- Figure 2: Asia-Pacific Natural Gas Market Share (%) by Company 2025
List of Tables
- Table 1: Asia-Pacific Natural Gas Market Revenue Million Forecast, by China 2020 & 2033
- Table 2: Asia-Pacific Natural Gas Market Volume K Tons Forecast, by China 2020 & 2033
- Table 3: Asia-Pacific Natural Gas Market Revenue Million Forecast, by India 2020 & 2033
- Table 4: Asia-Pacific Natural Gas Market Volume K Tons Forecast, by India 2020 & 2033
- Table 5: Asia-Pacific Natural Gas Market Revenue Million Forecast, by Japan 2020 & 2033
- Table 6: Asia-Pacific Natural Gas Market Volume K Tons Forecast, by Japan 2020 & 2033
- Table 7: Asia-Pacific Natural Gas Market Revenue Million Forecast, by South Korea 2020 & 2033
- Table 8: Asia-Pacific Natural Gas Market Volume K Tons Forecast, by South Korea 2020 & 2033
- Table 9: Asia-Pacific Natural Gas Market Revenue Million Forecast, by Rest of Asia-Pacific 2020 & 2033
- Table 10: Asia-Pacific Natural Gas Market Volume K Tons Forecast, by Rest of Asia-Pacific 2020 & 2033
- Table 11: Asia-Pacific Natural Gas Market Revenue Million Forecast, by Region 2020 & 2033
- Table 12: Asia-Pacific Natural Gas Market Volume K Tons Forecast, by Region 2020 & 2033
- Table 13: Asia-Pacific Natural Gas Market Revenue Million Forecast, by China 2020 & 2033
- Table 14: Asia-Pacific Natural Gas Market Volume K Tons Forecast, by China 2020 & 2033
- Table 15: Asia-Pacific Natural Gas Market Revenue Million Forecast, by India 2020 & 2033
- Table 16: Asia-Pacific Natural Gas Market Volume K Tons Forecast, by India 2020 & 2033
- Table 17: Asia-Pacific Natural Gas Market Revenue Million Forecast, by Japan 2020 & 2033
- Table 18: Asia-Pacific Natural Gas Market Volume K Tons Forecast, by Japan 2020 & 2033
- Table 19: Asia-Pacific Natural Gas Market Revenue Million Forecast, by South Korea 2020 & 2033
- Table 20: Asia-Pacific Natural Gas Market Volume K Tons Forecast, by South Korea 2020 & 2033
- Table 21: Asia-Pacific Natural Gas Market Revenue Million Forecast, by Rest of Asia-Pacific 2020 & 2033
- Table 22: Asia-Pacific Natural Gas Market Volume K Tons Forecast, by Rest of Asia-Pacific 2020 & 2033
- Table 23: Asia-Pacific Natural Gas Market Revenue Million Forecast, by Country 2020 & 2033
- Table 24: Asia-Pacific Natural Gas Market Volume K Tons Forecast, by Country 2020 & 2033
- Table 25: China Asia-Pacific Natural Gas Market Revenue (Million) Forecast, by Application 2020 & 2033
- Table 26: China Asia-Pacific Natural Gas Market Volume (K Tons) Forecast, by Application 2020 & 2033
- Table 27: Japan Asia-Pacific Natural Gas Market Revenue (Million) Forecast, by Application 2020 & 2033
- Table 28: Japan Asia-Pacific Natural Gas Market Volume (K Tons) Forecast, by Application 2020 & 2033
- Table 29: South Korea Asia-Pacific Natural Gas Market Revenue (Million) Forecast, by Application 2020 & 2033
- Table 30: South Korea Asia-Pacific Natural Gas Market Volume (K Tons) Forecast, by Application 2020 & 2033
- Table 31: India Asia-Pacific Natural Gas Market Revenue (Million) Forecast, by Application 2020 & 2033
- Table 32: India Asia-Pacific Natural Gas Market Volume (K Tons) Forecast, by Application 2020 & 2033
- Table 33: Australia Asia-Pacific Natural Gas Market Revenue (Million) Forecast, by Application 2020 & 2033
- Table 34: Australia Asia-Pacific Natural Gas Market Volume (K Tons) Forecast, by Application 2020 & 2033
- Table 35: New Zealand Asia-Pacific Natural Gas Market Revenue (Million) Forecast, by Application 2020 & 2033
- Table 36: New Zealand Asia-Pacific Natural Gas Market Volume (K Tons) Forecast, by Application 2020 & 2033
- Table 37: Indonesia Asia-Pacific Natural Gas Market Revenue (Million) Forecast, by Application 2020 & 2033
- Table 38: Indonesia Asia-Pacific Natural Gas Market Volume (K Tons) Forecast, by Application 2020 & 2033
- Table 39: Malaysia Asia-Pacific Natural Gas Market Revenue (Million) Forecast, by Application 2020 & 2033
- Table 40: Malaysia Asia-Pacific Natural Gas Market Volume (K Tons) Forecast, by Application 2020 & 2033
- Table 41: Singapore Asia-Pacific Natural Gas Market Revenue (Million) Forecast, by Application 2020 & 2033
- Table 42: Singapore Asia-Pacific Natural Gas Market Volume (K Tons) Forecast, by Application 2020 & 2033
- Table 43: Thailand Asia-Pacific Natural Gas Market Revenue (Million) Forecast, by Application 2020 & 2033
- Table 44: Thailand Asia-Pacific Natural Gas Market Volume (K Tons) Forecast, by Application 2020 & 2033
- Table 45: Vietnam Asia-Pacific Natural Gas Market Revenue (Million) Forecast, by Application 2020 & 2033
- Table 46: Vietnam Asia-Pacific Natural Gas Market Volume (K Tons) Forecast, by Application 2020 & 2033
- Table 47: Philippines Asia-Pacific Natural Gas Market Revenue (Million) Forecast, by Application 2020 & 2033
- Table 48: Philippines Asia-Pacific Natural Gas Market Volume (K Tons) Forecast, by Application 2020 & 2033
Frequently Asked Questions
1. What is the projected Compound Annual Growth Rate (CAGR) of the Asia-Pacific Natural Gas Market?
The projected CAGR is approximately > 4.00%.
2. Which companies are prominent players in the Asia-Pacific Natural Gas Market?
Key companies in the market include Tokyo Gas Co Ltd, Mitsubishi Corporation, Oil and Natural Gas Corporation, Bharat Petroleum Corporation Limited, China National Petroleum Corporation, Korea Gas Corporation, China Petroleum & Chemical Corporation, Chevron Corporation, GAIL Limited, ENN Energy Holdings Limited*List Not Exhaustive.
3. What are the main segments of the Asia-Pacific Natural Gas Market?
The market segments include China, India, Japan, South Korea, Rest of Asia-Pacific.
4. Can you provide details about the market size?
The market size is estimated to be USD 14940 Million as of 2022.
5. What are some drivers contributing to market growth?
4.; Increasing Electricity Demand4.; Rsing Investments in the Coal Industry.
6. What are the notable trends driving market growth?
Increasing Investments in Natural Gas Production to Drive the Market.
7. Are there any restraints impacting market growth?
4.; Increasing Installation of Renewable Energy Sources.
8. Can you provide examples of recent developments in the market?
July 2022: The Indian government announced that it had set a target to raise the share of natural gas in the energy mix to 15% by 2030 from the current 6.3%. According to the data demonstrated by the Ministry of Petroleum & Natural Gas, 95.21 lakh PNG (Domestic) connections have been provided, and the authorized entities have established 4531 CNG (Transport) stations as of 31 May 2022.
9. What pricing options are available for accessing the report?
Pricing options include single-user, multi-user, and enterprise licenses priced at USD 4750, USD 5250, and USD 8750 respectively.
10. Is the market size provided in terms of value or volume?
The market size is provided in terms of value, measured in Million and volume, measured in K Tons.
11. Are there any specific market keywords associated with the report?
Yes, the market keyword associated with the report is "Asia-Pacific Natural Gas Market," which aids in identifying and referencing the specific market segment covered.
12. How do I determine which pricing option suits my needs best?
The pricing options vary based on user requirements and access needs. Individual users may opt for single-user licenses, while businesses requiring broader access may choose multi-user or enterprise licenses for cost-effective access to the report.
13. Are there any additional resources or data provided in the Asia-Pacific Natural Gas Market report?
While the report offers comprehensive insights, it's advisable to review the specific contents or supplementary materials provided to ascertain if additional resources or data are available.
14. How can I stay updated on further developments or reports in the Asia-Pacific Natural Gas Market?
To stay informed about further developments, trends, and reports in the Asia-Pacific Natural Gas Market, consider subscribing to industry newsletters, following relevant companies and organizations, or regularly checking reputable industry news sources and publications.
Methodology
Step 1 - Identification of Relevant Samples Size from Population Database


Step 2 - Approaches for Defining Global Market Size (Value, Volume* & Price*)

Note*: In applicable scenarios
Step 3 - Data Sources
Primary Research
- Web Analytics
- Survey Reports
- Research Institute
- Latest Research Reports
- Opinion Leaders
Secondary Research
- Annual Reports
- White Paper
- Latest Press Release
- Industry Association
- Paid Database
- Investor Presentations

Step 4 - Data Triangulation
Involves using different sources of information in order to increase the validity of a study
These sources are likely to be stakeholders in a program - participants, other researchers, program staff, other community members, and so on.
Then we put all data in single framework & apply various statistical tools to find out the dynamic on the market.
During the analysis stage, feedback from the stakeholder groups would be compared to determine areas of agreement as well as areas of divergence