

Key Insights
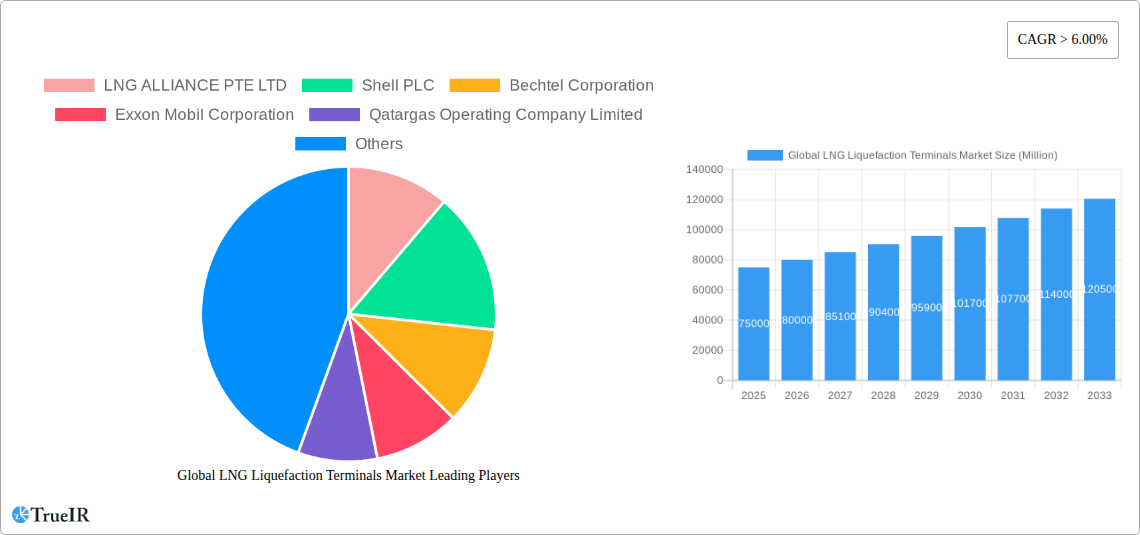
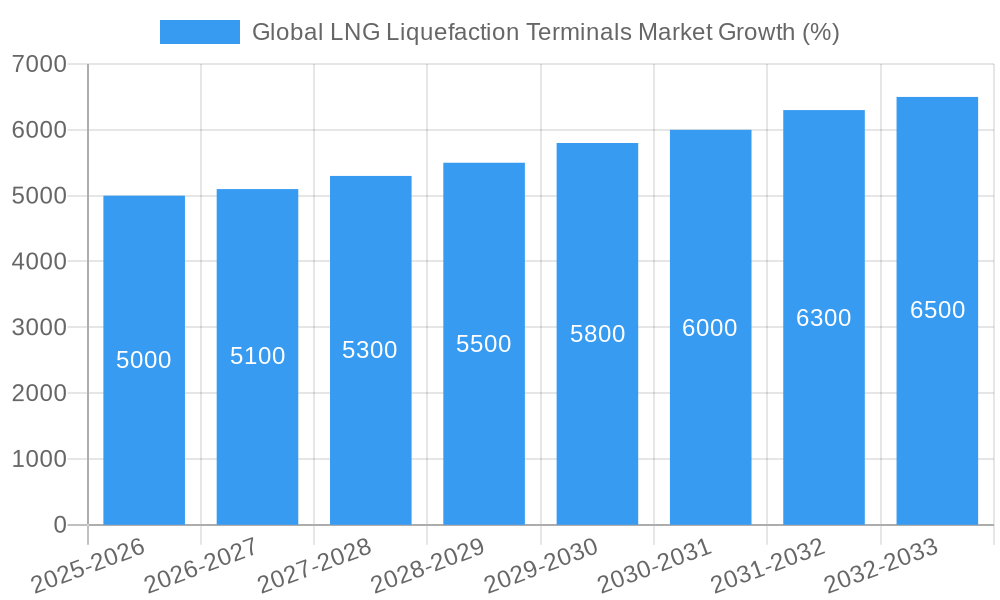
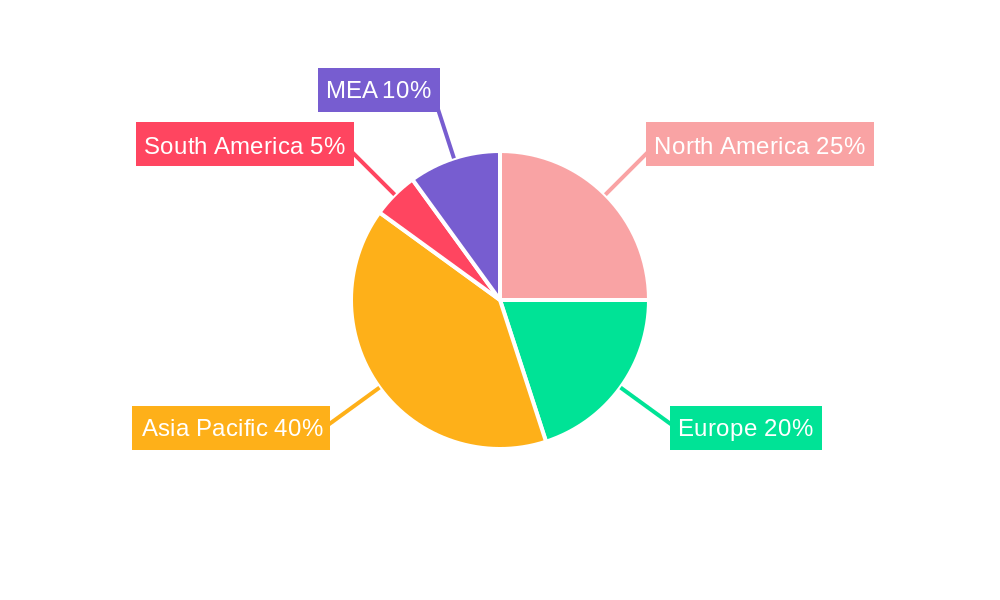
The global LNG liquefaction terminals market is experiencing robust growth, driven by the increasing demand for natural gas as a cleaner-burning fuel source compared to coal and oil, particularly in power generation and industrial sectors. A CAGR exceeding 6% indicates a significant expansion projected through 2033. This growth is fueled by several key factors: the ongoing transition towards cleaner energy sources, rising energy consumption in developing economies like those in Asia-Pacific, and the increasing adoption of LNG as a marine fuel. The market is segmented by terminal type (onshore and floating), capacity (small, medium, and large), and end-use (power generation, industrial, and transportation). Onshore terminals currently dominate, but floating LNG (FLNG) facilities are gaining traction due to their flexibility and lower upfront investment costs, especially in geographically challenging locations. While the market faces constraints such as fluctuating natural gas prices and potential regulatory hurdles related to environmental impact, the long-term outlook remains positive, supported by sustained investment in infrastructure and ongoing government support for LNG development globally. Major players like Shell, ExxonMobil, and Qatargas are driving innovation and expansion within this dynamic market, consolidating their positions and further shaping market trends. Geographic distribution showcases significant demand from Asia-Pacific regions, followed by North America and Europe, reflecting the growth and energy needs of these areas.
The diverse range of end-use sectors, coupled with continuous technological advancements in liquefaction and terminal design, will contribute to market expansion. Growth in small and medium-sized LNG terminals is particularly notable, catering to smaller-scale energy needs and regional markets. The market's competitive landscape features both established multinational corporations and emerging regional players. Strategic partnerships, mergers, and acquisitions are anticipated to further intensify competition and drive innovation in technology and operational efficiency. Further analysis of regional growth trajectories will reveal specific opportunities within countries exhibiting higher-than-average energy demand and conducive regulatory frameworks. This growth trajectory is expected to continue into the forecast period, driven by a combination of supportive government policies, growing energy needs, and the inherent advantages of LNG as a versatile and cleaner fuel source.
Global LNG Liquefaction Terminals Market Report: 2019-2033
This comprehensive report provides a detailed analysis of the global LNG liquefaction terminals market, offering invaluable insights for investors, industry professionals, and strategic decision-makers. The study period covers 2019-2033, with a base year of 2025 and a forecast period spanning 2025-2033. The report leverages extensive research and data analysis to provide a clear understanding of market trends, competitive dynamics, and future growth prospects. Key segments analyzed include onshore and floating LNG liquefaction terminals, categorized by capacity (small, medium, large) and end-use (power generation, industrial, transportation).
Global LNG Liquefaction Terminals Market Structure & Competitive Landscape
The global LNG liquefaction terminal market exhibits a moderately concentrated structure, with a few major players holding significant market share. The Herfindahl-Hirschman Index (HHI) is estimated to be around xx, indicating a consolidated but not monopolistic market. Innovation is a key driver, with companies constantly seeking to improve efficiency, reduce costs, and enhance the environmental performance of their liquefaction terminals. Stringent environmental regulations, particularly regarding emissions, are shaping market dynamics and influencing investment decisions. Product substitution is limited, as LNG remains the dominant method for long-distance natural gas transport. Mergers and acquisitions (M&A) activity has been moderate in recent years, with a total transaction volume of approximately xx Million USD over the past five years. The end-user segment is diversified, with power generation currently being the largest consumer, followed by industrial and transportation sectors.
- Market Concentration: Moderately concentrated (HHI: xx)
- Innovation Drivers: Efficiency improvements, cost reduction, environmental compliance.
- Regulatory Impacts: Stringent environmental regulations drive technological advancements.
- Product Substitutes: Limited, with LNG maintaining dominance in long-distance gas transport.
- End-User Segmentation: Power generation, Industrial, Transportation
- M&A Trends: Moderate activity, xx Million USD in the last 5 years.
Global LNG Liquefaction Terminals Market Market Trends & Opportunities
The global LNG liquefaction terminals market is experiencing robust growth, with a projected Compound Annual Growth Rate (CAGR) of xx% during the forecast period (2025-2033). This growth is fueled by increasing global demand for natural gas, particularly in Asia and Europe, coupled with ongoing investments in new liquefaction facilities. Technological advancements, such as the development of floating LNG (FLNG) terminals and improved liquefaction technologies, are contributing to increased efficiency and reduced costs. Consumer preferences are shifting towards cleaner energy sources, making LNG an attractive transitional fuel. However, the market also faces challenges, including fluctuating natural gas prices and geopolitical uncertainties. Market penetration rates for LNG in various end-use sectors are expected to increase steadily, reaching xx% by 2033 in power generation and xx% in the industrial sector.
Dominant Markets & Segments in Global LNG Liquefaction Terminals Market
The Asia-Pacific region currently dominates the global LNG liquefaction terminals market, driven by strong demand from rapidly developing economies. Specifically, countries like China, Japan, and South Korea are major consumers and investors in LNG infrastructure. Within the capacity segments, Large LNG Liquefaction Terminals hold the largest market share, reflecting the growing scale of LNG projects. Onshore LNG Liquefaction Terminals represent a significant portion of the market. The Power Generation end-use segment remains the dominant application, primarily due to its role in electricity production.
Key Growth Drivers:
- Strong demand from Asia-Pacific region
- Increasing global natural gas demand
- Development of FLNG technology
- Investments in new liquefaction facilities
Dominant Segments:
- Region: Asia-Pacific
- Capacity: Large LNG Liquefaction Terminals
- Type: Onshore LNG Liquefaction Terminals
- End-Use: Power Generation
Global LNG Liquefaction Terminals Market Product Analysis
The LNG liquefaction terminal market is characterized by continuous product innovations focusing on enhanced efficiency, reduced emissions, and improved scalability. Advancements in cryogenic technologies, alongside the development of modular and standardized designs, are improving the cost-effectiveness and speed of project deployment. Floating LNG (FLNG) terminals represent a key innovation, offering flexibility and reduced infrastructure costs compared to traditional onshore facilities. The market fit for these innovations is largely determined by factors such as geographic location, regulatory environment, and project scale.
Key Drivers, Barriers & Challenges in Global LNG Liquefaction Terminals Market
Key Drivers: The rising global demand for natural gas, driven by industrialization and power generation needs in developing economies, is a primary driver. Technological advancements, including the development of FLNG and modular designs, are improving efficiency and reducing costs. Favorable government policies and incentives in many regions are also stimulating market growth.
Key Challenges: Fluctuations in natural gas prices represent a major challenge, affecting project economics and investment decisions. Stricter environmental regulations increase project costs and complexities. Geopolitical instability and potential supply chain disruptions can significantly impact project timelines and feasibility. Competition among LNG producers and terminal operators also exerts pressure on margins.
Growth Drivers in the Global LNG Liquefaction Terminals Market Market
The market’s growth is primarily driven by escalating global energy demand, particularly in the developing economies of Asia. Technological progress, leading to the creation of more efficient and cost-effective liquefaction technologies, further boosts the market. Governmental support and favorable policies aimed at diversifying energy sources and promoting cleaner fuels are also significant growth drivers.
Challenges Impacting Global LNG Liquefaction Terminals Market Growth
Significant hurdles include the volatility of natural gas prices, making investment projections uncertain. The stringent environmental regulations necessitate substantial investment in emission reduction technologies, increasing project costs. Geopolitical risks and the potential for supply chain disruptions also pose significant threats to the market's growth trajectory.
Key Players Shaping the Global LNG Liquefaction Terminals Market Market
- LNG ALLIANCE PTE LTD
- Shell PLC
- Bechtel Corporation
- Exxon Mobil Corporation
- Qatargas Operating Company Limited
- Chevron Corporation
- Petronet LNG Ltd
- TotalEnergies SE
- China National Offshore Oil Corporation
- McDermott International Ltd
Significant Global LNG Liquefaction Terminals Market Industry Milestones
- May 2022: New Fortress Energy announces plans to expand its Fast LNG liquefaction terminal portfolio in the US Gulf of Mexico.
- March 2022: The United States increases its LNG liquefaction terminal capacity by 6 Million metric tons, reaching a total export capacity of 82 Million metric tons per year.
Future Outlook for Global LNG Liquefaction Terminals Market Market
The global LNG liquefaction terminals market is poised for continued growth, driven by increasing energy demand and the transition towards cleaner energy sources. Strategic partnerships, technological advancements, and expansion into new markets represent key opportunities for growth. The market’s future potential is significant, particularly in regions with expanding natural gas consumption and supportive regulatory frameworks. However, sustained growth will depend on addressing challenges related to price volatility, environmental regulations, and geopolitical factors.
Global LNG Liquefaction Terminals Market Segmentation
- 1. Production Analysis
- 2. Consumption Analysis
- 3. Import Market Analysis (Value & Volume)
- 4. Export Market Analysis (Value & Volume)
- 5. Price Trend Analysis
Global LNG Liquefaction Terminals Market Segmentation By Geography
- 1. North America
- 2. Europe
- 3. Asia Pacific
- 4. South America
- 5. Middel Eanst and Africa
Global LNG Liquefaction Terminals Market REPORT HIGHLIGHTS
| Aspects | Details |
|---|---|
| Study Period | 2019-2033 |
| Base Year | 2024 |
| Estimated Year | 2025 |
| Forecast Period | 2025-2033 |
| Historical Period | 2019-2024 |
| Growth Rate | CAGR of > 6.00% from 2019-2033 |
| Segmentation |
|
Table of Contents
- 1. Introduction
- 1.1. Research Scope
- 1.2. Market Segmentation
- 1.3. Research Methodology
- 1.4. Definitions and Assumptions
- 2. Executive Summary
- 2.1. Introduction
- 3. Market Dynamics
- 3.1. Introduction
- 3.2. Market Drivers
- 3.2.1. 4.; Upcoming New Renewable Projects in the Country4.; Expansions of Transmission and Distribution Network
- 3.3. Market Restrains
- 3.3.1. 4.; Lack of Private Participation in the Country's Power Sector
- 3.4. Market Trends
- 3.4.1 Rising the Demand for LNG in Bunkering
- 3.4.2 Road Transportation
- 3.4.3 and Off-grid Power.
- 4. Market Factor Analysis
- 4.1. Porters Five Forces
- 4.2. Supply/Value Chain
- 4.3. PESTEL analysis
- 4.4. Market Entropy
- 4.5. Patent/Trademark Analysis
- 5. Global LNG Liquefaction Terminals Market Analysis, Insights and Forecast, 2019-2031
- 5.1. Market Analysis, Insights and Forecast - by Production Analysis
- 5.2. Market Analysis, Insights and Forecast - by Consumption Analysis
- 5.3. Market Analysis, Insights and Forecast - by Import Market Analysis (Value & Volume)
- 5.4. Market Analysis, Insights and Forecast - by Export Market Analysis (Value & Volume)
- 5.5. Market Analysis, Insights and Forecast - by Price Trend Analysis
- 5.6. Market Analysis, Insights and Forecast - by Region
- 5.6.1. North America
- 5.6.2. Europe
- 5.6.3. Asia Pacific
- 5.6.4. South America
- 5.6.5. Middel Eanst and Africa
- 5.1. Market Analysis, Insights and Forecast - by Production Analysis
- 6. North America Global LNG Liquefaction Terminals Market Analysis, Insights and Forecast, 2019-2031
- 6.1. Market Analysis, Insights and Forecast - by Production Analysis
- 6.2. Market Analysis, Insights and Forecast - by Consumption Analysis
- 6.3. Market Analysis, Insights and Forecast - by Import Market Analysis (Value & Volume)
- 6.4. Market Analysis, Insights and Forecast - by Export Market Analysis (Value & Volume)
- 6.5. Market Analysis, Insights and Forecast - by Price Trend Analysis
- 6.1. Market Analysis, Insights and Forecast - by Production Analysis
- 7. Europe Global LNG Liquefaction Terminals Market Analysis, Insights and Forecast, 2019-2031
- 7.1. Market Analysis, Insights and Forecast - by Production Analysis
- 7.2. Market Analysis, Insights and Forecast - by Consumption Analysis
- 7.3. Market Analysis, Insights and Forecast - by Import Market Analysis (Value & Volume)
- 7.4. Market Analysis, Insights and Forecast - by Export Market Analysis (Value & Volume)
- 7.5. Market Analysis, Insights and Forecast - by Price Trend Analysis
- 7.1. Market Analysis, Insights and Forecast - by Production Analysis
- 8. Asia Pacific Global LNG Liquefaction Terminals Market Analysis, Insights and Forecast, 2019-2031
- 8.1. Market Analysis, Insights and Forecast - by Production Analysis
- 8.2. Market Analysis, Insights and Forecast - by Consumption Analysis
- 8.3. Market Analysis, Insights and Forecast - by Import Market Analysis (Value & Volume)
- 8.4. Market Analysis, Insights and Forecast - by Export Market Analysis (Value & Volume)
- 8.5. Market Analysis, Insights and Forecast - by Price Trend Analysis
- 8.1. Market Analysis, Insights and Forecast - by Production Analysis
- 9. South America Global LNG Liquefaction Terminals Market Analysis, Insights and Forecast, 2019-2031
- 9.1. Market Analysis, Insights and Forecast - by Production Analysis
- 9.2. Market Analysis, Insights and Forecast - by Consumption Analysis
- 9.3. Market Analysis, Insights and Forecast - by Import Market Analysis (Value & Volume)
- 9.4. Market Analysis, Insights and Forecast - by Export Market Analysis (Value & Volume)
- 9.5. Market Analysis, Insights and Forecast - by Price Trend Analysis
- 9.1. Market Analysis, Insights and Forecast - by Production Analysis
- 10. Middel Eanst and Africa Global LNG Liquefaction Terminals Market Analysis, Insights and Forecast, 2019-2031
- 10.1. Market Analysis, Insights and Forecast - by Production Analysis
- 10.2. Market Analysis, Insights and Forecast - by Consumption Analysis
- 10.3. Market Analysis, Insights and Forecast - by Import Market Analysis (Value & Volume)
- 10.4. Market Analysis, Insights and Forecast - by Export Market Analysis (Value & Volume)
- 10.5. Market Analysis, Insights and Forecast - by Price Trend Analysis
- 10.1. Market Analysis, Insights and Forecast - by Production Analysis
- 11. North America Global LNG Liquefaction Terminals Market Analysis, Insights and Forecast, 2019-2031
- 11.1. Market Analysis, Insights and Forecast - By Country/Sub-region
- 11.1.1 United States
- 11.1.2 Canada
- 11.1.3 Mexico
- 12. Europe Global LNG Liquefaction Terminals Market Analysis, Insights and Forecast, 2019-2031
- 12.1. Market Analysis, Insights and Forecast - By Country/Sub-region
- 12.1.1 Germany
- 12.1.2 United Kingdom
- 12.1.3 France
- 12.1.4 Spain
- 12.1.5 Italy
- 12.1.6 Spain
- 12.1.7 Belgium
- 12.1.8 Netherland
- 12.1.9 Nordics
- 12.1.10 Rest of Europe
- 13. Asia Pacific Global LNG Liquefaction Terminals Market Analysis, Insights and Forecast, 2019-2031
- 13.1. Market Analysis, Insights and Forecast - By Country/Sub-region
- 13.1.1 China
- 13.1.2 Japan
- 13.1.3 India
- 13.1.4 South Korea
- 13.1.5 Southeast Asia
- 13.1.6 Australia
- 13.1.7 Indonesia
- 13.1.8 Phillipes
- 13.1.9 Singapore
- 13.1.10 Thailandc
- 13.1.11 Rest of Asia Pacific
- 14. South America Global LNG Liquefaction Terminals Market Analysis, Insights and Forecast, 2019-2031
- 14.1. Market Analysis, Insights and Forecast - By Country/Sub-region
- 14.1.1 Brazil
- 14.1.2 Argentina
- 14.1.3 Peru
- 14.1.4 Chile
- 14.1.5 Colombia
- 14.1.6 Ecuador
- 14.1.7 Venezuela
- 14.1.8 Rest of South America
- 15. MEA Global LNG Liquefaction Terminals Market Analysis, Insights and Forecast, 2019-2031
- 15.1. Market Analysis, Insights and Forecast - By Country/Sub-region
- 15.1.1 United Arab Emirates
- 15.1.2 Saudi Arabia
- 15.1.3 South Africa
- 15.1.4 Rest of Middle East and Africa
- 16. Competitive Analysis
- 16.1. Market Share Analysis 2024
- 16.2. Company Profiles
- 16.2.1 LNG ALLIANCE PTE LTD
- 16.2.1.1. Overview
- 16.2.1.2. Products
- 16.2.1.3. SWOT Analysis
- 16.2.1.4. Recent Developments
- 16.2.1.5. Financials (Based on Availability)
- 16.2.2 Shell PLC
- 16.2.2.1. Overview
- 16.2.2.2. Products
- 16.2.2.3. SWOT Analysis
- 16.2.2.4. Recent Developments
- 16.2.2.5. Financials (Based on Availability)
- 16.2.3 Bechtel Corporation
- 16.2.3.1. Overview
- 16.2.3.2. Products
- 16.2.3.3. SWOT Analysis
- 16.2.3.4. Recent Developments
- 16.2.3.5. Financials (Based on Availability)
- 16.2.4 Exxon Mobil Corporation
- 16.2.4.1. Overview
- 16.2.4.2. Products
- 16.2.4.3. SWOT Analysis
- 16.2.4.4. Recent Developments
- 16.2.4.5. Financials (Based on Availability)
- 16.2.5 Qatargas Operating Company Limited
- 16.2.5.1. Overview
- 16.2.5.2. Products
- 16.2.5.3. SWOT Analysis
- 16.2.5.4. Recent Developments
- 16.2.5.5. Financials (Based on Availability)
- 16.2.6 Chevron Corporation
- 16.2.6.1. Overview
- 16.2.6.2. Products
- 16.2.6.3. SWOT Analysis
- 16.2.6.4. Recent Developments
- 16.2.6.5. Financials (Based on Availability)
- 16.2.7 Petronet LNG Ltd
- 16.2.7.1. Overview
- 16.2.7.2. Products
- 16.2.7.3. SWOT Analysis
- 16.2.7.4. Recent Developments
- 16.2.7.5. Financials (Based on Availability)
- 16.2.8 TotalEnergies SE
- 16.2.8.1. Overview
- 16.2.8.2. Products
- 16.2.8.3. SWOT Analysis
- 16.2.8.4. Recent Developments
- 16.2.8.5. Financials (Based on Availability)
- 16.2.9 China National Offshore Oil Corporation
- 16.2.9.1. Overview
- 16.2.9.2. Products
- 16.2.9.3. SWOT Analysis
- 16.2.9.4. Recent Developments
- 16.2.9.5. Financials (Based on Availability)
- 16.2.10 McDermott International Ltd
- 16.2.10.1. Overview
- 16.2.10.2. Products
- 16.2.10.3. SWOT Analysis
- 16.2.10.4. Recent Developments
- 16.2.10.5. Financials (Based on Availability)
- 16.2.1 LNG ALLIANCE PTE LTD
List of Figures
- Figure 1: Global Global LNG Liquefaction Terminals Market Revenue Breakdown (Million, %) by Region 2024 & 2032
- Figure 2: North America Global LNG Liquefaction Terminals Market Revenue (Million), by Country 2024 & 2032
- Figure 3: North America Global LNG Liquefaction Terminals Market Revenue Share (%), by Country 2024 & 2032
- Figure 4: Europe Global LNG Liquefaction Terminals Market Revenue (Million), by Country 2024 & 2032
- Figure 5: Europe Global LNG Liquefaction Terminals Market Revenue Share (%), by Country 2024 & 2032
- Figure 6: Asia Pacific Global LNG Liquefaction Terminals Market Revenue (Million), by Country 2024 & 2032
- Figure 7: Asia Pacific Global LNG Liquefaction Terminals Market Revenue Share (%), by Country 2024 & 2032
- Figure 8: South America Global LNG Liquefaction Terminals Market Revenue (Million), by Country 2024 & 2032
- Figure 9: South America Global LNG Liquefaction Terminals Market Revenue Share (%), by Country 2024 & 2032
- Figure 10: MEA Global LNG Liquefaction Terminals Market Revenue (Million), by Country 2024 & 2032
- Figure 11: MEA Global LNG Liquefaction Terminals Market Revenue Share (%), by Country 2024 & 2032
- Figure 12: North America Global LNG Liquefaction Terminals Market Revenue (Million), by Production Analysis 2024 & 2032
- Figure 13: North America Global LNG Liquefaction Terminals Market Revenue Share (%), by Production Analysis 2024 & 2032
- Figure 14: North America Global LNG Liquefaction Terminals Market Revenue (Million), by Consumption Analysis 2024 & 2032
- Figure 15: North America Global LNG Liquefaction Terminals Market Revenue Share (%), by Consumption Analysis 2024 & 2032
- Figure 16: North America Global LNG Liquefaction Terminals Market Revenue (Million), by Import Market Analysis (Value & Volume) 2024 & 2032
- Figure 17: North America Global LNG Liquefaction Terminals Market Revenue Share (%), by Import Market Analysis (Value & Volume) 2024 & 2032
- Figure 18: North America Global LNG Liquefaction Terminals Market Revenue (Million), by Export Market Analysis (Value & Volume) 2024 & 2032
- Figure 19: North America Global LNG Liquefaction Terminals Market Revenue Share (%), by Export Market Analysis (Value & Volume) 2024 & 2032
- Figure 20: North America Global LNG Liquefaction Terminals Market Revenue (Million), by Price Trend Analysis 2024 & 2032
- Figure 21: North America Global LNG Liquefaction Terminals Market Revenue Share (%), by Price Trend Analysis 2024 & 2032
- Figure 22: North America Global LNG Liquefaction Terminals Market Revenue (Million), by Country 2024 & 2032
- Figure 23: North America Global LNG Liquefaction Terminals Market Revenue Share (%), by Country 2024 & 2032
- Figure 24: Europe Global LNG Liquefaction Terminals Market Revenue (Million), by Production Analysis 2024 & 2032
- Figure 25: Europe Global LNG Liquefaction Terminals Market Revenue Share (%), by Production Analysis 2024 & 2032
- Figure 26: Europe Global LNG Liquefaction Terminals Market Revenue (Million), by Consumption Analysis 2024 & 2032
- Figure 27: Europe Global LNG Liquefaction Terminals Market Revenue Share (%), by Consumption Analysis 2024 & 2032
- Figure 28: Europe Global LNG Liquefaction Terminals Market Revenue (Million), by Import Market Analysis (Value & Volume) 2024 & 2032
- Figure 29: Europe Global LNG Liquefaction Terminals Market Revenue Share (%), by Import Market Analysis (Value & Volume) 2024 & 2032
- Figure 30: Europe Global LNG Liquefaction Terminals Market Revenue (Million), by Export Market Analysis (Value & Volume) 2024 & 2032
- Figure 31: Europe Global LNG Liquefaction Terminals Market Revenue Share (%), by Export Market Analysis (Value & Volume) 2024 & 2032
- Figure 32: Europe Global LNG Liquefaction Terminals Market Revenue (Million), by Price Trend Analysis 2024 & 2032
- Figure 33: Europe Global LNG Liquefaction Terminals Market Revenue Share (%), by Price Trend Analysis 2024 & 2032
- Figure 34: Europe Global LNG Liquefaction Terminals Market Revenue (Million), by Country 2024 & 2032
- Figure 35: Europe Global LNG Liquefaction Terminals Market Revenue Share (%), by Country 2024 & 2032
- Figure 36: Asia Pacific Global LNG Liquefaction Terminals Market Revenue (Million), by Production Analysis 2024 & 2032
- Figure 37: Asia Pacific Global LNG Liquefaction Terminals Market Revenue Share (%), by Production Analysis 2024 & 2032
- Figure 38: Asia Pacific Global LNG Liquefaction Terminals Market Revenue (Million), by Consumption Analysis 2024 & 2032
- Figure 39: Asia Pacific Global LNG Liquefaction Terminals Market Revenue Share (%), by Consumption Analysis 2024 & 2032
- Figure 40: Asia Pacific Global LNG Liquefaction Terminals Market Revenue (Million), by Import Market Analysis (Value & Volume) 2024 & 2032
- Figure 41: Asia Pacific Global LNG Liquefaction Terminals Market Revenue Share (%), by Import Market Analysis (Value & Volume) 2024 & 2032
- Figure 42: Asia Pacific Global LNG Liquefaction Terminals Market Revenue (Million), by Export Market Analysis (Value & Volume) 2024 & 2032
- Figure 43: Asia Pacific Global LNG Liquefaction Terminals Market Revenue Share (%), by Export Market Analysis (Value & Volume) 2024 & 2032
- Figure 44: Asia Pacific Global LNG Liquefaction Terminals Market Revenue (Million), by Price Trend Analysis 2024 & 2032
- Figure 45: Asia Pacific Global LNG Liquefaction Terminals Market Revenue Share (%), by Price Trend Analysis 2024 & 2032
- Figure 46: Asia Pacific Global LNG Liquefaction Terminals Market Revenue (Million), by Country 2024 & 2032
- Figure 47: Asia Pacific Global LNG Liquefaction Terminals Market Revenue Share (%), by Country 2024 & 2032
- Figure 48: South America Global LNG Liquefaction Terminals Market Revenue (Million), by Production Analysis 2024 & 2032
- Figure 49: South America Global LNG Liquefaction Terminals Market Revenue Share (%), by Production Analysis 2024 & 2032
- Figure 50: South America Global LNG Liquefaction Terminals Market Revenue (Million), by Consumption Analysis 2024 & 2032
- Figure 51: South America Global LNG Liquefaction Terminals Market Revenue Share (%), by Consumption Analysis 2024 & 2032
- Figure 52: South America Global LNG Liquefaction Terminals Market Revenue (Million), by Import Market Analysis (Value & Volume) 2024 & 2032
- Figure 53: South America Global LNG Liquefaction Terminals Market Revenue Share (%), by Import Market Analysis (Value & Volume) 2024 & 2032
- Figure 54: South America Global LNG Liquefaction Terminals Market Revenue (Million), by Export Market Analysis (Value & Volume) 2024 & 2032
- Figure 55: South America Global LNG Liquefaction Terminals Market Revenue Share (%), by Export Market Analysis (Value & Volume) 2024 & 2032
- Figure 56: South America Global LNG Liquefaction Terminals Market Revenue (Million), by Price Trend Analysis 2024 & 2032
- Figure 57: South America Global LNG Liquefaction Terminals Market Revenue Share (%), by Price Trend Analysis 2024 & 2032
- Figure 58: South America Global LNG Liquefaction Terminals Market Revenue (Million), by Country 2024 & 2032
- Figure 59: South America Global LNG Liquefaction Terminals Market Revenue Share (%), by Country 2024 & 2032
- Figure 60: Middel Eanst and Africa Global LNG Liquefaction Terminals Market Revenue (Million), by Production Analysis 2024 & 2032
- Figure 61: Middel Eanst and Africa Global LNG Liquefaction Terminals Market Revenue Share (%), by Production Analysis 2024 & 2032
- Figure 62: Middel Eanst and Africa Global LNG Liquefaction Terminals Market Revenue (Million), by Consumption Analysis 2024 & 2032
- Figure 63: Middel Eanst and Africa Global LNG Liquefaction Terminals Market Revenue Share (%), by Consumption Analysis 2024 & 2032
- Figure 64: Middel Eanst and Africa Global LNG Liquefaction Terminals Market Revenue (Million), by Import Market Analysis (Value & Volume) 2024 & 2032
- Figure 65: Middel Eanst and Africa Global LNG Liquefaction Terminals Market Revenue Share (%), by Import Market Analysis (Value & Volume) 2024 & 2032
- Figure 66: Middel Eanst and Africa Global LNG Liquefaction Terminals Market Revenue (Million), by Export Market Analysis (Value & Volume) 2024 & 2032
- Figure 67: Middel Eanst and Africa Global LNG Liquefaction Terminals Market Revenue Share (%), by Export Market Analysis (Value & Volume) 2024 & 2032
- Figure 68: Middel Eanst and Africa Global LNG Liquefaction Terminals Market Revenue (Million), by Price Trend Analysis 2024 & 2032
- Figure 69: Middel Eanst and Africa Global LNG Liquefaction Terminals Market Revenue Share (%), by Price Trend Analysis 2024 & 2032
- Figure 70: Middel Eanst and Africa Global LNG Liquefaction Terminals Market Revenue (Million), by Country 2024 & 2032
- Figure 71: Middel Eanst and Africa Global LNG Liquefaction Terminals Market Revenue Share (%), by Country 2024 & 2032
List of Tables
- Table 1: Global LNG Liquefaction Terminals Market Revenue Million Forecast, by Region 2019 & 2032
- Table 2: Global LNG Liquefaction Terminals Market Revenue Million Forecast, by Production Analysis 2019 & 2032
- Table 3: Global LNG Liquefaction Terminals Market Revenue Million Forecast, by Consumption Analysis 2019 & 2032
- Table 4: Global LNG Liquefaction Terminals Market Revenue Million Forecast, by Import Market Analysis (Value & Volume) 2019 & 2032
- Table 5: Global LNG Liquefaction Terminals Market Revenue Million Forecast, by Export Market Analysis (Value & Volume) 2019 & 2032
- Table 6: Global LNG Liquefaction Terminals Market Revenue Million Forecast, by Price Trend Analysis 2019 & 2032
- Table 7: Global LNG Liquefaction Terminals Market Revenue Million Forecast, by Region 2019 & 2032
- Table 8: Global LNG Liquefaction Terminals Market Revenue Million Forecast, by Country 2019 & 2032
- Table 9: United States Global LNG Liquefaction Terminals Market Revenue (Million) Forecast, by Application 2019 & 2032
- Table 10: Canada Global LNG Liquefaction Terminals Market Revenue (Million) Forecast, by Application 2019 & 2032
- Table 11: Mexico Global LNG Liquefaction Terminals Market Revenue (Million) Forecast, by Application 2019 & 2032
- Table 12: Global LNG Liquefaction Terminals Market Revenue Million Forecast, by Country 2019 & 2032
- Table 13: Germany Global LNG Liquefaction Terminals Market Revenue (Million) Forecast, by Application 2019 & 2032
- Table 14: United Kingdom Global LNG Liquefaction Terminals Market Revenue (Million) Forecast, by Application 2019 & 2032
- Table 15: France Global LNG Liquefaction Terminals Market Revenue (Million) Forecast, by Application 2019 & 2032
- Table 16: Spain Global LNG Liquefaction Terminals Market Revenue (Million) Forecast, by Application 2019 & 2032
- Table 17: Italy Global LNG Liquefaction Terminals Market Revenue (Million) Forecast, by Application 2019 & 2032
- Table 18: Spain Global LNG Liquefaction Terminals Market Revenue (Million) Forecast, by Application 2019 & 2032
- Table 19: Belgium Global LNG Liquefaction Terminals Market Revenue (Million) Forecast, by Application 2019 & 2032
- Table 20: Netherland Global LNG Liquefaction Terminals Market Revenue (Million) Forecast, by Application 2019 & 2032
- Table 21: Nordics Global LNG Liquefaction Terminals Market Revenue (Million) Forecast, by Application 2019 & 2032
- Table 22: Rest of Europe Global LNG Liquefaction Terminals Market Revenue (Million) Forecast, by Application 2019 & 2032
- Table 23: Global LNG Liquefaction Terminals Market Revenue Million Forecast, by Country 2019 & 2032
- Table 24: China Global LNG Liquefaction Terminals Market Revenue (Million) Forecast, by Application 2019 & 2032
- Table 25: Japan Global LNG Liquefaction Terminals Market Revenue (Million) Forecast, by Application 2019 & 2032
- Table 26: India Global LNG Liquefaction Terminals Market Revenue (Million) Forecast, by Application 2019 & 2032
- Table 27: South Korea Global LNG Liquefaction Terminals Market Revenue (Million) Forecast, by Application 2019 & 2032
- Table 28: Southeast Asia Global LNG Liquefaction Terminals Market Revenue (Million) Forecast, by Application 2019 & 2032
- Table 29: Australia Global LNG Liquefaction Terminals Market Revenue (Million) Forecast, by Application 2019 & 2032
- Table 30: Indonesia Global LNG Liquefaction Terminals Market Revenue (Million) Forecast, by Application 2019 & 2032
- Table 31: Phillipes Global LNG Liquefaction Terminals Market Revenue (Million) Forecast, by Application 2019 & 2032
- Table 32: Singapore Global LNG Liquefaction Terminals Market Revenue (Million) Forecast, by Application 2019 & 2032
- Table 33: Thailandc Global LNG Liquefaction Terminals Market Revenue (Million) Forecast, by Application 2019 & 2032
- Table 34: Rest of Asia Pacific Global LNG Liquefaction Terminals Market Revenue (Million) Forecast, by Application 2019 & 2032
- Table 35: Global LNG Liquefaction Terminals Market Revenue Million Forecast, by Country 2019 & 2032
- Table 36: Brazil Global LNG Liquefaction Terminals Market Revenue (Million) Forecast, by Application 2019 & 2032
- Table 37: Argentina Global LNG Liquefaction Terminals Market Revenue (Million) Forecast, by Application 2019 & 2032
- Table 38: Peru Global LNG Liquefaction Terminals Market Revenue (Million) Forecast, by Application 2019 & 2032
- Table 39: Chile Global LNG Liquefaction Terminals Market Revenue (Million) Forecast, by Application 2019 & 2032
- Table 40: Colombia Global LNG Liquefaction Terminals Market Revenue (Million) Forecast, by Application 2019 & 2032
- Table 41: Ecuador Global LNG Liquefaction Terminals Market Revenue (Million) Forecast, by Application 2019 & 2032
- Table 42: Venezuela Global LNG Liquefaction Terminals Market Revenue (Million) Forecast, by Application 2019 & 2032
- Table 43: Rest of South America Global LNG Liquefaction Terminals Market Revenue (Million) Forecast, by Application 2019 & 2032
- Table 44: Global LNG Liquefaction Terminals Market Revenue Million Forecast, by Country 2019 & 2032
- Table 45: United Arab Emirates Global LNG Liquefaction Terminals Market Revenue (Million) Forecast, by Application 2019 & 2032
- Table 46: Saudi Arabia Global LNG Liquefaction Terminals Market Revenue (Million) Forecast, by Application 2019 & 2032
- Table 47: South Africa Global LNG Liquefaction Terminals Market Revenue (Million) Forecast, by Application 2019 & 2032
- Table 48: Rest of Middle East and Africa Global LNG Liquefaction Terminals Market Revenue (Million) Forecast, by Application 2019 & 2032
- Table 49: Global LNG Liquefaction Terminals Market Revenue Million Forecast, by Production Analysis 2019 & 2032
- Table 50: Global LNG Liquefaction Terminals Market Revenue Million Forecast, by Consumption Analysis 2019 & 2032
- Table 51: Global LNG Liquefaction Terminals Market Revenue Million Forecast, by Import Market Analysis (Value & Volume) 2019 & 2032
- Table 52: Global LNG Liquefaction Terminals Market Revenue Million Forecast, by Export Market Analysis (Value & Volume) 2019 & 2032
- Table 53: Global LNG Liquefaction Terminals Market Revenue Million Forecast, by Price Trend Analysis 2019 & 2032
- Table 54: Global LNG Liquefaction Terminals Market Revenue Million Forecast, by Country 2019 & 2032
- Table 55: Global LNG Liquefaction Terminals Market Revenue Million Forecast, by Production Analysis 2019 & 2032
- Table 56: Global LNG Liquefaction Terminals Market Revenue Million Forecast, by Consumption Analysis 2019 & 2032
- Table 57: Global LNG Liquefaction Terminals Market Revenue Million Forecast, by Import Market Analysis (Value & Volume) 2019 & 2032
- Table 58: Global LNG Liquefaction Terminals Market Revenue Million Forecast, by Export Market Analysis (Value & Volume) 2019 & 2032
- Table 59: Global LNG Liquefaction Terminals Market Revenue Million Forecast, by Price Trend Analysis 2019 & 2032
- Table 60: Global LNG Liquefaction Terminals Market Revenue Million Forecast, by Country 2019 & 2032
- Table 61: Global LNG Liquefaction Terminals Market Revenue Million Forecast, by Production Analysis 2019 & 2032
- Table 62: Global LNG Liquefaction Terminals Market Revenue Million Forecast, by Consumption Analysis 2019 & 2032
- Table 63: Global LNG Liquefaction Terminals Market Revenue Million Forecast, by Import Market Analysis (Value & Volume) 2019 & 2032
- Table 64: Global LNG Liquefaction Terminals Market Revenue Million Forecast, by Export Market Analysis (Value & Volume) 2019 & 2032
- Table 65: Global LNG Liquefaction Terminals Market Revenue Million Forecast, by Price Trend Analysis 2019 & 2032
- Table 66: Global LNG Liquefaction Terminals Market Revenue Million Forecast, by Country 2019 & 2032
- Table 67: Global LNG Liquefaction Terminals Market Revenue Million Forecast, by Production Analysis 2019 & 2032
- Table 68: Global LNG Liquefaction Terminals Market Revenue Million Forecast, by Consumption Analysis 2019 & 2032
- Table 69: Global LNG Liquefaction Terminals Market Revenue Million Forecast, by Import Market Analysis (Value & Volume) 2019 & 2032
- Table 70: Global LNG Liquefaction Terminals Market Revenue Million Forecast, by Export Market Analysis (Value & Volume) 2019 & 2032
- Table 71: Global LNG Liquefaction Terminals Market Revenue Million Forecast, by Price Trend Analysis 2019 & 2032
- Table 72: Global LNG Liquefaction Terminals Market Revenue Million Forecast, by Country 2019 & 2032
- Table 73: Global LNG Liquefaction Terminals Market Revenue Million Forecast, by Production Analysis 2019 & 2032
- Table 74: Global LNG Liquefaction Terminals Market Revenue Million Forecast, by Consumption Analysis 2019 & 2032
- Table 75: Global LNG Liquefaction Terminals Market Revenue Million Forecast, by Import Market Analysis (Value & Volume) 2019 & 2032
- Table 76: Global LNG Liquefaction Terminals Market Revenue Million Forecast, by Export Market Analysis (Value & Volume) 2019 & 2032
- Table 77: Global LNG Liquefaction Terminals Market Revenue Million Forecast, by Price Trend Analysis 2019 & 2032
- Table 78: Global LNG Liquefaction Terminals Market Revenue Million Forecast, by Country 2019 & 2032
Frequently Asked Questions
1. What is the projected Compound Annual Growth Rate (CAGR) of the Global LNG Liquefaction Terminals Market?
The projected CAGR is approximately > 6.00%.
2. Which companies are prominent players in the Global LNG Liquefaction Terminals Market?
Key companies in the market include LNG ALLIANCE PTE LTD, Shell PLC, Bechtel Corporation, Exxon Mobil Corporation, Qatargas Operating Company Limited, Chevron Corporation, Petronet LNG Ltd, TotalEnergies SE, China National Offshore Oil Corporation, McDermott International Ltd.
3. What are the main segments of the Global LNG Liquefaction Terminals Market?
The market segments include Production Analysis, Consumption Analysis, Import Market Analysis (Value & Volume), Export Market Analysis (Value & Volume), Price Trend Analysis.
4. Can you provide details about the market size?
The market size is estimated to be USD XX Million as of 2022.
5. What are some drivers contributing to market growth?
4.; Upcoming New Renewable Projects in the Country4.; Expansions of Transmission and Distribution Network.
6. What are the notable trends driving market growth?
Rising the Demand for LNG in Bunkering. Road Transportation. and Off-grid Power..
7. Are there any restraints impacting market growth?
4.; Lack of Private Participation in the Country's Power Sector.
8. Can you provide examples of recent developments in the market?
In May 2022, New Fortress Energy plans to expand its portfolio of Fast LNG liquefaction terminals in the United States Gulf of Mexico. These Fast LNG liquefaction terminals are platform-and-jackup mounted plants designed for rapid buildout. The company would install its first two Fast LNG units in West Delta Lease Block 38, located about 16 nm off Grand Isle, Louisiana.
9. What pricing options are available for accessing the report?
Pricing options include single-user, multi-user, and enterprise licenses priced at USD 4750, USD 5250, and USD 8750 respectively.
10. Is the market size provided in terms of value or volume?
The market size is provided in terms of value, measured in Million.
11. Are there any specific market keywords associated with the report?
Yes, the market keyword associated with the report is "Global LNG Liquefaction Terminals Market," which aids in identifying and referencing the specific market segment covered.
12. How do I determine which pricing option suits my needs best?
The pricing options vary based on user requirements and access needs. Individual users may opt for single-user licenses, while businesses requiring broader access may choose multi-user or enterprise licenses for cost-effective access to the report.
13. Are there any additional resources or data provided in the Global LNG Liquefaction Terminals Market report?
While the report offers comprehensive insights, it's advisable to review the specific contents or supplementary materials provided to ascertain if additional resources or data are available.
14. How can I stay updated on further developments or reports in the Global LNG Liquefaction Terminals Market?
To stay informed about further developments, trends, and reports in the Global LNG Liquefaction Terminals Market, consider subscribing to industry newsletters, following relevant companies and organizations, or regularly checking reputable industry news sources and publications.
Methodology
Step 1 - Identification of Relevant Samples Size from Population Database


Step 2 - Approaches for Defining Global Market Size (Value, Volume* & Price*)

Note*: In applicable scenarios
Step 3 - Data Sources
Primary Research
- Web Analytics
- Survey Reports
- Research Institute
- Latest Research Reports
- Opinion Leaders
Secondary Research
- Annual Reports
- White Paper
- Latest Press Release
- Industry Association
- Paid Database
- Investor Presentations

Step 4 - Data Triangulation
Involves using different sources of information in order to increase the validity of a study
These sources are likely to be stakeholders in a program - participants, other researchers, program staff, other community members, and so on.
Then we put all data in single framework & apply various statistical tools to find out the dynamic on the market.
During the analysis stage, feedback from the stakeholder groups would be compared to determine areas of agreement as well as areas of divergence
