

Key Insights
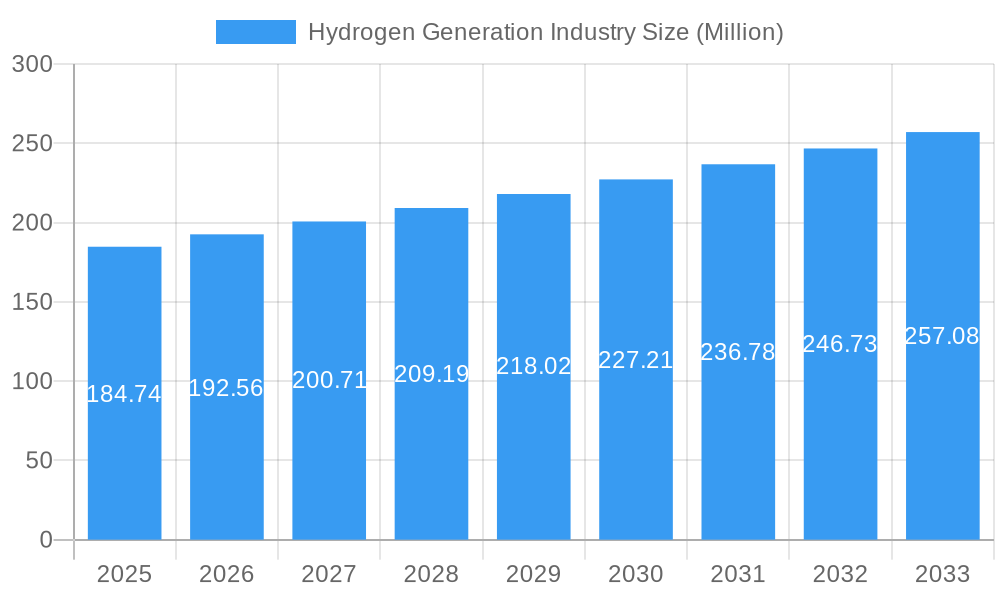
The hydrogen generation market, valued at $184.74 million in 2025, is projected to experience robust growth, driven by increasing demand across various sectors. A compound annual growth rate (CAGR) of 4.23% from 2025 to 2033 indicates a significant expansion in market size. Key drivers include the global push towards decarbonization, stringent environmental regulations aimed at reducing carbon emissions, and the growing adoption of hydrogen as a clean energy carrier in transportation, power generation, and industrial applications. The rising adoption of fuel cell electric vehicles (FCEVs) and the development of large-scale hydrogen storage solutions are further propelling market growth. Technological advancements in electrolysis, particularly green hydrogen production using renewable energy sources, are also playing a crucial role. While the high initial investment costs for hydrogen production infrastructure and the limited availability of renewable energy sources in certain regions pose challenges, government incentives and subsidies are mitigating these restraints. Market segmentation reveals a dynamic landscape with blue, green, and grey hydrogen technologies competing for market share, alongside diverse application areas such as oil refining, chemical processing, and iron & steel production. The geographical distribution shows strong growth potential across North America, Europe, and Asia Pacific, driven by supportive policies and significant industrial presence in these regions. Furthermore, the Middle East and Africa are emerging as significant players due to their abundant resources and strategic focus on renewable energy development.
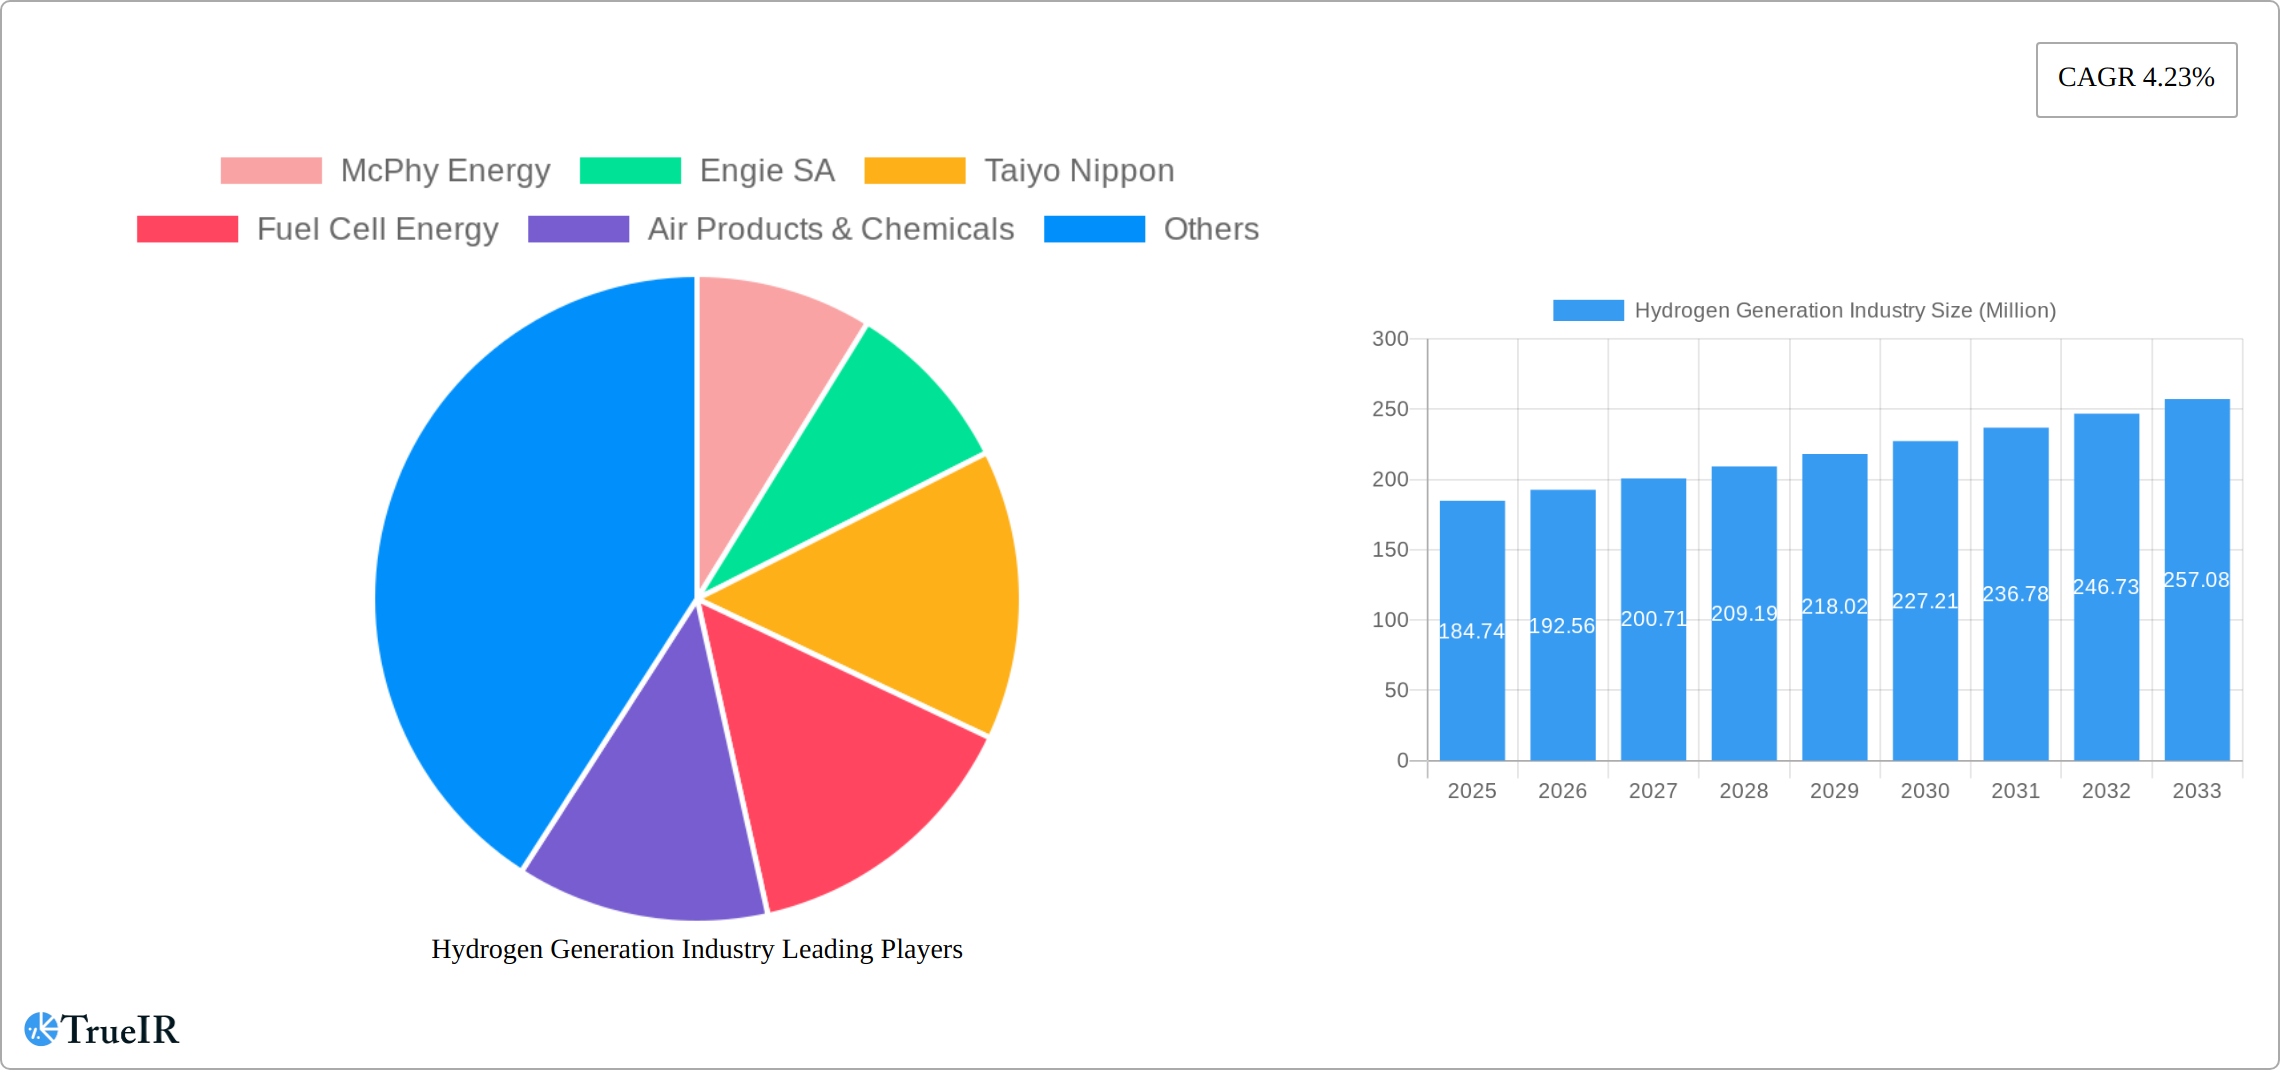
Hydrogen Generation Industry Market Size (In Million)
The competitive landscape is characterized by a mix of established players and emerging companies. Major companies like Air Liquide, Linde plc, and Air Products & Chemicals are leveraging their expertise and infrastructure to capitalize on market opportunities. Meanwhile, innovative companies are focused on developing advanced technologies and expanding their market reach. The interplay between technological advancements, regulatory frameworks, and industrial demand will shape the future trajectory of the hydrogen generation market, making it a sector ripe for continued expansion and investment in the coming years. Successful companies will need to focus on efficiency improvements, cost reductions, and the development of sustainable hydrogen production methods to remain competitive. Strategic partnerships and collaborations will also become increasingly important to unlock economies of scale and accelerate market penetration.
Hydrogen Generation Industry Company Market Share
Hydrogen Generation Industry Market Report: 2019-2033
This comprehensive report provides an in-depth analysis of the global hydrogen generation industry, encompassing market size, segmentation, competitive landscape, technological advancements, and future outlook. The study period covers 2019-2033, with 2025 as the base and estimated year. This report is crucial for investors, industry players, and policymakers seeking to navigate the rapidly evolving hydrogen economy.
Hydrogen Generation Industry Market Structure & Competitive Landscape
The hydrogen generation industry is characterized by a moderately concentrated market structure, with several major players vying for dominance. The Herfindahl-Hirschman Index (HHI) is estimated at xx, indicating a moderately consolidated market. Key players, including Air Liquide, Linde plc, Engie SA, Cummins, and Air Products & Chemicals, hold significant market share, driven by extensive infrastructure, technological expertise, and established global networks. However, the emergence of innovative technologies and new entrants is fostering increased competition.
- Innovation Drivers: Advancements in electrolysis technologies (PEM, alkaline), improvements in SMR efficiency, and the development of alternative hydrogen sources (e.g., biomass gasification) are driving industry innovation.
- Regulatory Impacts: Government policies promoting renewable energy and carbon reduction are significant catalysts, while evolving regulations regarding emissions and safety standards influence operational costs and investment decisions.
- Product Substitutes: While direct substitutes for hydrogen are limited, alternative energy sources like natural gas and renewable electricity compete for the same applications.
- End-User Segmentation: The industry caters to diverse end-users, including oil refineries (xx Million USD in 2025), chemical processing (xx Million USD in 2025), iron & steel production (xx Million USD in 2025), and emerging sectors like transportation and power generation.
- M&A Trends: The past five years have witnessed xx major mergers and acquisitions (M&A) deals, totaling an estimated xx Million USD, reflecting consolidation efforts and strategic expansions within the sector.
Hydrogen Generation Industry Market Trends & Opportunities
The global hydrogen generation market is experiencing explosive growth, fueled by the escalating demand for clean energy and the tightening of environmental regulations worldwide. Industry projections estimate a market value of xx Million USD by 2033, representing a Compound Annual Growth Rate (CAGR) of xx% during the forecast period (2025-2033). This surge is primarily driven by the rapid adoption of green hydrogen, significantly boosted by government incentives, corporate sustainability commitments, and a growing consumer preference for cleaner energy sources. Technological breakthroughs are simultaneously lowering production costs and enhancing efficiency, creating a highly favorable environment for market expansion. The competitive landscape is dynamic, with established industry players and innovative startups vying for market share through strategic partnerships, technological advancements, and aggressive expansion strategies. Market penetration of green hydrogen is poised to increase substantially, from xx% in 2025 to xx% by 2033.
Dominant Markets & Segments in Hydrogen Generation Industry
Leading Regions/Countries: The Asia-Pacific region is projected to maintain its dominance in the market throughout 2025, commanding xx% of global revenue, followed by Europe (xx%) and North America (xx%). This regional leadership stems from supportive government policies, robust industrial demand, and substantial investments in hydrogen infrastructure development.
- Key Growth Drivers in Asia-Pacific:
- Government-led initiatives and attractive financial incentives for hydrogen production and utilization.
- Significant industrial demand for hydrogen across sectors such as refining, fertilizer production, and emerging applications.
- Large-scale investments in research and development (R&D) and crucial infrastructure development.
Dominant Segments:
- Source: Green hydrogen is anticipated to exhibit the most rapid growth, boasting a CAGR of xx% from 2025-2033, driven by its environmental advantages and the increasing accessibility of renewable energy sources. Grey hydrogen will retain a substantial market share due to its currently lower production cost, while blue hydrogen's growth trajectory will be significantly influenced by advancements in carbon capture technology.
- Technology: Steam Methane Reforming (SMR) currently holds the largest market share due to its established infrastructure and comparatively lower initial investment costs. However, electrolysis technologies are rapidly gaining traction, with Proton Exchange Membrane (PEM) electrolysis emerging as a frontrunner due to its superior efficiency and scalability potential.
- Application: Traditional applications like oil refining, chemical processing, and iron & steel production remain major consumers of hydrogen, collectively representing xx% of the market share in 2025. However, the transportation sector is rapidly evolving into a key area with considerable future growth potential.
Hydrogen Generation Industry Product Analysis
The hydrogen generation industry is characterized by rapid product innovation, with a strong emphasis on enhancing efficiency, reducing costs, and minimizing environmental impact. Electrolyzer technology is a prime focus of innovation, with PEM electrolyzers gaining significant traction due to their superior efficiency compared to alkaline electrolyzers. Concurrent efforts are focused on developing cost-effective and reliable carbon capture technologies to facilitate the widespread adoption of blue hydrogen. These technological advancements are broadening the market applicability of hydrogen, extending its reach beyond traditional industrial applications and into emerging sectors.
Key Drivers, Barriers & Challenges in Hydrogen Generation Industry
Key Drivers: The increasing urgency to mitigate climate change, supportive government policies and incentives (e.g., tax credits, subsidies), decreasing production costs of renewable hydrogen, and advancements in storage and transportation technologies are pushing the industry's growth. Specific examples include the EU's hydrogen strategy and various national hydrogen roadmaps worldwide.
Challenges: High production costs, particularly for green hydrogen, remain a significant barrier. Scaling up production to meet growing demand while ensuring a secure and reliable hydrogen supply chain is critical. Regulatory uncertainties and inconsistent policy frameworks across different regions add complexity. The lack of sufficient hydrogen infrastructure—pipelines, storage, and transportation—also poses a significant challenge. Competitive pressures from existing energy sources and the need for substantial investment in research and development further complicate the market landscape. The estimated capital investment needed to expand the global hydrogen infrastructure is around xx Million USD over the next decade.
Growth Drivers in the Hydrogen Generation Industry Market
The remarkable growth of the hydrogen generation industry is fueled by a convergence of powerful factors. Robust government support, manifested through comprehensive policy frameworks and attractive financial incentives, plays a crucial role. Continuous technological progress, particularly in electrolysis, leads to decreased production costs and increased efficiency, further accelerating market growth. The escalating demand for hydrogen across diverse sectors, including transportation, energy storage, and industrial applications, is a significant driver. Finally, the growing global awareness of climate change and the increasing focus on decarbonization efforts are propelling the shift towards clean hydrogen solutions.
Challenges Impacting Hydrogen Generation Industry Growth
Despite the significant growth potential, several challenges impede the expansion of the hydrogen generation industry. The substantial capital investment required for large-scale infrastructure development presents a major hurdle. The inherent intermittency of renewable energy sources used for green hydrogen production necessitates the development of solutions for ensuring consistent supply. Addressing safety concerns related to hydrogen storage and transportation requires robust regulatory frameworks and stringent safety standards. Finally, the industry faces ongoing competition from established fossil fuels and other emerging energy sources.
Key Players Shaping the Hydrogen Generation Industry Market
- McPhy Energy
- Engie SA
- Taiyo Nippon Sanso
- Fuel Cell Energy
- Air Products & Chemicals
- Linde plc
- Cummins
- Messer Group GmbH
- Air Liquide
- ITM Power plc
- Enapter
Significant Hydrogen Generation Industry Milestones
- October 2023: H2B2 unveils the SoHyCal green hydrogen plant in Fresno, California, utilizing PEM technology.
- October 2023: Hygenco Green Energies announces plans for a green H2 plant in Maharashtra, India, supplying green hydrogen and oxygen to Sterlite Technologies Ltd.
- May 2023: RWE and Westfalen Group announce plans to develop up to 70 hydrogen fueling stations in Germany by 2030.
Future Outlook for Hydrogen Generation Industry Market
The hydrogen generation industry is poised for significant growth over the next decade, driven by the growing need for clean energy and supportive government policies. Strategic opportunities abound in developing innovative production technologies, expanding infrastructure, and exploring new applications. The market potential is substantial, with projections indicating a substantial increase in market size and penetration rates. Addressing challenges related to cost, infrastructure, and safety will be crucial for unlocking the full potential of this industry.
Hydrogen Generation Industry Segmentation
-
1. Source
- 1.1. Blue hydrogen
- 1.2. Green hydrogen
- 1.3. Grey Hydrogen
-
2. Technology
- 2.1. Steam Methane Reforming (SMR)
- 2.2. Coal Gasification
- 2.3. Other Technologies
-
3. Application
- 3.1. Oil Refining
- 3.2. Chemical Processing
- 3.3. Iron & Steel Production
- 3.4. Other Applications
Hydrogen Generation Industry Segmentation By Geography
-
1. North America
- 1.1. United States
- 1.2. Canada
- 1.3. Rest of North America
-
2. Europe
- 2.1. Germany
- 2.2. France
- 2.3. Italy
- 2.4. United Kingdom
- 2.5. Russian Federation
- 2.6. Rest of Europe
- 3. Middle East
-
4. Saudi Arabia
- 4.1. United Arab Emirates
- 4.2. South Africa
- 4.3. Rest of Middle East and Africa
-
5. Asia Pacific
- 5.1. China
- 5.2. India
- 5.3. Japan
- 5.4. South Korea
- 5.5. Rest of Asia Pacific
-
6. South America
- 6.1. Brazil
- 6.2. Argentina
- 6.3. Rest of South America
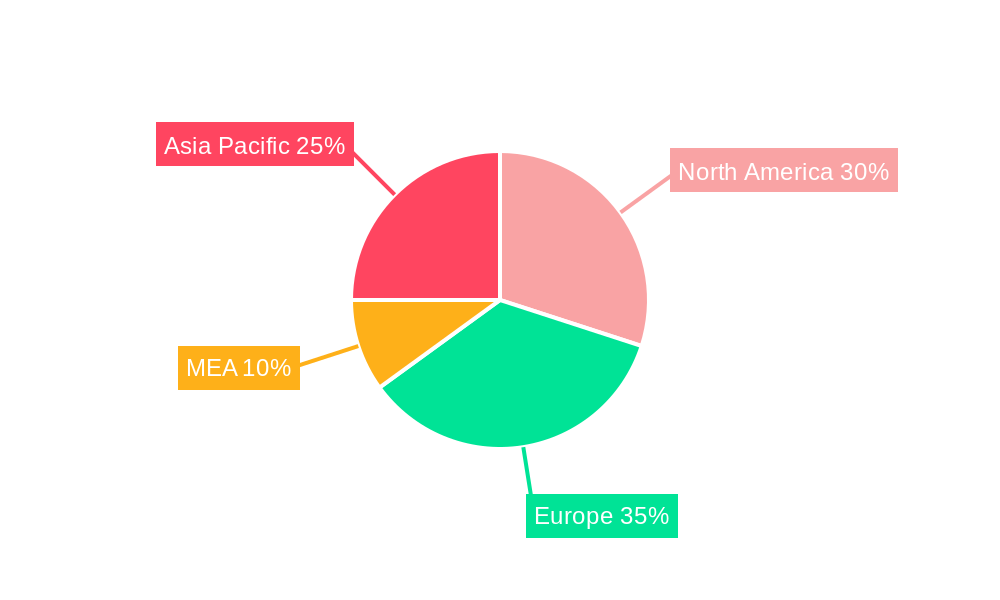
Hydrogen Generation Industry Regional Market Share
Geographic Coverage of Hydrogen Generation Industry
Hydrogen Generation Industry REPORT HIGHLIGHTS
| Aspects | Details |
|---|---|
| Study Period | 2020-2034 |
| Base Year | 2025 |
| Estimated Year | 2026 |
| Forecast Period | 2026-2034 |
| Historical Period | 2020-2025 |
| Growth Rate | CAGR of 4.23% from 2020-2034 |
| Segmentation |
|
Table of Contents
- 1. Introduction
- 1.1. Research Scope
- 1.2. Market Segmentation
- 1.3. Research Objective
- 1.4. Definitions and Assumptions
- 2. Executive Summary
- 2.1. Market Snapshot
- 3. Market Dynamics
- 3.1. Market Drivers
- 3.2. Market Restrains
- 3.3. Market Trends
- 3.4. Market Opportunities
- 4. Market Factor Analysis
- 4.1. Porters Five Forces
- 4.1.1. Bargaining Power of Suppliers
- 4.1.2. Bargaining Power of Buyers
- 4.1.3. Threat of New Entrants
- 4.1.4. Threat of Substitutes
- 4.1.5. Competitive Rivalry
- 4.2. PESTEL analysis
- 4.3. BCG Analysis
- 4.3.1. Stars (High Growth, High Market Share)
- 4.3.2. Cash Cows (Low Growth, High Market Share)
- 4.3.3. Question Mark (High Growth, Low Market Share)
- 4.3.4. Dogs (Low Growth, Low Market Share)
- 4.4. Ansoff Matrix Analysis
- 4.5. Supply Chain Analysis
- 4.6. Regulatory Landscape
- 4.7. Current Market Potential and Opportunity Assessment (TAM–SAM–SOM Framework)
- 4.8. TIR Analyst Note
- 4.1. Porters Five Forces
- 5. Market Analysis, Insights and Forecast 2021-2033
- 5.1. Market Analysis, Insights and Forecast - by Source
- 5.1.1. Blue hydrogen
- 5.1.2. Green hydrogen
- 5.1.3. Grey Hydrogen
- 5.2. Market Analysis, Insights and Forecast - by Technology
- 5.2.1. Steam Methane Reforming (SMR)
- 5.2.2. Coal Gasification
- 5.2.3. Other Technologies
- 5.3. Market Analysis, Insights and Forecast - by Application
- 5.3.1. Oil Refining
- 5.3.2. Chemical Processing
- 5.3.3. Iron & Steel Production
- 5.3.4. Other Applications
- 5.4. Market Analysis, Insights and Forecast - by Region
- 5.4.1. North America
- 5.4.2. Europe
- 5.4.3. Middle East
- 5.4.4. Saudi Arabia
- 5.4.5. Asia Pacific
- 5.4.6. South America
- 5.1. Market Analysis, Insights and Forecast - by Source
- 6. Global Hydrogen Generation Industry Analysis, Insights and Forecast, 2021-2033
- 6.1. Market Analysis, Insights and Forecast - by Source
- 6.1.1. Blue hydrogen
- 6.1.2. Green hydrogen
- 6.1.3. Grey Hydrogen
- 6.2. Market Analysis, Insights and Forecast - by Technology
- 6.2.1. Steam Methane Reforming (SMR)
- 6.2.2. Coal Gasification
- 6.2.3. Other Technologies
- 6.3. Market Analysis, Insights and Forecast - by Application
- 6.3.1. Oil Refining
- 6.3.2. Chemical Processing
- 6.3.3. Iron & Steel Production
- 6.3.4. Other Applications
- 6.1. Market Analysis, Insights and Forecast - by Source
- 7. North America Hydrogen Generation Industry Analysis, Insights and Forecast, 2020-2032
- 7.1. Market Analysis, Insights and Forecast - by Source
- 7.1.1. Blue hydrogen
- 7.1.2. Green hydrogen
- 7.1.3. Grey Hydrogen
- 7.2. Market Analysis, Insights and Forecast - by Technology
- 7.2.1. Steam Methane Reforming (SMR)
- 7.2.2. Coal Gasification
- 7.2.3. Other Technologies
- 7.3. Market Analysis, Insights and Forecast - by Application
- 7.3.1. Oil Refining
- 7.3.2. Chemical Processing
- 7.3.3. Iron & Steel Production
- 7.3.4. Other Applications
- 7.1. Market Analysis, Insights and Forecast - by Source
- 8. Europe Hydrogen Generation Industry Analysis, Insights and Forecast, 2020-2032
- 8.1. Market Analysis, Insights and Forecast - by Source
- 8.1.1. Blue hydrogen
- 8.1.2. Green hydrogen
- 8.1.3. Grey Hydrogen
- 8.2. Market Analysis, Insights and Forecast - by Technology
- 8.2.1. Steam Methane Reforming (SMR)
- 8.2.2. Coal Gasification
- 8.2.3. Other Technologies
- 8.3. Market Analysis, Insights and Forecast - by Application
- 8.3.1. Oil Refining
- 8.3.2. Chemical Processing
- 8.3.3. Iron & Steel Production
- 8.3.4. Other Applications
- 8.1. Market Analysis, Insights and Forecast - by Source
- 9. Middle East Hydrogen Generation Industry Analysis, Insights and Forecast, 2020-2032
- 9.1. Market Analysis, Insights and Forecast - by Source
- 9.1.1. Blue hydrogen
- 9.1.2. Green hydrogen
- 9.1.3. Grey Hydrogen
- 9.2. Market Analysis, Insights and Forecast - by Technology
- 9.2.1. Steam Methane Reforming (SMR)
- 9.2.2. Coal Gasification
- 9.2.3. Other Technologies
- 9.3. Market Analysis, Insights and Forecast - by Application
- 9.3.1. Oil Refining
- 9.3.2. Chemical Processing
- 9.3.3. Iron & Steel Production
- 9.3.4. Other Applications
- 9.1. Market Analysis, Insights and Forecast - by Source
- 10. Saudi Arabia Hydrogen Generation Industry Analysis, Insights and Forecast, 2020-2032
- 10.1. Market Analysis, Insights and Forecast - by Source
- 10.1.1. Blue hydrogen
- 10.1.2. Green hydrogen
- 10.1.3. Grey Hydrogen
- 10.2. Market Analysis, Insights and Forecast - by Technology
- 10.2.1. Steam Methane Reforming (SMR)
- 10.2.2. Coal Gasification
- 10.2.3. Other Technologies
- 10.3. Market Analysis, Insights and Forecast - by Application
- 10.3.1. Oil Refining
- 10.3.2. Chemical Processing
- 10.3.3. Iron & Steel Production
- 10.3.4. Other Applications
- 10.1. Market Analysis, Insights and Forecast - by Source
- 11. Asia Pacific Hydrogen Generation Industry Analysis, Insights and Forecast, 2020-2032
- 11.1. Market Analysis, Insights and Forecast - by Source
- 11.1.1. Blue hydrogen
- 11.1.2. Green hydrogen
- 11.1.3. Grey Hydrogen
- 11.2. Market Analysis, Insights and Forecast - by Technology
- 11.2.1. Steam Methane Reforming (SMR)
- 11.2.2. Coal Gasification
- 11.2.3. Other Technologies
- 11.3. Market Analysis, Insights and Forecast - by Application
- 11.3.1. Oil Refining
- 11.3.2. Chemical Processing
- 11.3.3. Iron & Steel Production
- 11.3.4. Other Applications
- 11.1. Market Analysis, Insights and Forecast - by Source
- 12. South America Hydrogen Generation Industry Analysis, Insights and Forecast, 2020-2032
- 12.1. Market Analysis, Insights and Forecast - by Source
- 12.1.1. Blue hydrogen
- 12.1.2. Green hydrogen
- 12.1.3. Grey Hydrogen
- 12.2. Market Analysis, Insights and Forecast - by Technology
- 12.2.1. Steam Methane Reforming (SMR)
- 12.2.2. Coal Gasification
- 12.2.3. Other Technologies
- 12.3. Market Analysis, Insights and Forecast - by Application
- 12.3.1. Oil Refining
- 12.3.2. Chemical Processing
- 12.3.3. Iron & Steel Production
- 12.3.4. Other Applications
- 12.1. Market Analysis, Insights and Forecast - by Source
- 13. Competitive Analysis
- 13.1. Company Profiles
- 13.1.1 McPhy Energy
- 13.1.1.1. Company Overview
- 13.1.1.2. Products
- 13.1.1.3. Company Financials
- 13.1.1.4. SWOT Analysis
- 13.1.2 Engie SA
- 13.1.2.1. Company Overview
- 13.1.2.2. Products
- 13.1.2.3. Company Financials
- 13.1.2.4. SWOT Analysis
- 13.1.3 Taiyo Nippon
- 13.1.3.1. Company Overview
- 13.1.3.2. Products
- 13.1.3.3. Company Financials
- 13.1.3.4. SWOT Analysis
- 13.1.4 Fuel Cell Energy
- 13.1.4.1. Company Overview
- 13.1.4.2. Products
- 13.1.4.3. Company Financials
- 13.1.4.4. SWOT Analysis
- 13.1.5 Air Products & Chemicals
- 13.1.5.1. Company Overview
- 13.1.5.2. Products
- 13.1.5.3. Company Financials
- 13.1.5.4. SWOT Analysis
- 13.1.6 Linde plc
- 13.1.6.1. Company Overview
- 13.1.6.2. Products
- 13.1.6.3. Company Financials
- 13.1.6.4. SWOT Analysis
- 13.1.7 Cummins
- 13.1.7.1. Company Overview
- 13.1.7.2. Products
- 13.1.7.3. Company Financials
- 13.1.7.4. SWOT Analysis
- 13.1.8 Messer Group GmbH
- 13.1.8.1. Company Overview
- 13.1.8.2. Products
- 13.1.8.3. Company Financials
- 13.1.8.4. SWOT Analysis
- 13.1.9 Air Liquide
- 13.1.9.1. Company Overview
- 13.1.9.2. Products
- 13.1.9.3. Company Financials
- 13.1.9.4. SWOT Analysis
- 13.1.10 ITM Power plc
- 13.1.10.1. Company Overview
- 13.1.10.2. Products
- 13.1.10.3. Company Financials
- 13.1.10.4. SWOT Analysis
- 13.1.11 Enapter
- 13.1.11.1. Company Overview
- 13.1.11.2. Products
- 13.1.11.3. Company Financials
- 13.1.11.4. SWOT Analysis
- 13.1.1 McPhy Energy
- 13.2. Market Entropy
- 13.2.1 Company's Key Areas Served
- 13.2.2 Recent Developments
- 13.3. Company Market Share Analysis 2025
- 13.3.1 Top 5 Companies Market Share Analysis
- 13.3.2 Top 3 Companies Market Share Analysis
- 13.4. List of Potential Customers
- 14. Research Methodology
List of Figures
- Figure 1: Global Hydrogen Generation Industry Revenue Breakdown (Million, %) by Region 2025 & 2033
- Figure 2: North America Hydrogen Generation Industry Revenue (Million), by Source 2025 & 2033
- Figure 3: North America Hydrogen Generation Industry Revenue Share (%), by Source 2025 & 2033
- Figure 4: North America Hydrogen Generation Industry Revenue (Million), by Technology 2025 & 2033
- Figure 5: North America Hydrogen Generation Industry Revenue Share (%), by Technology 2025 & 2033
- Figure 6: North America Hydrogen Generation Industry Revenue (Million), by Application 2025 & 2033
- Figure 7: North America Hydrogen Generation Industry Revenue Share (%), by Application 2025 & 2033
- Figure 8: North America Hydrogen Generation Industry Revenue (Million), by Country 2025 & 2033
- Figure 9: North America Hydrogen Generation Industry Revenue Share (%), by Country 2025 & 2033
- Figure 10: Europe Hydrogen Generation Industry Revenue (Million), by Source 2025 & 2033
- Figure 11: Europe Hydrogen Generation Industry Revenue Share (%), by Source 2025 & 2033
- Figure 12: Europe Hydrogen Generation Industry Revenue (Million), by Technology 2025 & 2033
- Figure 13: Europe Hydrogen Generation Industry Revenue Share (%), by Technology 2025 & 2033
- Figure 14: Europe Hydrogen Generation Industry Revenue (Million), by Application 2025 & 2033
- Figure 15: Europe Hydrogen Generation Industry Revenue Share (%), by Application 2025 & 2033
- Figure 16: Europe Hydrogen Generation Industry Revenue (Million), by Country 2025 & 2033
- Figure 17: Europe Hydrogen Generation Industry Revenue Share (%), by Country 2025 & 2033
- Figure 18: Middle East Hydrogen Generation Industry Revenue (Million), by Source 2025 & 2033
- Figure 19: Middle East Hydrogen Generation Industry Revenue Share (%), by Source 2025 & 2033
- Figure 20: Middle East Hydrogen Generation Industry Revenue (Million), by Technology 2025 & 2033
- Figure 21: Middle East Hydrogen Generation Industry Revenue Share (%), by Technology 2025 & 2033
- Figure 22: Middle East Hydrogen Generation Industry Revenue (Million), by Application 2025 & 2033
- Figure 23: Middle East Hydrogen Generation Industry Revenue Share (%), by Application 2025 & 2033
- Figure 24: Middle East Hydrogen Generation Industry Revenue (Million), by Country 2025 & 2033
- Figure 25: Middle East Hydrogen Generation Industry Revenue Share (%), by Country 2025 & 2033
- Figure 26: Saudi Arabia Hydrogen Generation Industry Revenue (Million), by Source 2025 & 2033
- Figure 27: Saudi Arabia Hydrogen Generation Industry Revenue Share (%), by Source 2025 & 2033
- Figure 28: Saudi Arabia Hydrogen Generation Industry Revenue (Million), by Technology 2025 & 2033
- Figure 29: Saudi Arabia Hydrogen Generation Industry Revenue Share (%), by Technology 2025 & 2033
- Figure 30: Saudi Arabia Hydrogen Generation Industry Revenue (Million), by Application 2025 & 2033
- Figure 31: Saudi Arabia Hydrogen Generation Industry Revenue Share (%), by Application 2025 & 2033
- Figure 32: Saudi Arabia Hydrogen Generation Industry Revenue (Million), by Country 2025 & 2033
- Figure 33: Saudi Arabia Hydrogen Generation Industry Revenue Share (%), by Country 2025 & 2033
- Figure 34: Asia Pacific Hydrogen Generation Industry Revenue (Million), by Source 2025 & 2033
- Figure 35: Asia Pacific Hydrogen Generation Industry Revenue Share (%), by Source 2025 & 2033
- Figure 36: Asia Pacific Hydrogen Generation Industry Revenue (Million), by Technology 2025 & 2033
- Figure 37: Asia Pacific Hydrogen Generation Industry Revenue Share (%), by Technology 2025 & 2033
- Figure 38: Asia Pacific Hydrogen Generation Industry Revenue (Million), by Application 2025 & 2033
- Figure 39: Asia Pacific Hydrogen Generation Industry Revenue Share (%), by Application 2025 & 2033
- Figure 40: Asia Pacific Hydrogen Generation Industry Revenue (Million), by Country 2025 & 2033
- Figure 41: Asia Pacific Hydrogen Generation Industry Revenue Share (%), by Country 2025 & 2033
- Figure 42: South America Hydrogen Generation Industry Revenue (Million), by Source 2025 & 2033
- Figure 43: South America Hydrogen Generation Industry Revenue Share (%), by Source 2025 & 2033
- Figure 44: South America Hydrogen Generation Industry Revenue (Million), by Technology 2025 & 2033
- Figure 45: South America Hydrogen Generation Industry Revenue Share (%), by Technology 2025 & 2033
- Figure 46: South America Hydrogen Generation Industry Revenue (Million), by Application 2025 & 2033
- Figure 47: South America Hydrogen Generation Industry Revenue Share (%), by Application 2025 & 2033
- Figure 48: South America Hydrogen Generation Industry Revenue (Million), by Country 2025 & 2033
- Figure 49: South America Hydrogen Generation Industry Revenue Share (%), by Country 2025 & 2033
List of Tables
- Table 1: Global Hydrogen Generation Industry Revenue Million Forecast, by Source 2020 & 2033
- Table 2: Global Hydrogen Generation Industry Revenue Million Forecast, by Technology 2020 & 2033
- Table 3: Global Hydrogen Generation Industry Revenue Million Forecast, by Application 2020 & 2033
- Table 4: Global Hydrogen Generation Industry Revenue Million Forecast, by Region 2020 & 2033
- Table 5: Global Hydrogen Generation Industry Revenue Million Forecast, by Source 2020 & 2033
- Table 6: Global Hydrogen Generation Industry Revenue Million Forecast, by Technology 2020 & 2033
- Table 7: Global Hydrogen Generation Industry Revenue Million Forecast, by Application 2020 & 2033
- Table 8: Global Hydrogen Generation Industry Revenue Million Forecast, by Country 2020 & 2033
- Table 9: United States Hydrogen Generation Industry Revenue (Million) Forecast, by Application 2020 & 2033
- Table 10: Canada Hydrogen Generation Industry Revenue (Million) Forecast, by Application 2020 & 2033
- Table 11: Rest of North America Hydrogen Generation Industry Revenue (Million) Forecast, by Application 2020 & 2033
- Table 12: Global Hydrogen Generation Industry Revenue Million Forecast, by Source 2020 & 2033
- Table 13: Global Hydrogen Generation Industry Revenue Million Forecast, by Technology 2020 & 2033
- Table 14: Global Hydrogen Generation Industry Revenue Million Forecast, by Application 2020 & 2033
- Table 15: Global Hydrogen Generation Industry Revenue Million Forecast, by Country 2020 & 2033
- Table 16: Germany Hydrogen Generation Industry Revenue (Million) Forecast, by Application 2020 & 2033
- Table 17: France Hydrogen Generation Industry Revenue (Million) Forecast, by Application 2020 & 2033
- Table 18: Italy Hydrogen Generation Industry Revenue (Million) Forecast, by Application 2020 & 2033
- Table 19: United Kingdom Hydrogen Generation Industry Revenue (Million) Forecast, by Application 2020 & 2033
- Table 20: Russian Federation Hydrogen Generation Industry Revenue (Million) Forecast, by Application 2020 & 2033
- Table 21: Rest of Europe Hydrogen Generation Industry Revenue (Million) Forecast, by Application 2020 & 2033
- Table 22: Global Hydrogen Generation Industry Revenue Million Forecast, by Source 2020 & 2033
- Table 23: Global Hydrogen Generation Industry Revenue Million Forecast, by Technology 2020 & 2033
- Table 24: Global Hydrogen Generation Industry Revenue Million Forecast, by Application 2020 & 2033
- Table 25: Global Hydrogen Generation Industry Revenue Million Forecast, by Country 2020 & 2033
- Table 26: Global Hydrogen Generation Industry Revenue Million Forecast, by Source 2020 & 2033
- Table 27: Global Hydrogen Generation Industry Revenue Million Forecast, by Technology 2020 & 2033
- Table 28: Global Hydrogen Generation Industry Revenue Million Forecast, by Application 2020 & 2033
- Table 29: Global Hydrogen Generation Industry Revenue Million Forecast, by Country 2020 & 2033
- Table 30: United Arab Emirates Hydrogen Generation Industry Revenue (Million) Forecast, by Application 2020 & 2033
- Table 31: South Africa Hydrogen Generation Industry Revenue (Million) Forecast, by Application 2020 & 2033
- Table 32: Rest of Middle East and Africa Hydrogen Generation Industry Revenue (Million) Forecast, by Application 2020 & 2033
- Table 33: Global Hydrogen Generation Industry Revenue Million Forecast, by Source 2020 & 2033
- Table 34: Global Hydrogen Generation Industry Revenue Million Forecast, by Technology 2020 & 2033
- Table 35: Global Hydrogen Generation Industry Revenue Million Forecast, by Application 2020 & 2033
- Table 36: Global Hydrogen Generation Industry Revenue Million Forecast, by Country 2020 & 2033
- Table 37: China Hydrogen Generation Industry Revenue (Million) Forecast, by Application 2020 & 2033
- Table 38: India Hydrogen Generation Industry Revenue (Million) Forecast, by Application 2020 & 2033
- Table 39: Japan Hydrogen Generation Industry Revenue (Million) Forecast, by Application 2020 & 2033
- Table 40: South Korea Hydrogen Generation Industry Revenue (Million) Forecast, by Application 2020 & 2033
- Table 41: Rest of Asia Pacific Hydrogen Generation Industry Revenue (Million) Forecast, by Application 2020 & 2033
- Table 42: Global Hydrogen Generation Industry Revenue Million Forecast, by Source 2020 & 2033
- Table 43: Global Hydrogen Generation Industry Revenue Million Forecast, by Technology 2020 & 2033
- Table 44: Global Hydrogen Generation Industry Revenue Million Forecast, by Application 2020 & 2033
- Table 45: Global Hydrogen Generation Industry Revenue Million Forecast, by Country 2020 & 2033
- Table 46: Brazil Hydrogen Generation Industry Revenue (Million) Forecast, by Application 2020 & 2033
- Table 47: Argentina Hydrogen Generation Industry Revenue (Million) Forecast, by Application 2020 & 2033
- Table 48: Rest of South America Hydrogen Generation Industry Revenue (Million) Forecast, by Application 2020 & 2033
Frequently Asked Questions
1. What is the projected Compound Annual Growth Rate (CAGR) of the Hydrogen Generation Industry?
The projected CAGR is approximately 4.23%.
2. Which companies are prominent players in the Hydrogen Generation Industry?
Key companies in the market include McPhy Energy, Engie SA, Taiyo Nippon, Fuel Cell Energy, Air Products & Chemicals, Linde plc, Cummins, Messer Group GmbH, Air Liquide, ITM Power plc, Enapter.
3. What are the main segments of the Hydrogen Generation Industry?
The market segments include Source, Technology, Application.
4. Can you provide details about the market size?
The market size is estimated to be USD 184.74 Million as of 2022.
5. What are some drivers contributing to market growth?
4.; Favorable Government Policies4.; Increasing Demand From Refinery and Industrial Sector.
6. What are the notable trends driving market growth?
Oil Refining Segment Expected to Dominate the Market.
7. Are there any restraints impacting market growth?
4.; Higher Production Cost.
8. Can you provide examples of recent developments in the market?
October 2023: H2B2, a technology company with a portfolio in Hydrogen production systems, unveiled the green hydrogen plant, which is expected to become operational in North America, the SoHyCal facility located in Fresno, California, United States. The project envisages 100 percent clean hydrogen production using PEM technology.
9. What pricing options are available for accessing the report?
Pricing options include single-user, multi-user, and enterprise licenses priced at USD 4750, USD 5250, and USD 8750 respectively.
10. Is the market size provided in terms of value or volume?
The market size is provided in terms of value, measured in Million.
11. Are there any specific market keywords associated with the report?
Yes, the market keyword associated with the report is "Hydrogen Generation Industry," which aids in identifying and referencing the specific market segment covered.
12. How do I determine which pricing option suits my needs best?
The pricing options vary based on user requirements and access needs. Individual users may opt for single-user licenses, while businesses requiring broader access may choose multi-user or enterprise licenses for cost-effective access to the report.
13. Are there any additional resources or data provided in the Hydrogen Generation Industry report?
While the report offers comprehensive insights, it's advisable to review the specific contents or supplementary materials provided to ascertain if additional resources or data are available.
14. How can I stay updated on further developments or reports in the Hydrogen Generation Industry?
To stay informed about further developments, trends, and reports in the Hydrogen Generation Industry, consider subscribing to industry newsletters, following relevant companies and organizations, or regularly checking reputable industry news sources and publications.
Methodology
Step 1 - Identification of Relevant Samples Size from Population Database


Step 2 - Approaches for Defining Global Market Size (Value, Volume* & Price*)

Note*: In applicable scenarios
Step 3 - Data Sources
Primary Research
- Web Analytics
- Survey Reports
- Research Institute
- Latest Research Reports
- Opinion Leaders
Secondary Research
- Annual Reports
- White Paper
- Latest Press Release
- Industry Association
- Paid Database
- Investor Presentations

Step 4 - Data Triangulation
Involves using different sources of information in order to increase the validity of a study
These sources are likely to be stakeholders in a program - participants, other researchers, program staff, other community members, and so on.
Then we put all data in single framework & apply various statistical tools to find out the dynamic on the market.
During the analysis stage, feedback from the stakeholder groups would be compared to determine areas of agreement as well as areas of divergence