

Key Insights
The global Liquefied Petroleum Gas (LPG) market is projected for substantial expansion, driven by escalating energy requirements in developing nations and increased utilization across residential, commercial, and industrial applications. The market, valued at $123.14 billion in the base year 2024, is anticipated to achieve a Compound Annual Growth Rate (CAGR) of 3.9%. Key growth drivers include rapid urbanization, leading to higher demand for cooking fuel; government policies encouraging cleaner energy alternatives; and the growing adoption of LPG as an automotive fuel, particularly in emerging economies. While crude oil price volatility presents a challenge, the industry's diversification of production sources and advancements in storage and transportation technologies are bolstering market resilience and efficiency. Asia-Pacific and the Middle East are identified as key growth regions due to their high population density and ongoing industrialization. However, evolving environmental regulations in developed markets necessitate a strategic focus on sustainable production and emission reduction technologies.
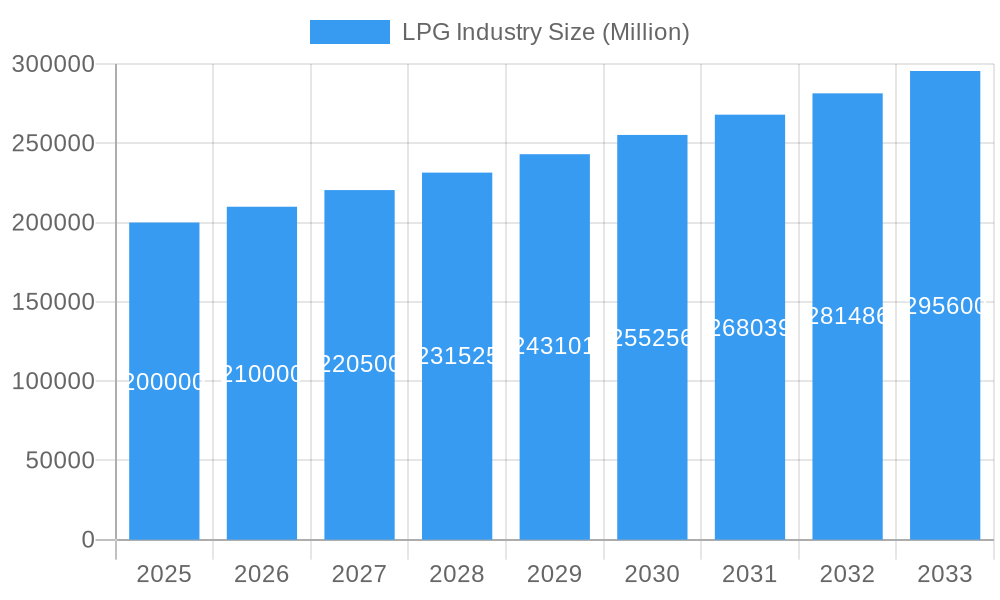
LPG Industry Market Size (In Billion)
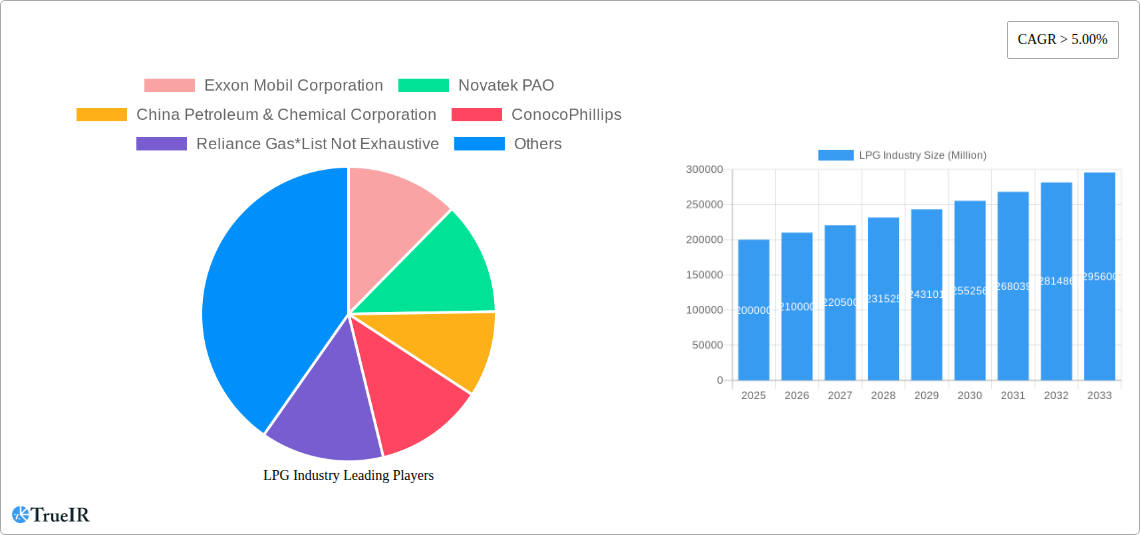
The LPG sector features a competitive environment with prominent companies actively pursuing market share through strategic alliances, mergers, acquisitions, and capacity enhancements. The industry comprises vertically integrated players and specialized operators, all focused on capitalizing on market trends. Future growth will be influenced by global energy policies, technological innovations, and shifts in consumer preferences towards sustainable energy solutions. LPG's inherent versatility as both a fuel and a feedstock for petrochemicals positions it for continued market development.
LPG Industry Company Market Share
LPG Industry Market Report: 2019-2033
This comprehensive report provides an in-depth analysis of the global Liquefied Petroleum Gas (LPG) industry, offering invaluable insights for investors, industry professionals, and strategic decision-makers. The report covers the period 2019-2033, with a base year of 2025 and a forecast period of 2025-2033. We project a market valued at $XX Million in 2025, demonstrating strong growth potential. This detailed analysis leverages extensive research across various segments, including production sources, applications, and geographic regions, providing a holistic view of the LPG market's dynamic landscape.
LPG Industry Market Structure & Competitive Landscape
The global Liquefied Petroleum Gas (LPG) industry operates within a moderately concentrated market structure. While a cadre of major international corporations, including but not limited to Exxon Mobil Corporation, Novatek PAO, China Petroleum & Chemical Corporation, ConocoPhillips, Reliance Gas, QatarEnergy, BP PLC, Indian Oil Corporation Ltd, Gazprom PJSC, and Abu Dhabi National Oil Company (ADNOC), significantly shape the global landscape, a substantial number of smaller, agile regional players also contribute meaningfully to overall market volume. This competitive arena is defined by intense rivalry across multiple fronts: aggressive pricing strategies, relentless pursuit of technological innovation to enhance efficiency and safety, and strategic expansion initiatives to broaden market reach and secure market share.
- Market Concentration: The market's structure, as indicated by an estimated Herfindahl-Hirschman Index (HHI) of XX, signifies a moderate level of concentration, where a few large entities hold substantial market power, but with room for significant contributions from smaller competitors.
- Innovation Drivers: Continuous technological advancements in LPG extraction, refining, storage, and transportation are pivotal in driving operational efficiencies and reducing overall costs. The development and adoption of new, cleaner-burning LPG blends are also gaining significant momentum, catering to growing environmental concerns and regulatory demands.
- Regulatory Impacts: Government regulations, particularly those pertaining to emissions standards and safety protocols across the entire LPG value chain, exert a profound influence on production, distribution, and consumption patterns. Fluctuations in governmental policies concerning subsidies, taxation, and import/export controls can significantly alter market dynamics and profitability.
- Product Substitutes: The market share and demand for LPG are intrinsically linked to the availability, pricing, and performance of key substitutes such as natural gas, electricity, and various biofuels. The competitive positioning of LPG is constantly evaluated against these alternatives in different application segments.
- End-User Segmentation: The LPG market is broadly segmented into Residential, Commercial & Industrial, Auto-fuels, and Other applications. Each segment possesses unique demand drivers, growth trajectories, and specific challenges, necessitating tailored strategies from market participants.
- M&A Trends: The industry experiences a discernible level of merger and acquisition (M&A) activity, predominantly fueled by strategic imperatives for market consolidation, portfolio optimization, and geographic expansion. The cumulative value of M&A transactions between 2019 and 2024 is estimated to be approximately $XX Million, reflecting a dynamic consolidation phase.
LPG Industry Market Trends & Opportunities
The global LPG market is witnessing robust growth, driven by increasing energy demand, particularly in developing economies. The market is expected to register a Compound Annual Growth Rate (CAGR) of xx% during the forecast period (2025-2033), reaching a projected value of $XX Million by 2033. This growth trajectory is being fueled by several factors, including urbanization, industrialization, and increasing adoption of LPG in various applications. Technological advancements, such as improved storage and transportation technologies, are also contributing to the market expansion. The rising popularity of LPG as a cleaner and more efficient fuel compared to traditional alternatives is attracting significant investments in the sector, leading to increased market penetration rates. Shifting consumer preferences towards cleaner energy sources, coupled with supportive government policies and initiatives, provide substantial growth opportunities in the LPG industry. Competitive dynamics include price wars, capacity expansions, and strategic alliances, further shaping the market landscape. Market penetration rates vary significantly across regions and applications, indicating scope for further expansion in underserved markets.
Dominant Markets & Segments in LPG Industry
The Asia-Pacific region constitutes a leading market for LPG, driven primarily by high population density, rapidly growing economies, and increasing urbanization. Within this region, India and China are dominant countries, owing to their vast populations and rising energy demand.
Source of Production: Natural gas liquids (NGLs) are the primary source of LPG production, followed by crude oil refining.
Application:
- Residential: Strong growth fueled by rising disposable incomes and growing preference for cleaner cooking fuels.
- Commercial & Industrial: Demand driven by manufacturing, heating, and industrial processes.
- Autofuels: Significant potential for expansion, particularly in developing economies with less stringent emission regulations.
- Other Applications: Diverse applications including petrochemicals and aerosols represent a niche segment.
Key Growth Drivers:
- Robust Infrastructure Development: Investments in LPG infrastructure including pipelines, storage facilities, and bottling plants, particularly in developing economies.
- Government Policies and Subsidies: Government support aimed at promoting LPG as a cleaner fuel source and enhancing its accessibility.
- Technological Advancements: Innovation in LPG extraction, storage, and transportation technologies.
LPG Industry Product Analysis
LPG products are primarily differentiated based on their purity levels and the incorporation of specialized additives designed to optimize performance and precisely meet the demanding requirements of diverse applications. Technological advancements are consistently focused on enhancing product efficiency, bolstering safety features, and improving environmental performance. These advancements manifest as specialized additive formulations that promote more complete combustion, significantly reduce harmful emissions, and elevate overall product quality. The competitive landscape is characterized by intense rivalry, with companies striving to differentiate themselves by offering superior product quality, competitive pricing, and innovative product features that resonate with consumer needs and regulatory mandates.
Key Drivers, Barriers & Challenges in LPG Industry
Key Drivers: The LPG industry's growth is propelled by a confluence of factors, including the escalating energy demand in burgeoning developing economies, supportive government initiatives promoting the adoption of cleaner fuels, continuous technological advancements in extraction and distribution infrastructure, increasing affordability for end-users, and the inherent versatility of LPG across a wide spectrum of industrial, commercial, and domestic applications.
Challenges and Restraints: Significant challenges that impact the LPG sector include the inherent price volatility of crude oil, which directly influences LPG production costs and profitability. Supply chain disruptions, whether due to geopolitical events, logistical hurdles, or natural disasters, can lead to unpredictable price fluctuations and potential supply shortages. Stringent environmental regulations, particularly concerning emissions, may necessitate substantial and costly upgrades to existing infrastructure. Furthermore, robust competition from alternative energy sources, such as natural gas and electricity, presents an ongoing challenge to LPG's market share. The industry also grapples with persistent concerns regarding safety in handling and transportation, as well as complex logistical challenges in reaching remote or underserved markets. The cumulative estimated impact of these challenges on overall market growth is projected to be approximately an XX% reduction.
Growth Drivers in the LPG Industry Market
Technological advancements in LPG extraction, processing, and distribution are continuously driving enhanced operational efficiency and contributing to cost reductions across the value chain. Supportive government initiatives aimed at promoting cleaner energy alternatives and ensuring national energy security are significant catalysts for increased LPG demand. The burgeoning trend of rising disposable incomes and increasing urbanization, particularly in developing economies, directly translates into higher energy consumption and, consequently, greater demand for LPG. The inherent versatility of LPG, enabling its use across a diverse array of applications ranging from domestic cooking to industrial processes and as a clean-burning fuel for vehicles, solidifies its position as a vital and adaptable energy source across numerous sectors.
Challenges Impacting LPG Industry Growth
Regulatory hurdles including emission standards and safety regulations influence production costs and market access. Supply chain disruptions and volatility in crude oil prices have a significant impact on profitability. Intense competition from substitute fuels hinders market expansion, while the safety concerns associated with LPG require strict adherence to safety standards.
Key Players Shaping the LPG Industry Market
- Exxon Mobil Corporation
- Novatek PAO
- China Petroleum & Chemical Corporation
- ConocoPhillips
- Reliance Gas
- QatarEnergy
- BP PLC
- Indian Oil Corporation Ltd
- Gazprom PJSC
- Abu Dhabi National Oil Company (ADNOC)
Significant LPG Industry Milestones
- October 2022: Maire Tecnimont S.p.A. awarded a USD 380 million EPC contract for an LPG extraction plant in Algeria. This signifies investment in expanding LPG production capacity.
- February 2022: Indian Oil Corp. announced plans to invest USD 43-46 million to increase LPG bottling capacity by 53%, highlighting the growing demand in the region.
Future Outlook for LPG Industry Market
The LPG industry is demonstrably poised for a sustained period of robust growth, primarily fueled by the escalating global energy demand, with a pronounced surge anticipated in developing nations. Strategic investments in expanding and modernizing infrastructure, coupled with ongoing technological advancements in developing cleaner-burning LPG blends, are set to unlock significant untapped market potential. The persistent global focus on enhancing energy security and transitioning towards cleaner fuel alternatives will further bolster this growth trajectory, thereby creating lucrative and expanding opportunities for industry participants. Nevertheless, effectively navigating and mitigating the inherent challenges associated with price volatility, potential supply chain disruptions, and evolving regulatory landscapes will be paramount for ensuring sustained and profitable growth in the coming years.
LPG Industry Segmentation
-
1. Source of Production
- 1.1. Crude Oil
- 1.2. Natural Gas Liquids
-
2. Application
- 2.1. Residential
- 2.2. Commercial & Industrial
- 2.3. Autofuels
- 2.4. Other Applications
LPG Industry Segmentation By Geography
-
1. North America
- 1.1. United States
- 1.2. Canada
- 1.3. Rest of North America
-
2. Europe
- 2.1. Norway
- 2.2. Netherlands
- 2.3. United Kingdom
- 2.4. Germany
- 2.5. Rest of Europe
-
3. Asia Pacific
- 3.1. China
- 3.2. India
- 3.3. South Korea
- 3.4. Japan
- 3.5. Rest of Asia Pacific
-
4. Middle East and Africa
- 4.1. Saudi Arabia
- 4.2. Qatar
- 4.3. South Africa
- 4.4. Rest of Middle East and Africa
-
5. South America
- 5.1. Brazil
- 5.2. Argentina
- 5.3. Chile
- 5.4. Rest of South America
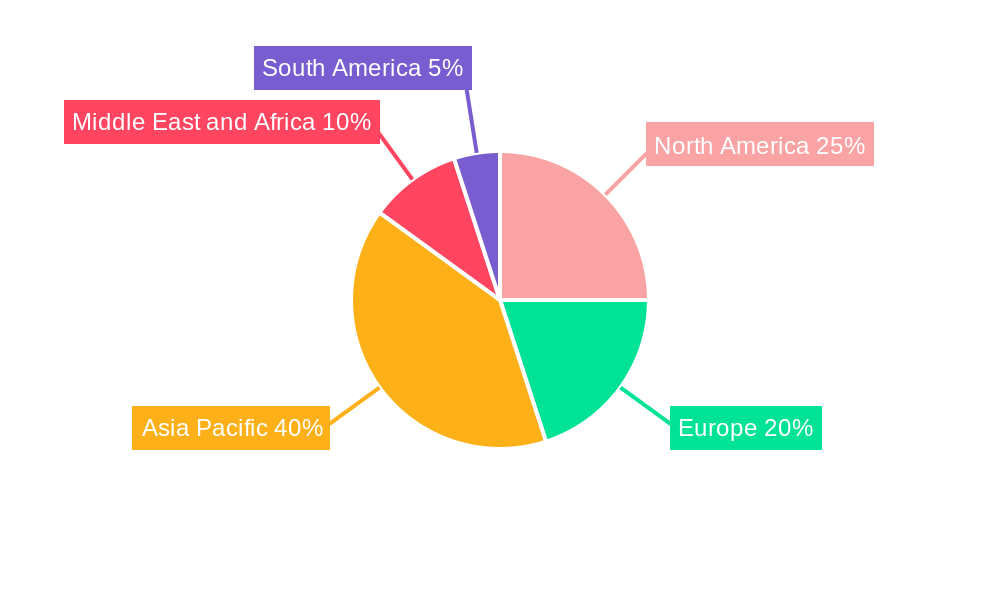
LPG Industry Regional Market Share
Geographic Coverage of LPG Industry
LPG Industry REPORT HIGHLIGHTS
| Aspects | Details |
|---|---|
| Study Period | 2020-2034 |
| Base Year | 2025 |
| Estimated Year | 2026 |
| Forecast Period | 2026-2034 |
| Historical Period | 2020-2025 |
| Growth Rate | CAGR of 3.9% from 2020-2034 |
| Segmentation |
|
Table of Contents
- 1. Introduction
- 1.1. Research Scope
- 1.2. Market Segmentation
- 1.3. Research Objective
- 1.4. Definitions and Assumptions
- 2. Executive Summary
- 2.1. Market Snapshot
- 3. Market Dynamics
- 3.1. Market Drivers
- 3.2. Market Restrains
- 3.3. Market Trends
- 3.4. Market Opportunities
- 4. Market Factor Analysis
- 4.1. Porters Five Forces
- 4.1.1. Bargaining Power of Suppliers
- 4.1.2. Bargaining Power of Buyers
- 4.1.3. Threat of New Entrants
- 4.1.4. Threat of Substitutes
- 4.1.5. Competitive Rivalry
- 4.2. PESTEL analysis
- 4.3. BCG Analysis
- 4.3.1. Stars (High Growth, High Market Share)
- 4.3.2. Cash Cows (Low Growth, High Market Share)
- 4.3.3. Question Mark (High Growth, Low Market Share)
- 4.3.4. Dogs (Low Growth, Low Market Share)
- 4.4. Ansoff Matrix Analysis
- 4.5. Supply Chain Analysis
- 4.6. Regulatory Landscape
- 4.7. Current Market Potential and Opportunity Assessment (TAM–SAM–SOM Framework)
- 4.8. TIR Analyst Note
- 4.1. Porters Five Forces
- 5. Market Analysis, Insights and Forecast 2021-2033
- 5.1. Market Analysis, Insights and Forecast - by Source of Production
- 5.1.1. Crude Oil
- 5.1.2. Natural Gas Liquids
- 5.2. Market Analysis, Insights and Forecast - by Application
- 5.2.1. Residential
- 5.2.2. Commercial & Industrial
- 5.2.3. Autofuels
- 5.2.4. Other Applications
- 5.3. Market Analysis, Insights and Forecast - by Region
- 5.3.1. North America
- 5.3.2. Europe
- 5.3.3. Asia Pacific
- 5.3.4. Middle East and Africa
- 5.3.5. South America
- 5.1. Market Analysis, Insights and Forecast - by Source of Production
- 6. Global LPG Industry Analysis, Insights and Forecast, 2021-2033
- 6.1. Market Analysis, Insights and Forecast - by Source of Production
- 6.1.1. Crude Oil
- 6.1.2. Natural Gas Liquids
- 6.2. Market Analysis, Insights and Forecast - by Application
- 6.2.1. Residential
- 6.2.2. Commercial & Industrial
- 6.2.3. Autofuels
- 6.2.4. Other Applications
- 6.1. Market Analysis, Insights and Forecast - by Source of Production
- 7. North America LPG Industry Analysis, Insights and Forecast, 2020-2032
- 7.1. Market Analysis, Insights and Forecast - by Source of Production
- 7.1.1. Crude Oil
- 7.1.2. Natural Gas Liquids
- 7.2. Market Analysis, Insights and Forecast - by Application
- 7.2.1. Residential
- 7.2.2. Commercial & Industrial
- 7.2.3. Autofuels
- 7.2.4. Other Applications
- 7.1. Market Analysis, Insights and Forecast - by Source of Production
- 8. Europe LPG Industry Analysis, Insights and Forecast, 2020-2032
- 8.1. Market Analysis, Insights and Forecast - by Source of Production
- 8.1.1. Crude Oil
- 8.1.2. Natural Gas Liquids
- 8.2. Market Analysis, Insights and Forecast - by Application
- 8.2.1. Residential
- 8.2.2. Commercial & Industrial
- 8.2.3. Autofuels
- 8.2.4. Other Applications
- 8.1. Market Analysis, Insights and Forecast - by Source of Production
- 9. Asia Pacific LPG Industry Analysis, Insights and Forecast, 2020-2032
- 9.1. Market Analysis, Insights and Forecast - by Source of Production
- 9.1.1. Crude Oil
- 9.1.2. Natural Gas Liquids
- 9.2. Market Analysis, Insights and Forecast - by Application
- 9.2.1. Residential
- 9.2.2. Commercial & Industrial
- 9.2.3. Autofuels
- 9.2.4. Other Applications
- 9.1. Market Analysis, Insights and Forecast - by Source of Production
- 10. Middle East and Africa LPG Industry Analysis, Insights and Forecast, 2020-2032
- 10.1. Market Analysis, Insights and Forecast - by Source of Production
- 10.1.1. Crude Oil
- 10.1.2. Natural Gas Liquids
- 10.2. Market Analysis, Insights and Forecast - by Application
- 10.2.1. Residential
- 10.2.2. Commercial & Industrial
- 10.2.3. Autofuels
- 10.2.4. Other Applications
- 10.1. Market Analysis, Insights and Forecast - by Source of Production
- 11. South America LPG Industry Analysis, Insights and Forecast, 2020-2032
- 11.1. Market Analysis, Insights and Forecast - by Source of Production
- 11.1.1. Crude Oil
- 11.1.2. Natural Gas Liquids
- 11.2. Market Analysis, Insights and Forecast - by Application
- 11.2.1. Residential
- 11.2.2. Commercial & Industrial
- 11.2.3. Autofuels
- 11.2.4. Other Applications
- 11.1. Market Analysis, Insights and Forecast - by Source of Production
- 12. Competitive Analysis
- 12.1. Company Profiles
- 12.1.1 Exxon Mobil Corporation
- 12.1.1.1. Company Overview
- 12.1.1.2. Products
- 12.1.1.3. Company Financials
- 12.1.1.4. SWOT Analysis
- 12.1.2 Novatek PAO
- 12.1.2.1. Company Overview
- 12.1.2.2. Products
- 12.1.2.3. Company Financials
- 12.1.2.4. SWOT Analysis
- 12.1.3 China Petroleum & Chemical Corporation
- 12.1.3.1. Company Overview
- 12.1.3.2. Products
- 12.1.3.3. Company Financials
- 12.1.3.4. SWOT Analysis
- 12.1.4 ConocoPhillips
- 12.1.4.1. Company Overview
- 12.1.4.2. Products
- 12.1.4.3. Company Financials
- 12.1.4.4. SWOT Analysis
- 12.1.5 Reliance Gas*List Not Exhaustive
- 12.1.5.1. Company Overview
- 12.1.5.2. Products
- 12.1.5.3. Company Financials
- 12.1.5.4. SWOT Analysis
- 12.1.6 QatarEnergy
- 12.1.6.1. Company Overview
- 12.1.6.2. Products
- 12.1.6.3. Company Financials
- 12.1.6.4. SWOT Analysis
- 12.1.7 BP PLC
- 12.1.7.1. Company Overview
- 12.1.7.2. Products
- 12.1.7.3. Company Financials
- 12.1.7.4. SWOT Analysis
- 12.1.8 Indian Oil Corporation Ltd
- 12.1.8.1. Company Overview
- 12.1.8.2. Products
- 12.1.8.3. Company Financials
- 12.1.8.4. SWOT Analysis
- 12.1.9 Gazprom PJSC
- 12.1.9.1. Company Overview
- 12.1.9.2. Products
- 12.1.9.3. Company Financials
- 12.1.9.4. SWOT Analysis
- 12.1.10 Abu Dhabi National Oil Company (ADNOC)
- 12.1.10.1. Company Overview
- 12.1.10.2. Products
- 12.1.10.3. Company Financials
- 12.1.10.4. SWOT Analysis
- 12.1.1 Exxon Mobil Corporation
- 12.2. Market Entropy
- 12.2.1 Company's Key Areas Served
- 12.2.2 Recent Developments
- 12.3. Company Market Share Analysis 2025
- 12.3.1 Top 5 Companies Market Share Analysis
- 12.3.2 Top 3 Companies Market Share Analysis
- 12.4. List of Potential Customers
- 13. Research Methodology
List of Figures
- Figure 1: Global LPG Industry Revenue Breakdown (billion, %) by Region 2025 & 2033
- Figure 2: North America LPG Industry Revenue (billion), by Source of Production 2025 & 2033
- Figure 3: North America LPG Industry Revenue Share (%), by Source of Production 2025 & 2033
- Figure 4: North America LPG Industry Revenue (billion), by Application 2025 & 2033
- Figure 5: North America LPG Industry Revenue Share (%), by Application 2025 & 2033
- Figure 6: North America LPG Industry Revenue (billion), by Country 2025 & 2033
- Figure 7: North America LPG Industry Revenue Share (%), by Country 2025 & 2033
- Figure 8: Europe LPG Industry Revenue (billion), by Source of Production 2025 & 2033
- Figure 9: Europe LPG Industry Revenue Share (%), by Source of Production 2025 & 2033
- Figure 10: Europe LPG Industry Revenue (billion), by Application 2025 & 2033
- Figure 11: Europe LPG Industry Revenue Share (%), by Application 2025 & 2033
- Figure 12: Europe LPG Industry Revenue (billion), by Country 2025 & 2033
- Figure 13: Europe LPG Industry Revenue Share (%), by Country 2025 & 2033
- Figure 14: Asia Pacific LPG Industry Revenue (billion), by Source of Production 2025 & 2033
- Figure 15: Asia Pacific LPG Industry Revenue Share (%), by Source of Production 2025 & 2033
- Figure 16: Asia Pacific LPG Industry Revenue (billion), by Application 2025 & 2033
- Figure 17: Asia Pacific LPG Industry Revenue Share (%), by Application 2025 & 2033
- Figure 18: Asia Pacific LPG Industry Revenue (billion), by Country 2025 & 2033
- Figure 19: Asia Pacific LPG Industry Revenue Share (%), by Country 2025 & 2033
- Figure 20: Middle East and Africa LPG Industry Revenue (billion), by Source of Production 2025 & 2033
- Figure 21: Middle East and Africa LPG Industry Revenue Share (%), by Source of Production 2025 & 2033
- Figure 22: Middle East and Africa LPG Industry Revenue (billion), by Application 2025 & 2033
- Figure 23: Middle East and Africa LPG Industry Revenue Share (%), by Application 2025 & 2033
- Figure 24: Middle East and Africa LPG Industry Revenue (billion), by Country 2025 & 2033
- Figure 25: Middle East and Africa LPG Industry Revenue Share (%), by Country 2025 & 2033
- Figure 26: South America LPG Industry Revenue (billion), by Source of Production 2025 & 2033
- Figure 27: South America LPG Industry Revenue Share (%), by Source of Production 2025 & 2033
- Figure 28: South America LPG Industry Revenue (billion), by Application 2025 & 2033
- Figure 29: South America LPG Industry Revenue Share (%), by Application 2025 & 2033
- Figure 30: South America LPG Industry Revenue (billion), by Country 2025 & 2033
- Figure 31: South America LPG Industry Revenue Share (%), by Country 2025 & 2033
List of Tables
- Table 1: Global LPG Industry Revenue billion Forecast, by Source of Production 2020 & 2033
- Table 2: Global LPG Industry Revenue billion Forecast, by Application 2020 & 2033
- Table 3: Global LPG Industry Revenue billion Forecast, by Region 2020 & 2033
- Table 4: Global LPG Industry Revenue billion Forecast, by Source of Production 2020 & 2033
- Table 5: Global LPG Industry Revenue billion Forecast, by Application 2020 & 2033
- Table 6: Global LPG Industry Revenue billion Forecast, by Country 2020 & 2033
- Table 7: United States LPG Industry Revenue (billion) Forecast, by Application 2020 & 2033
- Table 8: Canada LPG Industry Revenue (billion) Forecast, by Application 2020 & 2033
- Table 9: Rest of North America LPG Industry Revenue (billion) Forecast, by Application 2020 & 2033
- Table 10: Global LPG Industry Revenue billion Forecast, by Source of Production 2020 & 2033
- Table 11: Global LPG Industry Revenue billion Forecast, by Application 2020 & 2033
- Table 12: Global LPG Industry Revenue billion Forecast, by Country 2020 & 2033
- Table 13: Norway LPG Industry Revenue (billion) Forecast, by Application 2020 & 2033
- Table 14: Netherlands LPG Industry Revenue (billion) Forecast, by Application 2020 & 2033
- Table 15: United Kingdom LPG Industry Revenue (billion) Forecast, by Application 2020 & 2033
- Table 16: Germany LPG Industry Revenue (billion) Forecast, by Application 2020 & 2033
- Table 17: Rest of Europe LPG Industry Revenue (billion) Forecast, by Application 2020 & 2033
- Table 18: Global LPG Industry Revenue billion Forecast, by Source of Production 2020 & 2033
- Table 19: Global LPG Industry Revenue billion Forecast, by Application 2020 & 2033
- Table 20: Global LPG Industry Revenue billion Forecast, by Country 2020 & 2033
- Table 21: China LPG Industry Revenue (billion) Forecast, by Application 2020 & 2033
- Table 22: India LPG Industry Revenue (billion) Forecast, by Application 2020 & 2033
- Table 23: South Korea LPG Industry Revenue (billion) Forecast, by Application 2020 & 2033
- Table 24: Japan LPG Industry Revenue (billion) Forecast, by Application 2020 & 2033
- Table 25: Rest of Asia Pacific LPG Industry Revenue (billion) Forecast, by Application 2020 & 2033
- Table 26: Global LPG Industry Revenue billion Forecast, by Source of Production 2020 & 2033
- Table 27: Global LPG Industry Revenue billion Forecast, by Application 2020 & 2033
- Table 28: Global LPG Industry Revenue billion Forecast, by Country 2020 & 2033
- Table 29: Saudi Arabia LPG Industry Revenue (billion) Forecast, by Application 2020 & 2033
- Table 30: Qatar LPG Industry Revenue (billion) Forecast, by Application 2020 & 2033
- Table 31: South Africa LPG Industry Revenue (billion) Forecast, by Application 2020 & 2033
- Table 32: Rest of Middle East and Africa LPG Industry Revenue (billion) Forecast, by Application 2020 & 2033
- Table 33: Global LPG Industry Revenue billion Forecast, by Source of Production 2020 & 2033
- Table 34: Global LPG Industry Revenue billion Forecast, by Application 2020 & 2033
- Table 35: Global LPG Industry Revenue billion Forecast, by Country 2020 & 2033
- Table 36: Brazil LPG Industry Revenue (billion) Forecast, by Application 2020 & 2033
- Table 37: Argentina LPG Industry Revenue (billion) Forecast, by Application 2020 & 2033
- Table 38: Chile LPG Industry Revenue (billion) Forecast, by Application 2020 & 2033
- Table 39: Rest of South America LPG Industry Revenue (billion) Forecast, by Application 2020 & 2033
Frequently Asked Questions
1. What is the projected Compound Annual Growth Rate (CAGR) of the LPG Industry?
The projected CAGR is approximately 3.9%.
2. Which companies are prominent players in the LPG Industry?
Key companies in the market include Exxon Mobil Corporation, Novatek PAO, China Petroleum & Chemical Corporation, ConocoPhillips, Reliance Gas*List Not Exhaustive, QatarEnergy, BP PLC, Indian Oil Corporation Ltd, Gazprom PJSC, Abu Dhabi National Oil Company (ADNOC).
3. What are the main segments of the LPG Industry?
The market segments include Source of Production, Application.
4. Can you provide details about the market size?
The market size is estimated to be USD 123.14 billion as of 2022.
5. What are some drivers contributing to market growth?
4.; Increasing Demand for Gasoline and Diesel Across the Globe4.; Rapid Expansion of Automotive Industry.
6. What are the notable trends driving market growth?
LPG Extracted from Natural Gas Liquids to Dominate the Market.
7. Are there any restraints impacting market growth?
4.; Strict Mandates by the Global Organizations on VGO Composition.
8. Can you provide examples of recent developments in the market?
In October 2022, Maire Tecnimont S.p.A. announced that its principal subsidiary, Tecnimont S.p.A., was awarded an EPC contract by SONATRACH's Direction Centrale Engineering & Project Management for the execution of an LPG extraction plant within the existing Rhourde El Baguel oil and gas treatment complex in northeastern Algeria. The total contract value is around USD 380 million.
9. What pricing options are available for accessing the report?
Pricing options include single-user, multi-user, and enterprise licenses priced at USD 4750, USD 5250, and USD 8750 respectively.
10. Is the market size provided in terms of value or volume?
The market size is provided in terms of value, measured in billion.
11. Are there any specific market keywords associated with the report?
Yes, the market keyword associated with the report is "LPG Industry," which aids in identifying and referencing the specific market segment covered.
12. How do I determine which pricing option suits my needs best?
The pricing options vary based on user requirements and access needs. Individual users may opt for single-user licenses, while businesses requiring broader access may choose multi-user or enterprise licenses for cost-effective access to the report.
13. Are there any additional resources or data provided in the LPG Industry report?
While the report offers comprehensive insights, it's advisable to review the specific contents or supplementary materials provided to ascertain if additional resources or data are available.
14. How can I stay updated on further developments or reports in the LPG Industry?
To stay informed about further developments, trends, and reports in the LPG Industry, consider subscribing to industry newsletters, following relevant companies and organizations, or regularly checking reputable industry news sources and publications.
Methodology
Step 1 - Identification of Relevant Samples Size from Population Database


Step 2 - Approaches for Defining Global Market Size (Value, Volume* & Price*)

Note*: In applicable scenarios
Step 3 - Data Sources
Primary Research
- Web Analytics
- Survey Reports
- Research Institute
- Latest Research Reports
- Opinion Leaders
Secondary Research
- Annual Reports
- White Paper
- Latest Press Release
- Industry Association
- Paid Database
- Investor Presentations

Step 4 - Data Triangulation
Involves using different sources of information in order to increase the validity of a study
These sources are likely to be stakeholders in a program - participants, other researchers, program staff, other community members, and so on.
Then we put all data in single framework & apply various statistical tools to find out the dynamic on the market.
During the analysis stage, feedback from the stakeholder groups would be compared to determine areas of agreement as well as areas of divergence